while WE slept: USTs mixed / steeper on LIGHT volumes; 10s to 4.5%? "Increasing S&P 500 Target to 5400" (UBS following Goldilocks, last week) and somewhat more...
Good morning … I hope you enjoy a short break from this spammation and … we’re back … Global Wall waking up to some news from the Far East …
RTRS: China slashes mortgage reference rates to revive property market SCMP: China’s largest cut to key mortgage rate a ‘step in the right direction’ to prop up economy ahead of ‘two sessions’ (this one from IGMs Press Picks … below) ZH: China Supercharges Stimulus With Biggest Cut In Mortgage Reference Rate On Record (I’m sure it’s nothing … )
… (slightly) more on the cut below … and as the holiday shortened week gets underway, I thought I’d start and share a (slightly) different looking visual of 10s inspired by Citi comments below (10s up TO 4.5%?) …
… where this one a simple line and level of interest — 10s in and around 4.25%. Being a DAILY chart it is inherently more shorter-term in nature and so the (WEEKLY)framework below is still quite valid but … lots of variables (Fedspeak — FOMC101 HERE and … China) as always and scalping a bit here and there never a bad thing … here it appears to be an interesting outright ‘nominal’ (psychologically important) level with a potentially bullish cross in momentum … WATCHING and tomorrow we’ll have a look at 20yr yields ahead of the liquidity event … aka AUCTION and for now … here is a snapshot OF USTs as of 705a:
… HEREis what this shop says be behind the price action overnight…
… WHILE YOU SLEPT Treasuries are mixed with the curve twisting steeper around a little changed 10-year point. China slashed their 5-year LPR by a record 25bp (see above) this morning. DXY is lower (-0.15%) while front WTI futures are too (-0.45%). Asian stocks were mixed, EU and UK share markets are little changed on balance while ES futures are showing -0.3% here at 7:10am. Our overnight US rates flows saw 5yr outperformance on curve this morning in light, post-holiday volumes. We did see light buying in the belly, aided by a firm trade in Bunds and especially Gilts this morning. Overnight Treasury volume was ~65% of average.
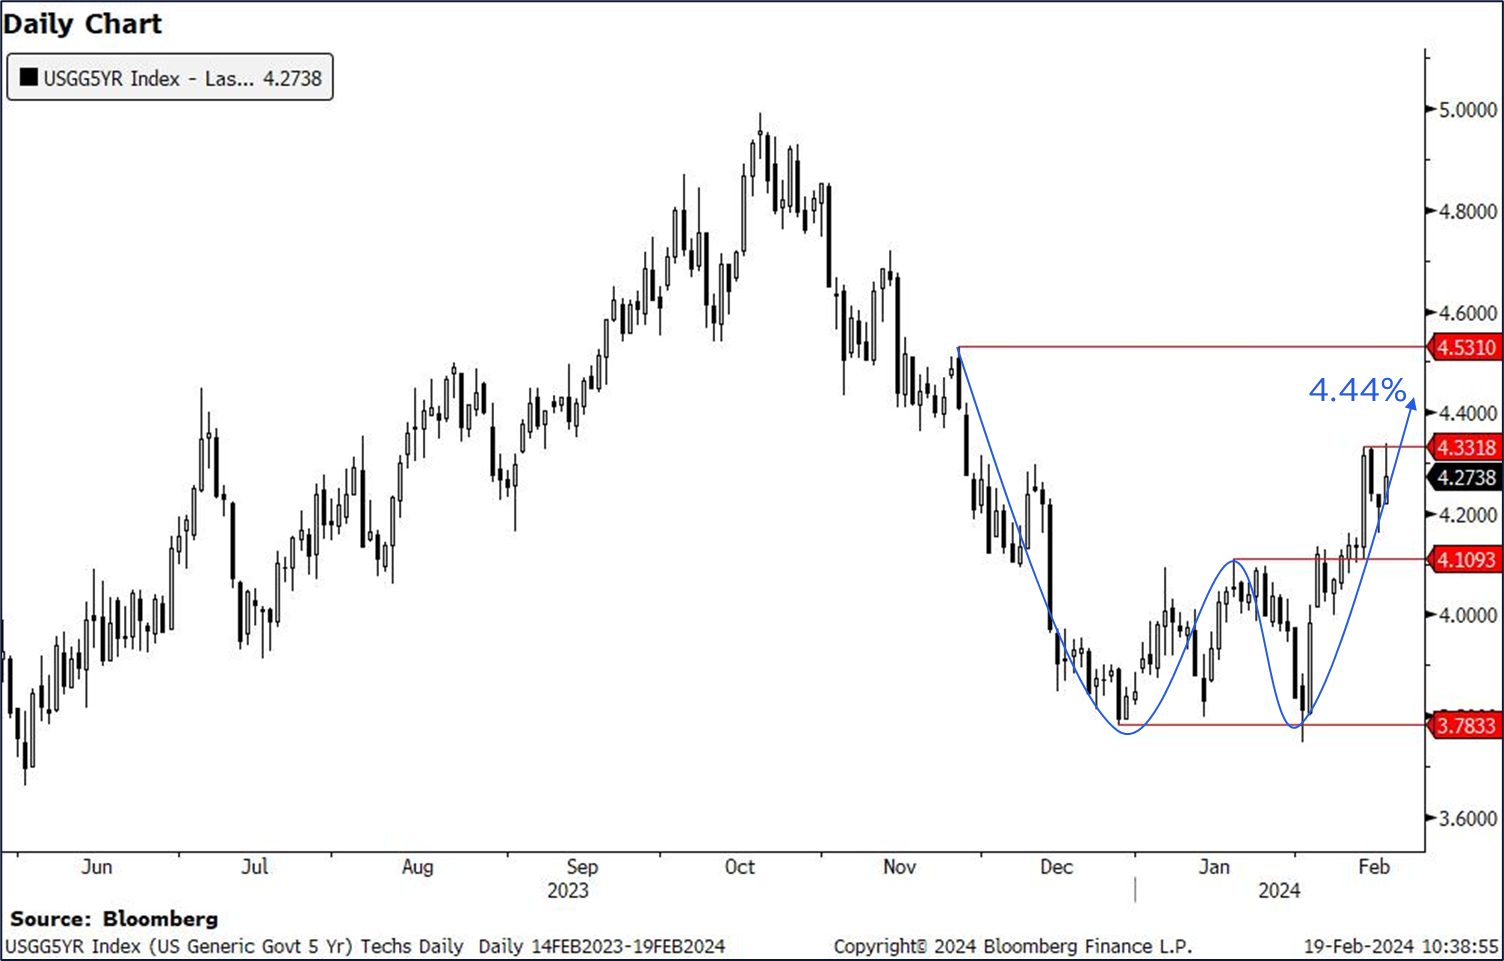
… We were impressed that Treasury 5yr yields held support (4.30% area) into last week's close and despite another hotter-than-expected inflation print (PPI). The still-deep oversold condition (see first attachment, lower panel) hints that investors may have been largely braced for numbers like Friday's- leaving 5yr yields roughly in the middle of CPI day's (Feb 13th) range this morning.
… and for some MORE of the news you might be able to use…
NEWSQUAWK: US Market Open: European bourses mixed, US equities lower & RTY lags, Dollar softer & Antipodeans supported by the PBoC 5yr LPR cut … Bonds are firmer with specifics-light; Bunds unreactive to the latest ECB EZ negotiated wages metrics
US 10y yields: Weekly techs developments suggest we could see a renewed US rates selloff, with 10y yields potentially rising another 30bps.
Why it matters: 10y yields have closed decisively above the double bottom neckline on a weekly basis. Furthermore, we also saw a bounce off the neckline support on Thursday.
Considering the building blocks, we think we are set for another leg higher in yields. First layer of resistance will be at 4.33% (recent highs), followed by 4.40% (psychological level). Double bottom suggests we could see a move towards 4.58%.
Technical indicators:
Double bottom formation with neckline at 4.2%, and a formation indicated target of ~4.58%. We saw a weekly close above this level.
Bounce off from neckline-turned support at 4.2% on Thursday.
Charts
Source: Citi, Bloomberg
US 5y yields: 5y yields have also completed a double-bottom setup on a weekly basis. The double bottom indicated target is at 4.44%. That said, first layer of resistance is likely at the recent highs of 4.33%.
Source: Citi, Bloomberg
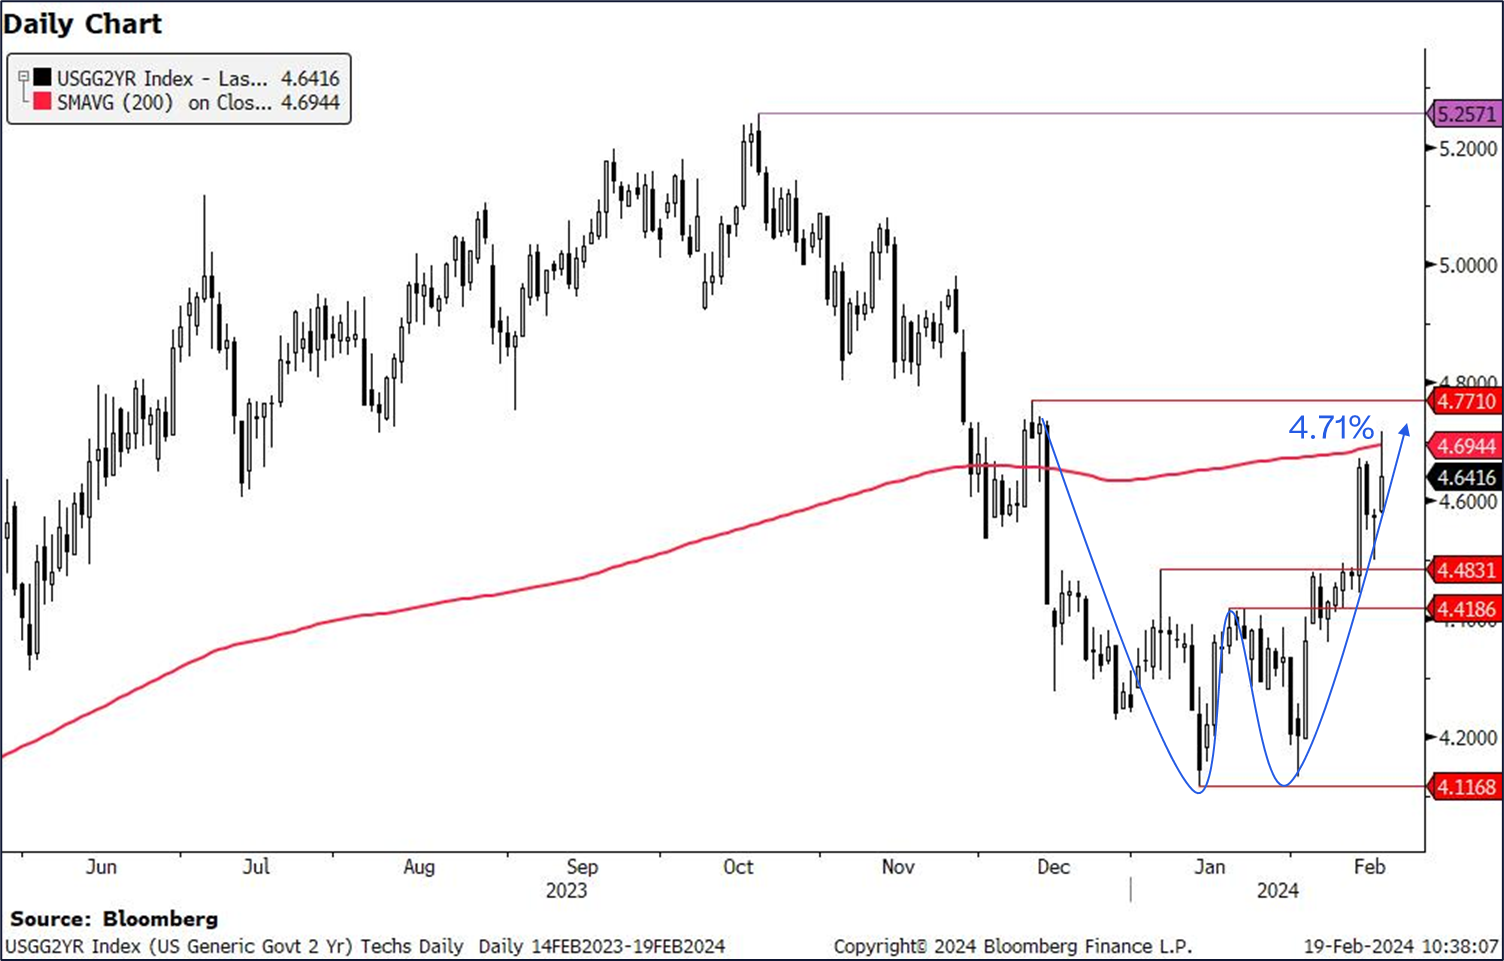
US 2y yields: Yields are testing resistance at 4.69%-4.77% (200d MA, double bottom formation indicated target and Dec high). Given the strong resistance at this area, we think 2y yield upside could be limited.
… However Asian equity markets are slipping this morning even after the PBOC cut the benchmark five-year loan prime rate (LPR), the peg for most mortgages, by 25bps to 3.95%, marking its first cut since June, and more than expected. Our Chinese economists have just published a piece here looking at the implications of the cut. They kept the one-year LPR, the peg for most household and corporate loans, unchanged at 3.45%.
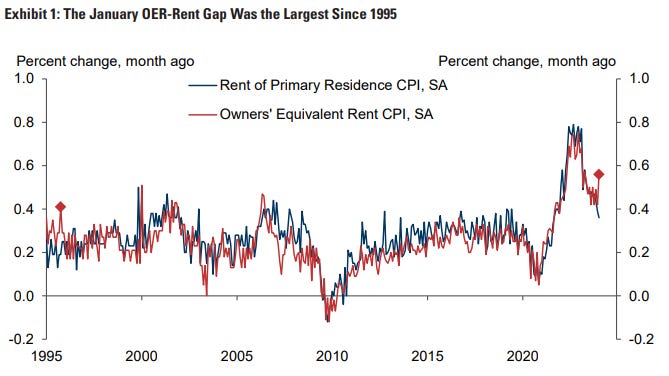
We expected and indeed received a large “January effect” in last week’s price data, with CPI and PPI both surprising consensus to the upside. In our view, the bigger surprise was the 0.56% spike in owners’ equivalent rents (OER), which outperformed the primary rent measure by the most since 1995. In this edition of the Analyst, we explore the scope for OER to continue to outperform and the implications of the January price data for the inflation and policy outlook…
… We are not too concerned about the strength elsewhere in the January CPI and PPI reports. January price changes tend to be cyclical and volatile—what we call the “January effect”—and usually, sequential inflation slows back down in February. We had already assumed a January effect in healthcare—where the lag between costs and prices is particularly long. Additionally, 3- and 6-month trimmed inflation remained rangebound in January, despite a boost from the January effect. Taken together, we are boosting our 2024 core PCE forecast only modestly, by 0.1pp to 2.3% (December yoy).
The January FOMC statement indicates that rate cuts will likely commence once inflation is moving sustainably toward 2%. If inflation evolves as we expect, core PCE inflation would fall to 2.5% at the time of the May meeting, and participants would likely anticipate further declines over the next two months given the high base effects in mid-2023. Accordingly, we continue to forecast five 25bp cuts in the Fed funds rate this year, with the first cut at the May meeting. This being said, last week’s price data raise the stakes for the February CPI and PPI reports to confirm that the January jump in OER and non-housing services were both temporary.
Unusual policy mix may be crowding out the private economy and may explain the narrowness of equity market performance. As this is likely to persist for now, we recommend sticking with high quality growth and operational efficiency factors. Today, we present related screens for stock selection.
… The other policy variable at work is the massive liquidity being provided by the reverse repo to pay for these deficits. Since the end of 2022, this facility has fallen by over $2 trillion and is another reason why financial conditions have loosened to levels not seen since the fed funds rate was closer to 1%. This funding mechanism is part of the policy mix that may be making it challenging for the Fed’s rate hikes to do their intended work on the labor market and inflation. It may also help to explain why the Fed continues to walk back market expectations about the timing of the first cut and perhaps the number of cuts that are likely to occur this year.
… The bond market appears to be onto this and has started to price out some of the cuts it priced in since last fall. The Fed has been fairly firm with its guidance that a March cut was unlikely if the data didn't support it. Further, Fed guidance has also suggested 6-7 cuts this year were also fairly unlikely, implying a more gradual path of potential cuts. This is in line with the Fed's dot plot from last year and our economists' forecast. While the back end of the bond market has reacted to this potentially slower pace of cuts, equity valuations have not ( Exhibit 5 ), creating a divergence that could be reconciled either via lower rates or lower multiples…
Monetary policy is now very data dependent. For the Fed, both growth and inflation matter, but for the BoE and the ECB, it is just inflation.
The Fed, the Bank of England, and the ECB all hiked rates to fight inflation, and now we are looking for cuts from each this year. For our call for a June Fed rate cut, both growth and inflation matter. But our call for a May and June start on the east side of the Atlantic depends only on inflation. “Data dependent” has different meanings.
At the January Fed meeting, Chair Powell said continued disinflation like in prior months was needed to cut, but he also emphasized disinflation being “sustainably” on track, not simply touching the 2% target. Until Thursday’s retail sales data, market narrative began to flirt a possible re-acceleration, spoiling the latter condition. January inflation data showed strength in services, and payrolls showed a tight labor market that might pick up steam. The retail sales data pushed in the opposite direction, and we think the slower growth will prevail over time. For now, market pricing is consistent with our call for 100bps of cuts, starting in June. In the 1990s, arguably a variation on a soft landing, market expectations swung in one direction only to course correct because of choppy data. I have noted several times that the 1990s are a helpful example of an unusual cycle, one with an abbreviated cutting cycle as the underlying strength of the economy was sustained.
Bullish, but Not Bullish Enough Last December, we published S&P 500 to 4850 by YE 2024, Risks to the Upside, which highlighted the strength of earnings and the economy. On January 16, we increased our target to 5150 as the backdrop improved even further. Despite our bullish outlook, it appears we were not bullish enough.
Demand-Driven Inflation Positive for Stocks Returns and profits are measured in nominal dollars. Put differently, higher inflation tends to be a positive for stock prices. While the market sold off on more robust CPI and PPI reports last week, our work indicates that these demand-driven readings are constructive for future returns.
Economic Data Robust Economic data has been particularly strong since the start of the year. Key takeaways:
Consumer Confidence - U. Michigan survey has risen 3 months in a row
Payrolls - 353k NFPs vs.185k survey
ISM Manufacturing - 1 month change: 47.1 to 49.1, new orders 47.0 to 52.5
Economic Surprise - Vertical move higher in surprises since mid-January
1Q24 GDP - GDPNow forecast of 2.9% growth
2024 GDP - Consensus forecast from 1.3% in December to 1.6% today
Target from 5150 to 5400, 2024 EPS from $235 to $240 We are increasing our 2024 S&P 500 target from 5150 to 5400. This new target represents 7.9% potential upside through year end. We are also increasing our 2024-25 EPS estimates from $235 to $240, and $250 to $255, implying 9.1% and 6.3% growth over the next 2 years (vs. consensus estimates of 10.5% and 13.2%)…
…Rates: Bond market on data-dependent mode While 10yr Treasuries have sold off 41bps since the rally on the NYCB headlines, they are only about 15bp cheaper than before the news. We feel more confident about longs in 2s, as it will be difficult to price out more cuts in light of how high real FF is. 10yr reals should get support at 2%, meaning BEs should be somewhat more volatile than reals at these levels The US 30yr swap spreads are near recent lows, but can go lower as repo central clearing is likely to make it difficult for insurance companies to lock in the long term repo to do bond forwards. More of the duration overlay strategy should happen by receiving fixed…
Wells Fargo: Should We Worry About American Debt?: Time to Reconsider?
Summary
Total debt in the U.S. economy has risen from $69 trillion in 2019 to more than $92 trillion currently. When measured as a percent of GDP, however, total debt is not significantly higher today than it was five years ago. In sum, the total debt situation has not gotten meaningfully worse since 2019, but it has not gotten considerably better either.
In our view, there really is not much need to worry about the aggregate amount of household debt. The household sector has de-levered significantly since the global financial crisis, and its debt service ratio currently stands near a historic low.
The debt position of the non-financial corporate sector appears to be generally manageable at present, although we are watching developments in the private credit markets. We could become more concerned about NFC debt in coming years if debt issuance in the private credit markets stays robust, especially if interest rates remain elevated.
We feel less sanguine about the debt position of the federal government, where the debt-to-GDP ratio currently stands near its highest level since the end of the Second World War. Moreover, the Congressional Budget Office projects that the debt-to-GDP ratio of the federal government will nearly double over the next thirty years under the assumption of unchanged legislation.
A financial crisis that is provoked by excessive government debt does not appear to be imminent. There simply are not good substitutes for Treasury securities among sovereign debt obligations, and the Treasury Department is able to sell its bills, notes and bonds at reasonable interest rates. However, the trajectory in the debt-to-GDP ratio that CBO projects appears to be unsustainable to us.
Halting, if not reversing, the rise in the government's debt-to-GDP ratio will require painful choices that involve higher taxes and/or lower spending on programs that have been essentially "untouchable." We hope Americans can summon the courage to make these choices before market forces require them.
Yardeni DEEP DIVE: Why Were Economists So Wrong? (others, not him, of course :))
Why were so many economists and strategists so wrong in their predictions of a recession over the past two years? Now seems to be a good time to answer this question since there are lots of lessons to be learned from the widely held misconceptions of the past two years.
Let’s review them:
(1/10) Tight monetary policies always cause recessions. The Fed raised the federal funds rate (FFR) by 525bps to 5.25%-5.50% from March 2022 through July 2023. That’s the most aggressive round of rate hikes since the late 1970s, when then-Fed Chair Paul Volcker let the FFR soar (Fig. 7 below). The past 10 recessions were preceded by a series of rate hikes.
Figure 7
Over the past two years, Fed officials expected that rate hikes and QT would bring inflation down by weakening interest-sensitive demand, boosting the unemployment rate, and slowing the real GDP growth rate. The pessimists logically expected a recession to ensue, as it had in the past and as confirmed by the LEI and inverted yield curve.
We argued that the economy would prove to be resilient and that the result would be rolling recessions in different sectors of the economy, not an economy-wide recession. This scenario had played out before, during the mid-1980s and mid-2010s.
This time, over the past two years, there was a relatively moderate and short recession in single-family housing, but multi-family construction remained strong (Fig. 8 below). There was a relatively long but shallow growth recession among consumer goods producers and providers, while demand for consumer services rose over the past two years (Fig. 9 below). In fact, demand for goods remained relatively flat near its post-pandemic record high. It rose to a new record high in December.
… And from Global Wall Street inbox TO the WWW,
Bloomberg:A $6 Trillion Wall of Cash Is Holding Firm as Fed Delays Cuts
Last year’s cash surge ‘wasn’t a flash in the pan,’ Crane says
Corporate cashpile hit a record $4.4 trillion in third quarter
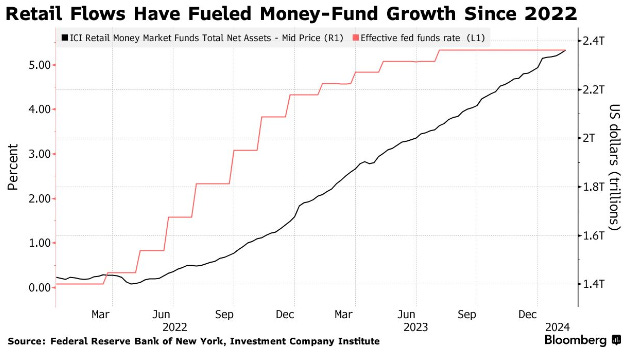
… Investors have added $128 billion to US money-market funds since the start of the year, Investment Company Institute data show. Companies were sitting on a record $4.4 trillion of cash at the end of the third quarter, and after a flood of more than $1 trillion of T-bills since mid-2023, the market has room for more.
…As a result, more than $1 trillion flowed into money funds last year, the most for any year seen in ICI records dating back to 2007. Those inflows helped money funds keep up with the ramp-up in T-bill issuance, and the gap between total money-market assets and total bills outstanding, albeit narrowing, still suggests there’s appetite for short-dated government debt.
… On the flip side, about $1 trillion is set to flow into the industry in 2024 from companies that have yet to move cash en masse, according to Deborah Cunningham, chief investment officer for global liquidity markets at Federated Hermes.
That’s borne out in ICI data showing retail investors accounting for about 80% of the $1.198 trillion that has flowed into the money fund space since March 2022, with institutions making up the remainder.
Defeating inflation without crashing the economy is still a challenge.
… There is, however, a competing explanation: Maybe monetary policy isn’t all that tight. That is, maybe the neutral, inflation-adjusted interest rate — the level that neither stimulates nor damps growth — is higher than Fed officials’ estimate of 0.5%, meaning that the current federal funds rate is less restrictive of growth. I think this is right: Large and chronic fiscal deficits, together with public subsidies for green investment, have pushed up the neutral interest rate. If so, the Fed should hold rates higher for longer.
Second, how tight is the labor market? There are signs of easing despite the sub-4% unemployment rate. The ratio of unfilled jobs to unemployed workers has fallen significantly, and wage inflation has decelerated — to 5.0% from 6.1% a year earlier according to the Atlanta Fed wage tracker, and to 4.3% from 5.1% a year earlier according to the employment cost index for private workers…
…With so much needing to be clarified, Fed officials will necessarily be paying close attention to incoming data. It’s possible that developments could push them to keep rates high well beyond May. They must also consider the market’s expectations: If hopes for rate cuts are dashed, financial conditions could tighten and restrain growth too much. Striking the right balance, and achieving the desired soft landing, remains a challenge.
Bloomberg: Bond Funds Are Not as Safe as You Thought (OpED)
If your pension-savings strategy involves fixed-income products, you may want to reconsider.
Bloomberg: How US Regulators Are Overhauling the Treasuries Market
WolfST: Some of the 49 Small Banks Heavily Exposed to Bad Multifamily CRE Loans May Topple, but their Size Limits Contagion: Fitch


Wanted to post this:
https://youtu.be/1RQ_nKYKKEA?si=oFKXK0YHGqL-bQI5
Danielle DiMartino Booth & Jim Bianco: Recession vs "No Landing," Rate Cuts, and Bitcoin vs. ETFs