Good morning / afternoon / evening - please choose whichever one which best describes when ever it may be that YOU are stumbling across this weekends SPECIAL EDITION note…
On this day back in 2009, the following occurred …
… And with that, his legend a bell was rung and his legend was cemented … did it matter? Up to you to decide but for us all not to pause on this day and reflect on the past, present and future, well … shame on US.
Moving on from some of these dated views TO a couple / few VIEWS you might be able to use … In addition TO what was noted HERE over this past weekend, here’s SOME of what Global Wall St is sayin’ …
With volatility contained in the face of negative catalysts, we are further emboldened in maintaining core exposure to FX carry.
We continue to like front-end TIPS, especially with carry seasonals turning increasingly favorable.
We like longs in Energy, as it is the sector least correlated with Tech and most attractive from a capital return perspective.
… In rates, the CPI-induced bear flattening of the Treasury curve last week obscured a more nuanced shift under the surface: front-end real yields fell against a move higher in real yields further out the curve, while inflation breakevens provided the catalyst to the broader nominal curve move (Figure 2). We’d argued recently that front-end TIPS offered a better risk/reward way to establish front-end longs against a backdrop of above-trend growth, supported by a relatively soft market-implied inflation profile. While that inflation profile has reset somewhat, the market still implies 2024 inflation below our forecast. And with the market having taken 2024 cut pricing down to less than 90bp, we continue to think real yield exposure has value. One other potential tailwind is that carry seasonals are turning increasingly favorable (with February the last negative carry month). While this dynamic (due to inflation accrual) is well understood and should be efficiently priced by the TIPS market, the degree of sensitivity to carry in the current environment could mean that improving carry provides a tailwind, supporting inflows into TIPS. We accordingly remain long 2y TIPS in our portfolio.
No sign of a “soft landing” CITI’S TAKE Data this week confirm that a soft landing has not been achieved and make us more convinced that one will not be. 0.39%MoM core CPI inflation shows that inflation remains more elevated and more volatile than pre-pandemic – six-month core PCE inflation will now rise to 2.4% from 1.9%. Declining retail sales, manufacturing production and rising continuing jobless claims all point to a softening economy. And higher inflation makes it even more difficult for the Fed to respond by lowering rates, further raising the probability of a recession. We continue to expect the first 25bp cut in June, around the same time the economy is more clearly entering recession.
MS: Sunday Start | What's Next in Global Macro: Crowding Out Drives Narrowness (keeping in mind ever SINCE DBs visual of the narrowness — full report HERE — everyone feels now obligated to weigh in and make the Mag7 their own … all I can say is … whatever. Jim Reid / DB said it best and first)
Four years ago, I wrote a Sunday Start, The Other 1 Percenters, in which I discussed the ever-growing divide between the haves and have-nots. This divide was not limited to consumers but included corporates as well. Fast forward to today, and it appears this gap has only gotten wider. Back then, the average company was experiencing earnings headwinds even though the economy was doing well, small caps and the average stock were underperforming the S&P 500 materially in both earnings and price terms, and the top 5 companies were dominating the market indices. Sound familiar?
Today, those divergences are even more extreme (Exhibit 1). Real GDP growth is similar to back then, while nominal GDP growth is higher due to inflation. Nevertheless, the earnings headwinds are just as strong despite higher nominal GDP, as many companies find it harder to pass along higher costs without damaging volumes. As a result, market performance is historically narrow, with the top 5 stocks accounting for a much higher percentage of the S&P 500 market cap than they did in early 2020. In short, the equity market understands this economy is not that great for the average company or consumer.
In my view, the narrowness is partly due to a very unusual mix of loose fiscal and tight monetary policy with accommodative liquidity …
… Bottom line: we continue to recommend investors focus on high-quality growth and operational efficiency factors when looking for stocks outside the top 5, which appear to be fairly valued based on their share of net income ( Exhibit 2 ). See our US equity strategy reports for screens on which names fit the bill.
… And from Global Wall Street inbox TO the WWW,
Apollo: Probability of a Fiscal Accident Is Rising
Government debt levels continue to increase in all G7 countries except Germany, and your finance textbook will tell you that when the stock of risk-free assets grows, it will attract dollars, euros, and yen from other asset classes, including credit and equities, see chart below.
The rapid growth in the stock of risk-free assets outstanding has consequences not only for risky assets. The probability is rising of a fiscal accident with significant implications for markets. Such a crisis could start with a sovereign downgrade, a bond auction with weak demand, or a significant increase in the term premium.
Six weeks into 2024, the bond market is struggling ... again.
YTD total return (through Feb 16) of the Bloomberg Agg Bond Index is -2.04% (blue line). Data started in 1976, so this is the 49th year of data. Only 1980, 2018, and 2022 had a worse start.
… “Increased profit estimates are the driver of the revision,” a team led by David Kostin wrote in a note to clients dated Friday.
Kostin now sees the S&P 500 rising to 5,200 by the end of this year, raising his forecast by about 2% from the 5,100 level he predicted in mid-December. The new target implies a 3.9% jump from Friday’s close.
In November, he initially projected the S&P 500 would hit 4,700 by the end of this year.
Goldman’s 5,200 price target for the S&P 500 in 2024 is now among the highest on Wall Street, joining the ranks of Wall Street bulls including Tom Lee of Fundstrat Global Advisors and Oppenheimer Asset Management chief strategist John Stoltzfus, who both hold a similar year-end outlook.
Sam Ro from TKer: Every macro layoffs discussion should start with this key metric
Stocks made new record highs, with the S&P 500 reaching a closing high of 5,029.73 on Thursday and an intraday high of 5,038.70 on Friday. For the week, the S&P shed 0.4%. The index is now up 4.9% year to date and up 39.9% from its October 12, 2022 closing low of 3,577.03.
The strength of the stock market seems in conflict with the plethora of news headlines on companies announcing layoffs. Here are a few from just the past week:
For starters, it’s important to understand what’s typical for layoffs across the economy.
According to the most recent monthly Job Openings & Labor Turnover Survey from the BLS, employers laid off 1.6 million people in December.
That’s a large number. But as the chart below shows, monthly layoffs during much of the current economic recovery have bounced around between 1.3 million and 1.8 million. During the prepandemic economic expansion, this figure trended between 1.6 million and 2 million.
It’s not unusual for employers to lay off over a million workers per month during economic booms. (Source: BLS via FRED)
There’s a lot to be said about all this. Here are a few points:
To get to 1.6 million layoffs, a lot of companies have to make a lot of layoffs. For example, 1,600 companies announcing 1,000 layoffs gets you to 1.6 million. That is to say, the layoffs reported in the news may just reflect an ongoing phenomenon in the economy.
The 1.6 million layoffs represent just 1.0% of total employment. This layoff rate has ranged from 0.9% and 1.2% for most of the current recovery. During the prepandemic economic expansion, this figure trended between 1.1% and 1.4%.
Many people who get laid off return to work pretty quickly. This is confirmed by the fact that employers hired 5.9 million people in December (This includes people who were hired after quitting jobs). Furthermore, according to BLS data, the U.S. economy has experienced net job creation for 37 consecutive months through January.
The national layoff data is a bit stale as it comes on a two month lag. However, the Labor Department’s weekly tally of initial claims for unemployment insurance benefits is very timely. During the week ending February 10, initial claims fell to 212,000, down from 220,000 the week prior. While this is above the September 2022 low of 182,000, it continues to trend at levels historically associated with economic growth.
To be clear, this is not to say there’s no chance this is a sign of trouble for the economy. Many economic metrics, including many labor market metrics, have cooled noticeably from very hot levels. There’s certainly a case to be made that we’re closer to the end of this economic expansion than we are at the beginning. (Read more about cooling economic metrics below in TKer’s weekly review of the macro crosscurrents.)
That said, it’s premature to conclude that the layoffs we’re currently reading about in the news is anything outside of what would be ordinary in an economic boom…
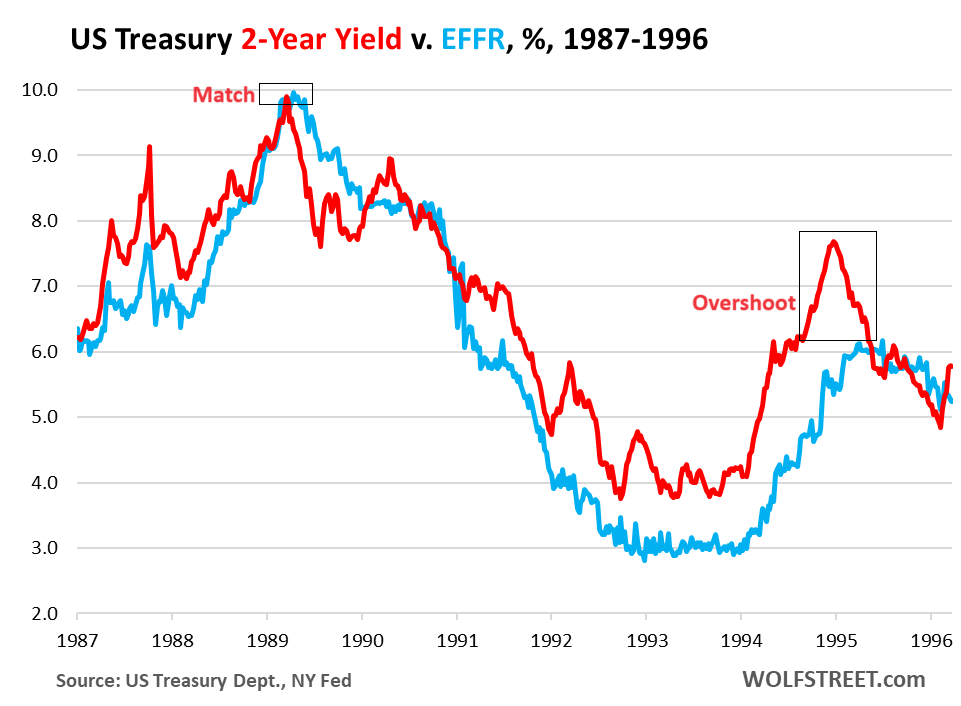
WolfST: Higher for Longer Inflation & Interest Rates Not Over Until the Fat Lady Sings? Waiting for the 2-Year Treasury Yield to Overshoot
… But in this cycle, the 2-year yield undershot. In November 2022, the 2-year yield went into denial and started dropping, even as the Fed would hike four more times. By December 2022, when the Fed hiked, the 2-year yield (red) fell below the EFFR (blue) and it has stayed below the EFFR ever since.
During the 2018 rate hikes, the 2-year yield overshot to 3%, behaving in the classic manner. The Fed hiked a final time in December, and the EFFR maxed out at around 2.4%. The 2-year yield had overshot by 60 basis points, and that did the trick:
Obviously, the 2-year yield is not some ghost that does what it wants; it’s an index that tracks the market for Treasury securities, which is a huge global market where humans and algos trade and bet. And the classic overshoot of the 2-year yield with regards to the EFFR was a sign that these humans and algos took the Fed seriously, and didn’t blow it off, and didn’t go into denial.
The fact that the 2-year yield undershot since December 2022 is a sign that these humans and algos have blown off the Fed, have not taken it seriously, and have been in denial about inflation and rate hikes.
This shows up in a stunning loosening of the financial conditions, with spreads narrowing for risky debt and with longer-term yields falling, and these loosening financial conditions are part of the fuel that is now driving inflation higher…
… The prior instances when the Fat Lady sang. … And here are the 1987-1989 rate hikes and the 1994 rate hikes. In 1994, the 2-year yield overshot by a huge margin (180 basis points), meaning that the markets took inflation and the Fed very seriously. In 1987, the 2-year yield overshot also bigly. But in 1989, at the peak of the rate-hike cycle, it matched the EFFR at 9.9%:
… Do we hafta wait until the Fat Lady sings? We’re not predicting the course of inflation. That’s a fool’s errand. But we know what is currently going on: Financial conditions have become loosey-goosey, which nurtures inflation. Government deficit spending is gigantic and also nurtures inflation. The demand by consumers and businesses is robust, and incomes started rising above the rate of CPI inflation in 2023. And there is just not a whole lot outside of the Fed’s short-term rates that is putting downward pressure on inflation.
We suspect that inflation and higher policy rates won’t be over until the Fat Lady sings. And this opera could last for a while as markets have been blowing off the Fed and are not doing what the Fed needs them to do: tighten financial conditions to bring down inflation…
… THAT is all for now … back TO the LONG weekend and somewhat more Tuesday!!


Wish I could say that Washington DC
has learned something since 2009,
but I can't.
DC has become even more out of touch,
even more intrusive, even more profligate, even more corrupt.
Great edition !!!