(USTs lower on decent volumes)while WE slept; #GotGILTS; watching stocks watching bonds watching stocks; BondKing doesn't like bonds; #FOMC101
Good morning.
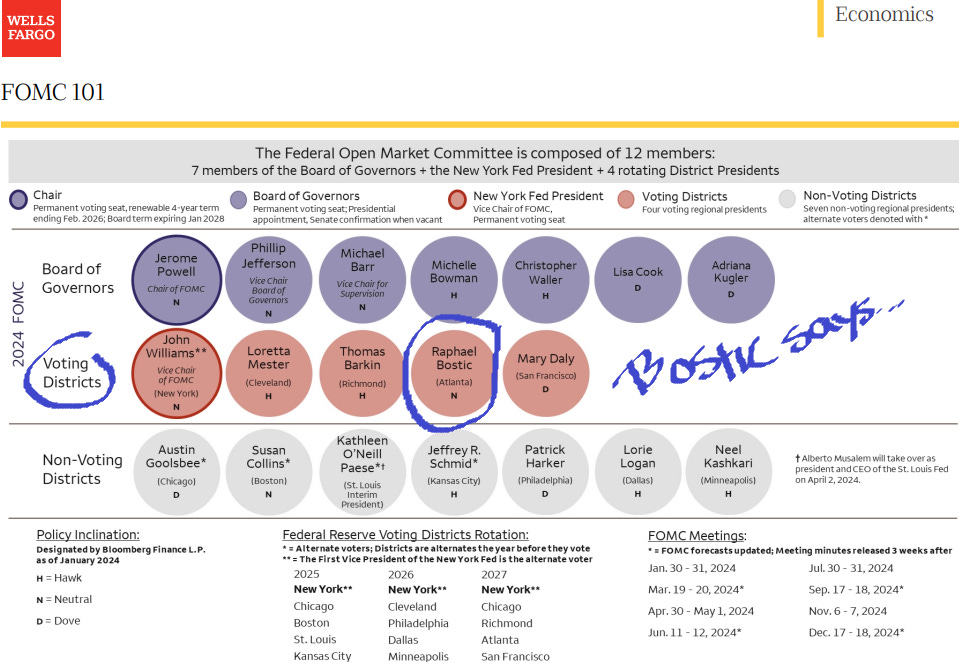
Bostic and Bowman and Bill Gross — yesterday was Fedspeak (and Bondspeak) brought to us by the letter “B”
Bloomberg: Fed's Michelle Bowman said inflation could fall toward the 2% target with interest rates held at current levels, and offered potential backing for lowering borrowing costs if price pressures fade.
Bloomberg: Atlanta Fed President Bostic said inflation has come down more than he expected and is on a path today to reaching the Fed’s 2% goal, though it’s too early to declare victory.
BOTH are voter (governors always vote and Atlanta Fed is IN rotation this year … for more, see Wells Fargos FOMC 101 just below.
And for MORE from the letter “B” as in BILL Gross not liking bonds, continue scrolling …
As far as today, here and NOW goes, before taking a look at this afternoons Treasury auction, it MAY be worth noting …
Bloomberg: UK 20-Year Bond Auction Sees Record Investor Demand
… Orders for a sale of 20-year bonds exceeded the £2.25 billion ($2.7 billion) on offer by more than 3.6 times, the most on record, according to data compiled by Bloomberg…
Treasury is set to auction 3s, 10s and bonds this week and today’s edition of supply will be on the front end … and most closely linked with rate cut / hike perceptions. Jumping right in, an updated look at 3yy …
… cheap enough to buy? NOT SURE this is ‘THE’ dip some (Jamie Dimon’s group, for example) are looking for … And while NOT wanting to steal tomorrows thunder, I will HINT that 10yy are respecting another of my random TLINES drawn in and left up to help guide … a bullish ‘sticksave’ for the time being as momentum moves from overBOUGHT to overSOLD and is now correcting …
… here is a snapshot OF USTs as of 710a:
… HERE is what this shop says be behind the price action overnight…
… WHILE YOU SLEPT
Treasuries are modestly lower but still outperforming the bear-steepening seen in the UK and German bond markets this morning. Over there, a heavy spate of EGB (Belgium, Holland and Italy today plus UK 20-years) and SSA issuance continues to weigh. Here's a 7:02am BBG headline on that: *EUROPE BOND SALES TOP €43 BILLION IN RECORD-BREAKING DAY. DXY is higher (+0.25%) while front WTI futures are also higher (+2.35%). Asian stocks were mixed, EU and UK share markets are all lower (SX5E -0.7%) while ES futures are showing -0.45% here at 7am. Our overnight US rates flows saw real$ buying in intermediates and the long-end during Asian hours though overall activity was limited then. During London's AM hours, our flows were mixed and there was a block FV-TY steepened (320k) that posted too. Overnight Treasury volume was decent at ~125% of average with much of the activity seen in 5yrs out to the long end...
… and for some MORE of the news you can use » The Morning Hark - 9 Jan 2024 and IGMs Press Picks (who CONTINUES to be sportin’ that new, fresh look) in effort to to help weed thru the noise (some of which can be found over here at Finviz).
Moving from some of the news to some of THE VIEWS you might be able to use… here’s SOME of what Global Wall St is sayin’ …
BARCAP FOMC Minutes NLP analysis: Near consensus on policy, but disagreement on the labor market (even the machines know what THEY don’t know)
We derive measures of agreement among FOMC participants on key topics, based on Natural Language Processing analysis of meeting minutes. This suggests that FOMC participants are broadly on the same page on policy decisions and inflation trends, but consensus on other matters – notably the jobs market – is more elusive.
BNP: US rates: Pulling forward the QT taper (so a defacto tightening means then higher rates…?)
We now expect the Fed to slow the pace of balance sheet runoff beginning in Q2 2024. Our baseline is for Treasury runoff to be halved from $60bn/mo to $30bn/mo.
An earlier slowing of QT does not necessarily equate to less reserve draining in aggregate and should have limited bearing on the outright level of yields. It does, however, argue for more gradual upward pressure on dollar funding costs and reduced tail risks around repo spikes, and is on balance an incremental positive for swap spreads.
We don’t see this as materially impacting the likelihood that Treasury will follow through with one more set of coupon increases. Instead, we anticipate it will result in slightly less bill supply to the market this year.
BNP Quant trades of the week (sellin’ 2s…)
KEY MESSAGES
Market Themes
We focus on upside risks to US economic data, which challenge current bearish USD positioning and rates pricing. We favour short US 2y and long USDMXN to capture this view.
We have a balanced risk outlook, with broad markets not appearing stretched and US credit compression supportive. However, risk does appear elevated in EM FX and US equities.
New trade ideas: Long USDMXN, Short US 2y, Long US expanded tech-software versus US biotechnology, Long palladium
… Looking for yield-sensitive CPI risk hedges: Our US economists see upside risk to US December inflation, with the headline rebounding to 3.4% y/y and core inflation stuck at 4.0%. This is above consensus expectations (3.3% and 3.8% respectively on Bloomberg). While our outlook for risk this week is balanced, our trades are negatively sensitive to the highyield environment and hence at risk of upside surprise on the CPI. To hedge this exposure, we look for assets in the MarFA™ universe that have attractive risk reward and are PC1 (global yield factor) sensitive.
While some assets look attractive from a valuations perspective, such as Thailand 2y or TWD, some deviations we observe are idiosyncratically driven and, hence the reversion to fair value is less likely. In Thailand, for example, inflation remains low (due to subsidies and low consumer demand), and high real interest rates are hurting credit demand. Hence markets should start to price in more rate cuts from BoT (for more see EM Asia: What you need to know this week (8-14 Jan)). And in USDTWD, the majority of the mispricing has already compressed and the move has been missed.
Overall, we favour hedging the US CPI risks using US 2y, given that it is 5bp (−0.3 z-scores) too low vs MarFA™ Macro and 5bp (−1.1 z-scores) too low vs MarFA™ Trading. We initiate a short UST 2y position, targeting 4.53%, the 1 z-score upper band of MarFA™ Trading.
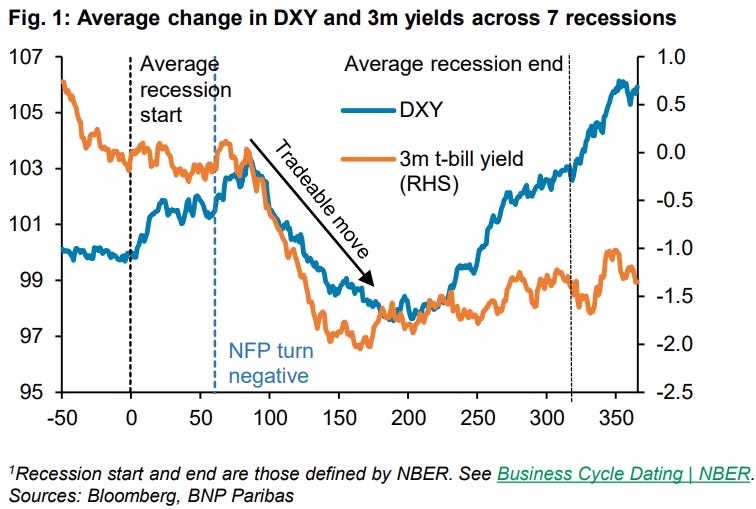
BNP: A guide to the USD in downturns (chart of USD and TBILLS had me at hello)
KEY MESSAGES
We project a US growth slowdown rather than a recession but wouldn’t rule out the market pricing in greater recession risks in 2024.
This note provides a framework for navigating a US growth slowdown, by examining USD performance in past US recessions.
We find that the USD tends to appreciate over the entirety of a recession, but the more tradeable move is a USD decline once the market prices a more imminent, front-loaded Fed cutting cycle.
The most reliable indicator to time the USD sell off during recessions is payrolls turning negative.
We will therefore look to add to our existing USD shorts should payrolls turn negative or the market begins pricing a more front-loaded Fed cutting cycle.
DB CoTD: The tightest correlation in decades? (for more on history, see just below BUT … watching stocks watching bonds watching stocks …)
… Today’s CoTD shows the S&P 500 and 10yr USTs since the beginning of August, where the start of this tight relationship began. It was seemingly triggered by the surprise “bearish” US quarterly refinancing announcement (QRA) and the implications for yields and with it risk. One quarter later and a more optimistic QRA (amongst other things) turned both around and again they moved in lockstep. Even in the last week where yields have backed up, equities have generally fallen.
Anyone who has looked at the history of the two will know this tight relationship won’t last forever as such correlations are typically unstable and can flip very quickly …
DB: Everything points to a soft landing except… history (a monthly chartbook worth flippin’ through IF you have access… a couple of MY fav charts incl below)
There’s no doubt that excitement about a soft landing has ramped up over the last couple of months. Recent data has pointed to continued growth in the US, and a Euro Area recession that stays relatively mild. Unemployment remains low by historic standards, whilst inflation has declined sharply. Indeed, if you look at inflation on either a 3m or 6m annualised basis, you could even argue it’s back at target on both sides of the Atlantic.
In turn, that’s led to growing hopes that central banks will be able to move rates out of restrictive territory. The Fed themselves have signalled 75bps of rate cuts this year, which helped trigger one of the biggest market rallies since the GFC over November and December.
So there’s certainly more evidence that central banks might have pulled off an extraordinary achievement from a very precarious starting point. And despite a soggy start to 2024, the market rally has helped loosen financial conditions and supported growth.
But despite some of the recent optimism, a look back into history and at some of the details in the current data suggest we need to be much more cautious.
For instance, It's still relatively early in a hiking cycle for a US recession to have started. Leading indicators are still looking concerning, and the 2s10s yield curve that’s inverted ahead of the last 10 recessions is still inverted. YoY money supply growth has just seen the biggest contraction since the 1930s, lending standards remain at recessionary levels, CRE and regional banks still have significant problems to deal with, and QT is still happening in the background. On top of this the US labour market is undoubtedly slowing. The soft landing thesis assumes it will plateau at the right level for balance but history suggests it rarely does.
So are the recent data prints right and can a soft landing be realised? Or are the warnings from history still valid? That will be the main battleground in 2024.
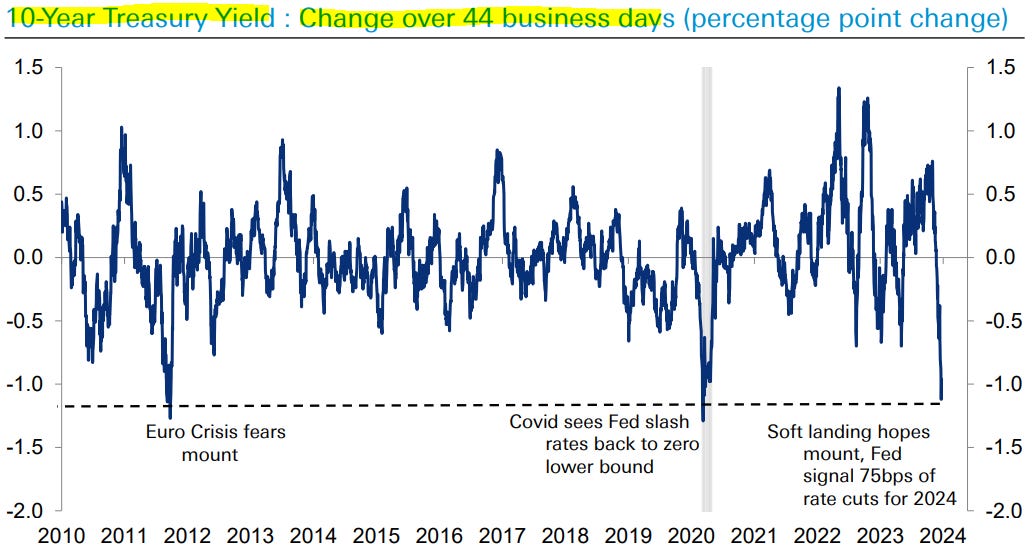
… since the aftermath of the GFC, we’ve only seen the 10yr Treasury yield fall this quickly on two other occasions
…We have never seen the money supply contract this fast without some sort of negative outcome…
Golidlocks: Wealth Effects Will Support Consumer Spending Growth in 2024 (written just like a Bernanke WaPO OpED back in the day … where ‘the day’ = November 2010 … oddly enough there’s no mention of higher MORTGAGE rates and as a friend who’s closing on a house in 2wks, said, having to wait 9mo to refi — builder will help — they’ll just learn to live poor and without kitchen table for ‘while … what next, GS will join chorus of how multiple job holders being sign econ and jobs market is awesome!?)
Equity and home prices have recovered from their declines in 2022, strengthening household balance sheets. This has left total household net worth as a share of disposable income near its all-time high, and the increases have been broad-based across the income distribution.
We estimate that wealth effects from past declines in asset prices were a drag on consumption growth in most of 2023, but the drag is now behind us. We expect gains in household wealth to boost quarterly annualized consumption growth by 0.4pp in 2024, assuming that equity prices rise 7% and home prices rise 5% by the end of 2024, as our strategists expect.
Wealth effects on consumer spending could look somewhat different in alternative scenarios for asset prices. A downside scenario in which equity and home prices decline at annual rates equivalent to their historical 10th percentiles (equity prices down 20%, home prices down 4%) could instead subtract roughly 0.5pp from 2024 consumption growth, while an upside scenario in which prices rise at their historical 90th percentile rates (equity prices up 20%, home prices up 12%) could instead provide a 0.9pp boost.
JPM: U.S. Fixed Income Markets Weekly (day lot dollar short but add TO ‘THE LIST’ created and offered Saturday morning - HERE - and representative of the fact there are all sorts of view and trades taking place ALL the time … find one you like and stick with it!)
…Governments
We covered tactical shorts and stay neutral duration on dovish Fed path, fair valuations, and neutral positioning, but look to add duration in the 3- to 5-year sectors in a selloff. Hold 5s/30s steepeners: the long end should steepen as we approach the first ease and this curve remains too flat to its drivers. We discuss risks of an earlier termination to the QT process, following this week’s minutes. A repetition of the 2019 QT timeline would result in reduced T-bill issuance over the course of the year and help improve the supply-demand backdrop in the Treasury market. We review record stripping activity over the course of December and the full year. Stay neutral on TIPS with valuations broadly fair and a mixed technical backdrop….…Treasuries
When the facts change, I change my mind
… Rates have staged a reversal since our last weekly publication on December 15: 2-year yields declined 1bp, while 5-, 10-, and 30-year yields have risen by 8bp, 11bp, and 17bp, respectively. This left long-end yields at their highest levels since the December FOMC meeting. We think a combination of technicals and fundamentals drove this move. On the technical side, we think both seasonals and supply dynamics contributed to the move, as we had flagged late last year. The curve bearishly steepened, as it has consistently done around year-end in the last 5- to 10-years (see Treasuries, US Fixed Income Markets Weekly, 12/15/23). Moreover, supply dynamics likely contributed to this as well: our colleagues in credit strategy had discussed the risks that HG issuance could be heavier and more front loaded than on average in January, and this week saw $55bn in issuance, or more than 40% of average January issuance levelsUBS (Donovan): Landing the soft landing (potentially historic given how many ‘soft landings’ have occurred over time…)
US November consumer credit jumped higher. Middle income consumers may borrow while still having savings to smooth consumption. Lower income consumers are more likely to borrow involuntarily (buying essentials on credit card, without having enough money to pay the bill at the end of the month). The increased dependence on credit supports consumer spending for now, but is a reminder that there are limits to spending—a soft economic landing is still an economic landing.
Consumers’ habits are indirectly revealed in November trade data from the US. These figures contribute to the complicated picture of a declining trade share in the global economy. Japanese consumer spending volumes fell more aggressively in November—Japanese consumers seem quick to react negatively to price increases. The UK’s December BRC shop sales (a value measure) slowed although UK consumers increasingly spend online rather than in shops around Christmas…
Wells Fargo: FOMC 101 (once again sending as I keep this one nearby so I can vet FOMC speakers and make my own uninformed decision IF whoever is speaking is worth listening too … :) )
… And from Global Wall Street inbox TO the WWW,
Bespoke: New Lows in the Search for Inflation (so, via GOOG search, NO LANDING?)
Google Search Trends
Google has an amazing tool that lets you monitor trends in US consumer search interest on its platform going back to 2004. We use it as an off-the-beaten-path economic indicator by looking at search interest for terms that people search for that are related to the broader economy as well as their personal financial conditions.
Below is a look at historical Google search interest trends for two words: inflation and recession. In early 2022 when GDP growth actually went negative for two quarters and inflation was raging, search interest for these two words exploded higher. Now? Both are making multi-year lows.
Bill GROSS (via TWEETER)
… On the bond front UST 10 yr at 4% is overvalued while 10 year TIP at 1.80 is the better choice. If you need to buy bonds. I don’t.
Bloomberg: Bill Gross Casts Shade on Treasuries, Sees 10-Year ‘Overvalued’ at 4% (ON BILL GROSS TWEETER)
Recommends shorter-end notes for those who want to invest
Treasuries rebound after selloff last week as oil prices slide
Fresh from getting a big call right on yields toward the end of last year, former bond king Bill Gross just signaled he is now steering clear of Treasuries.
Ten-year US debt is “overvalued,” with similar-dated Treasury Inflation-Protected Securities at a 1.80% yield the better choice if one needs to buy bonds, “I don’t” he wrote in a post on X.
Gross earned the moniker of “bond king” while at Pacific Investment Management Co., the firm he co-founded in the early 1970s. He made millions late last year after a big bet the Federal Reserve would pivot toward interest-rate cuts for 2024 benefited from a sizzling bond rally. That came after he warned in August that bond bulls were misguided, just before a two-month rout that sent yields to 16-year highs.
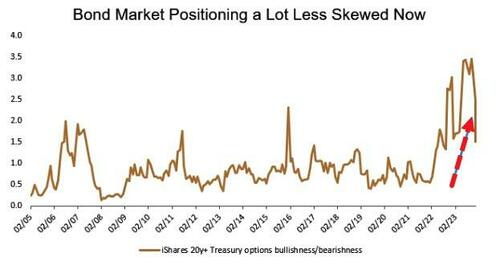
Bloomberg (via ZH): Treasury Option Positioning A Lot More Balanced As Bonds Correct (well THATS good .. I think…)(
The recent correction in the bond markets is being reflected in options positioning, with sentiment toward Treasuries showing a remarkable pullback from the exuberance we saw toward the go-go days of November and December.
As the chart shows, market positioning is a lot less lopsided now, especially given that fund managers are likely to hold onto or build on their conviction about the merits of duration this late in the cycle.
Even so, theta decay is probably a bigger risk than other Greeks, and last week’s jobs data that showed an acceleration in average hourly earnings growth of 4.1% in December - inconsistent with its 2% overall inflation target - would suggest that the urgency for the Fed to cut rates isn’t so high.
The Treasury 10-year maturity is fairly valued at 3.98% on my model, and at 4.03% as I write this, the incentive for a further increase in yields is limited.
The December reading of the inflation metrics is expected to bring “a touch higher” narrative in the on-month number, though core is expected to remain flat at 0.3%.
Barring shock readings higher, long-dated Treasuries will bob around current levels for now.
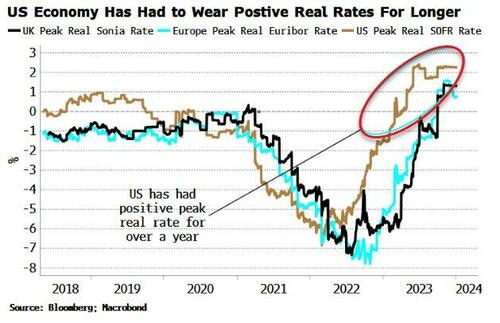
Bloomberg (via ZH): No Smoking Gun Yet To Justify Magnitude Of Fed Rate-Cuts (waiting for Godot leaning on history noted just above by DB …)
… Overall, the message from the data is of a jobs market that is slowing, but not at an accelerating rate.
That on its own (nor the weaker-than-expected ISM services data on Friday) is not enough to justify the size of the Fed cuts expected by the market (from an economic perspective, however after the bank’s December pivot, there’s good chance its reaction function may have changed).
But higher rates will increasingly bite as the year goes on, increasing the odds of a recession.
As the chart above shows, the US’s peak real rate has been positive from early last year, considerably longer than in Europe and the UK.
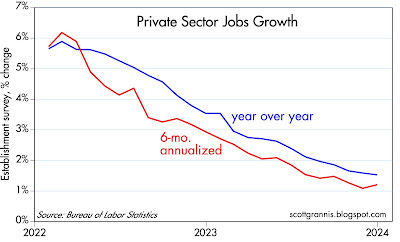
Calafia Beach Pundit: Economic slowdown on top of lower inflation begs for major adjustments (rate cuts PLEASE, now, please)
…The December jobs report was not as healthy as many claimed: private sector jobs were up at a mere 1.2% annualized pace in the past six months. Meanwhile, commodity prices are falling, as the dollar remains relatively strong. Used car prices are sharply deflating, both in real and nominal terms. …
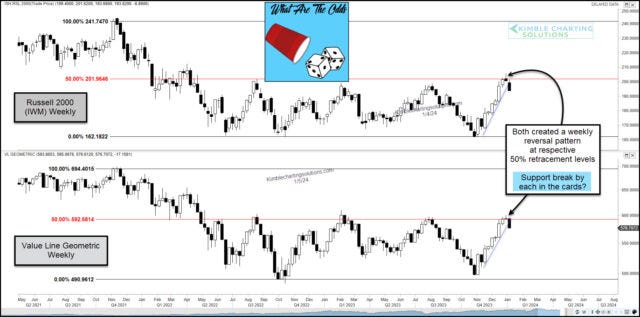
Kimble: 2 Key Stock Indexes Testing Breakout Levels At Same Time (everything is back to AWESOME as these two indices ‘bout to break higher at same time…)
For the past two years, the Russell 2000 and Value Line Geometric Indexes have been lagging.
Recently, however, both have come alive… adding a tailwind to the end of year rally.
BUT these short-term rallies may be in trouble. Which also could mean that the broad market rally is in trouble.
As you can see in today’s chart 2-pack, both of these lagging indices peaked at the respective 50% Fibonacci retracement level over the past two years. And it could be happening again.
Note that each index created a weekly reversal pattern over the past 2 weeks and are attempting to break down through up-trend support. Worth watching here, in my opinion.
Stock bulls would receive quite a bullish message if both break above the 50% levels at the same time!
The IRA (Inst Risk Analyst): Bank Reserves & Treasury Auctions
As the public debt of the US grows, after all, the implicit claim of the Treasury on all private US assets also grows…
… Treasury Secretary Janet Yellen and others in the establishment fuss about the need for central clearing in the market for US government debt. Yet do these luminaries that populate the Biden Administration understand that limiting market liquidity via regulations like Basel III, the Volcker Rule and now centralized clearing of Treasury debt, actually hurts market function?
Ponder the bid-to-cover ratio of the 10-year Treasury note below. Notice that the ratio has steadily declined as the size of the auctions has increased.
Source: Bloomberg
The steady increase in calls for the Fed to end its balance sheet runoff (aka “QT” in Fed newspeak) is really not about interest rates or the economy, but all about poor execution in the US Treasury market. Dallas Fed President Lori “Repo” Logan, the intellectual author of the Fed's various liquidity facilities, has been among those officials saying that the Fed should maybe end its balance sheet contraction soon. That’s a hint.
Notice in the chart above that the Fed's reverse repurchase agreement (RRP) facility has shrunk as money market funds moved into T-bills. Yet the overall system open market account (SOMA) is still over $7 trillion. That $2.5 trillion in low-coupon mortgage-backed securities is not moving at all. Those Fannie, Freddie and Ginnie Mae MBS with sub 4% percent coupons might as well be 15-year Treasury bonds in terms of effective maturity….
… The effective nationalization of the US bond markets and banks is the unspoken truth that President Logan and Fed Chairman Jerome Powell will never address publicly. Since the FOMC began targeting fed funds as a policy mechanism decades ago, the short-term interest rate market has become a function of FOMC policy and ever more frequent open market operations. Equity market investors do not seem to understand what this creeping nationalization of the heretofore private credit markets implies. As the public debt of the US grows, after all, the implicit claim of the Treasury on all private US assets also expands apace.
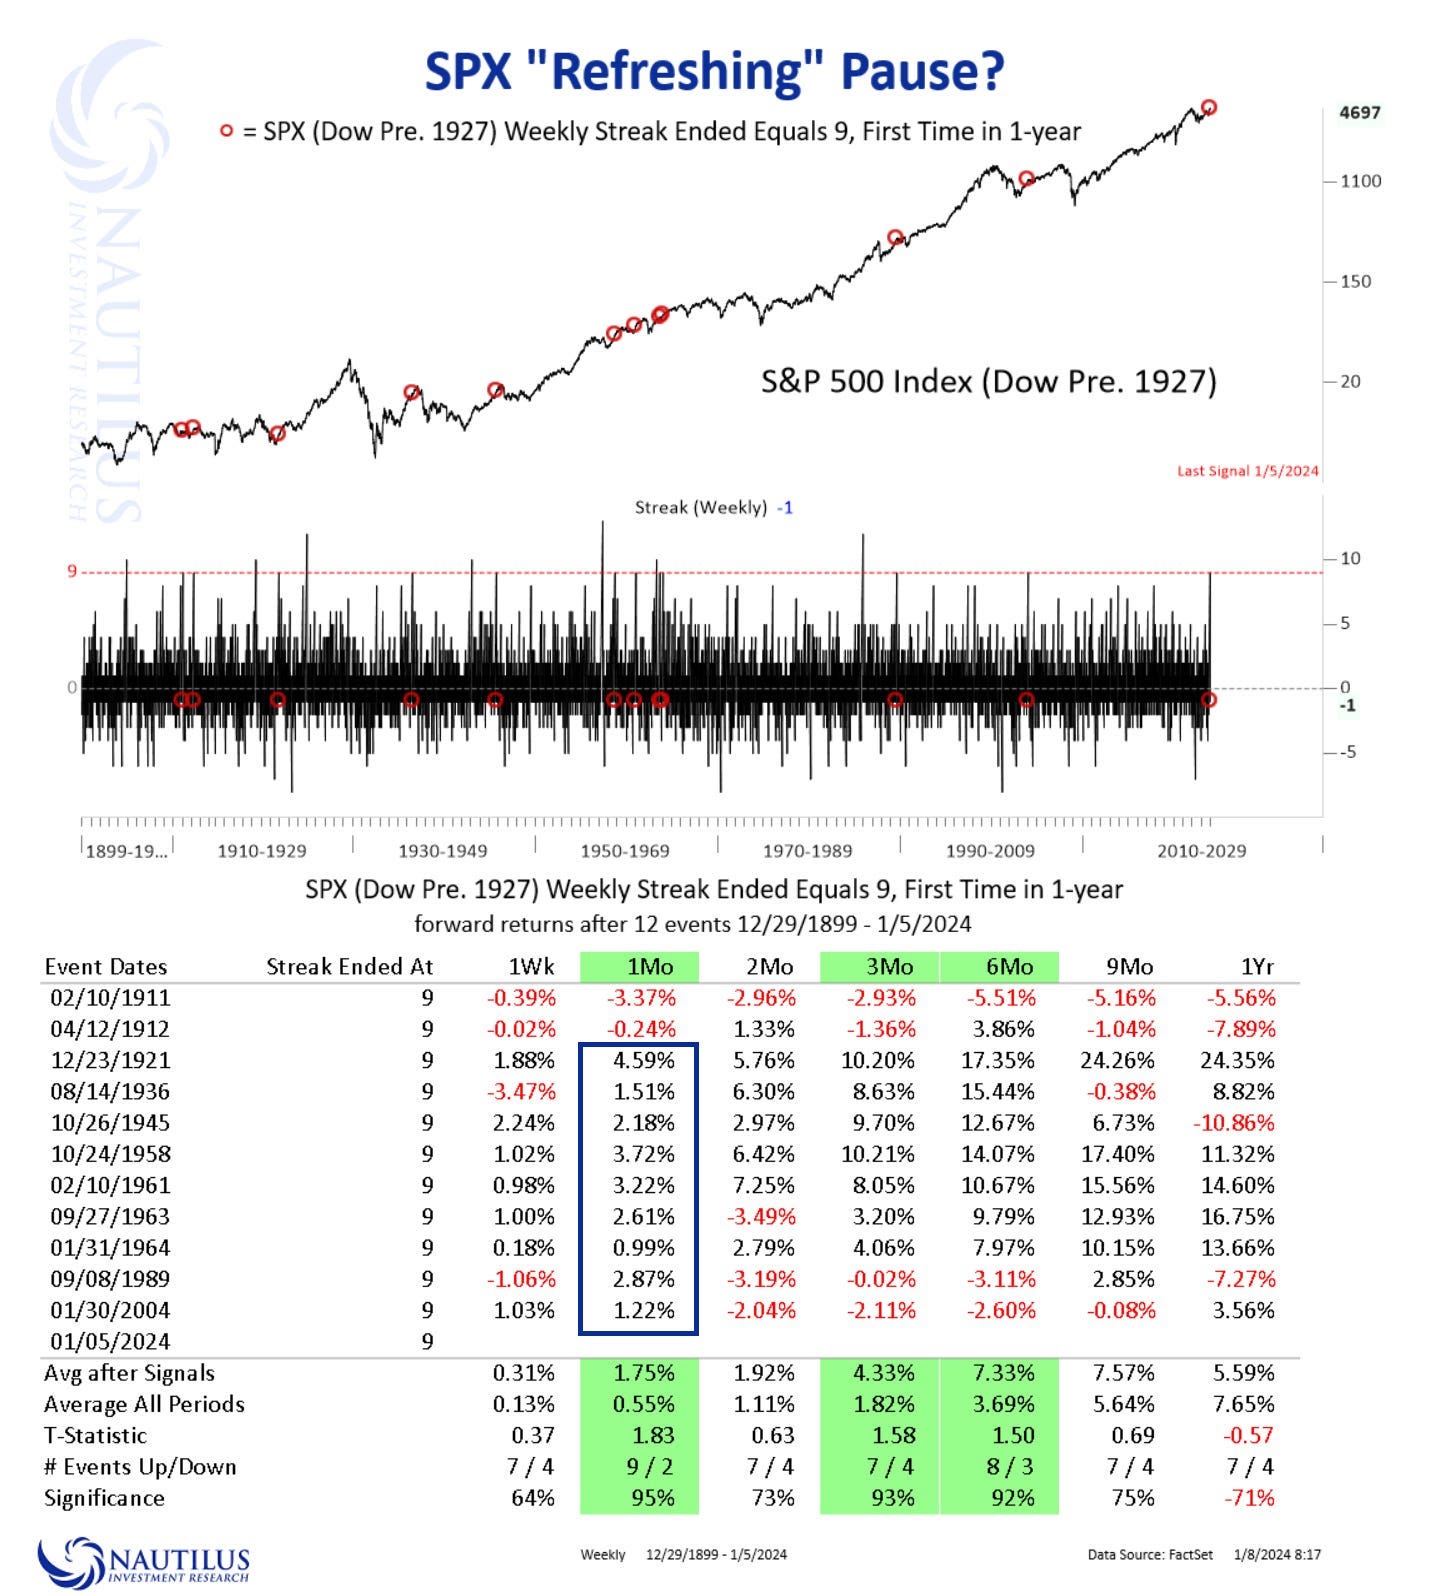
Nautilus: SPX 'Refreshing' Pause in Weekly Streak? (interesting and thought provoking data to consider, as always …)
Last week’s -1.52% decline ended a streak of 9 consecutive higher weekly closes for the S&P 500. Equity market advances experience, or actually require, 'refreshing pauses,' which can often denote short consolidation or correction phases within an uptrend. These pauses can serve as necessary cooling-off periods for overextended markets, and create openings for new buyers to participate. In doing so, they revitalize the upward trajectory by mitigating excessive shorter-term enthusiasm and reinforcing the sustainability of the trend.
An examination of the S&P 500's historical weekly streaks ending at 9 reinforces the idea of markets following impulsive and corrective waves. Going back to 1900 (utilizing data before the Dow's inclusion in 1927), the data and table below illustrate that following a pause in streaks of 9, the SPX tends to be higher one month later in 9 out of 11 instances, with an average gain of 1.75%. The statistically significant return pattern extends up to the 6-month interval, but becomes less informative past 9-months.
Nuveen: Prepare for a plateau, not a plummet, in rates
The rate rollercoaster hasn’t stopped — yet…
… A new year’s resolution: temper high hopes for lower rates. Uncertainty is often cited as the number one enemy of financial markets because it leads to greater volatility. If that’s true, then the broad rally in both equity and fixed income markets in the closing months of 2023 can be explained simply by investors’ increased confidence that peak rates are behind us — a conclusion based on dovish interpretations of the Fed’s November and December meetings. But minutes from the December meeting reinforced the central bank’s commitment to remaining data dependent. That leaves the door open for keeping rates at their current plateau, or even to more tightening, should inflation data call for it.
Against this backdrop, we believe markets may be too optimistic in their interest rate expectations. The economy has shown ongoing resilience in the face of higher rates. With inflation still above the Fed’s stated 2% target, we’re not convinced that a significant unwinding of tight policy is imminent. Rather, we think the Fed is more likely to stand pat in the near-to-medium term to avoid the kind of reacceleration of inflation that occurred in the 1970s, when policy rates were cut prematurely. This stance suggests that real rates — i.e., nominal interest rates less the inflation rate — will remain steady, similar to the hypothetical path reflecting 75 basis points (bps) worth of cuts shown in Figure 1. Investors eager to position their portfolios for a wave of rate cuts in 2024 would be well served to instead seek investments that stand to benefit from a steady, albeit still elevated, rate environment.
WisdomTree Prof. Siegel: Economy Moving at a “Goldilocks” Pace (what could possibly go wrong …)
… I will reiterate my take from year end. Everyone is focused on how many rate cuts are priced into the Fed funds futures market and how we need six cuts to have a good 2024. I totally disagree with that.
The key point from the December Federal Open Market Committee (FOMC) meeting was Powell being more flexible and willing to cut rates if we have weakness. If real economic growth stays strong, the Fed could keep rates exactly where they are, and we could have strong equity markets.
What was important: Powell recognized the two-sided risks and is not necessarily going to stick to a false narrative that we have 1970’s style inflation. Powell’s flexibility means we should avoid the worst case of an overly stubborn Fed, and this lowers the probability of a recession and raises chances of continued growth or a softer landing.
If there is a flare up of inflation, that could become more negative. But I think the prospect of that is low…
… My long-term outlook on the bond market (beyond 2024) would be for the Fed funds rate to settle around 3% - 3.5% and to have 50-75 basis points in positive term premium (unlike the strong over 130 basis point curve inversion we have today). This would get a 10-year yield closer to 4%. That happens to be where the 10-year Treasury is trading today, so the upside on adding to bond duration here seems small given the yield sacrifice that has to be made.
ZeroHEDGE: Inflation Expectations Tumble To Lowest Since Jan 2021, As Do Wage And Spending Growth, In Latest NY Fed Survey (links TO the survey as well as ALL the snark and more than you’d ever hope for…)
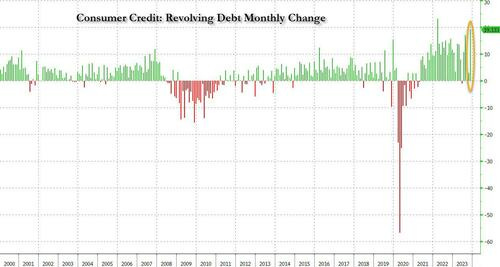
ZeroHEDGE: Consumer Credit Shocker: November Debt Soars After Second Biggest Surge In Credit Card Debt On Record (XMAS was financed — does that mean it can also be reposessed?)
… ... what was the big shock in today's data was the blowout surge in revolving credit, which in November exploded by a whopping $19.133BN, a record surge from the $2.9BN in October, and the second biggest monthly increase in credit card debt on record!
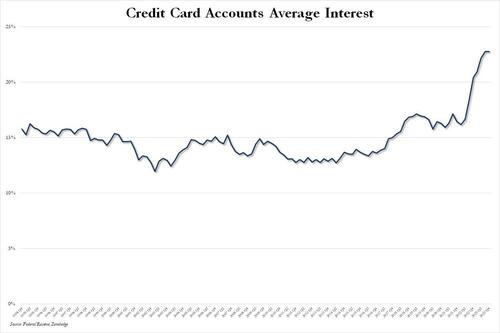
This, despite the average interest rate on credit card accounts in Q4 flat at a record high 22.75% for the second quarter in a row.
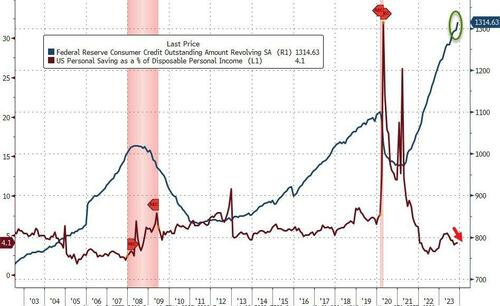
What is especially surprising about this conirmation that the bulk of holiday spending was on credit is that it takes place after several months of relative return to normaly, when consumers appeared increasingly reluctant to max out their credit cards due to record high rates, and at a time when the personal savings rate in the US has collapsed back near multi-decade lows in recent months.
Well, it now appears that Americans have once again done what they do so well: follow in the footsteps of their government and throw all caution to the wind, charging everything they can (and whatever they can't put on installment plans which also hit a record late last year) including groceries, on their credit card, and praying for the best... or not even bothering to worry about what comes next.
… AND waiting for Thursday’s CPI on heels of NFP (and ahead of long bond auction) like …
… THAT is all for now. Off to the day job…









Sometimes you have to procure the property before the furniture LOL! I speak from experience, I started w/lawn chairs, coffee table, and 19" tv & stereo in my 1st real apartment (studio & hotel rooms w/o oven & bathroom don't count right?!) at the ripe age of 20! I had a girlfriend and Nintendo SNES back then, more than I can say now. I can't currently afford Hoeflation (h/t to ZH!) LOL HAHA
Wild BondKing Bill sure nailed those 10 yr trades right! Seems the 4% & 5% handles are BIG....does that mean 4.5% 10 yr is Just Right? And who in their right mind would buy 4% yielding 10 yr when you get well over 5% going out 6 months or less? Besides those highly leveraged big Bond Traders? Thus the cries for rate & QT cuts?! Maybe CA Teachers Pension? (you see that story, they're borrowing $30B for ongoing payouts instead of getting Bent Over selling Fire Sale Assets? Oops I have a CalPers pension I better stop PROJECTING! Can you say PONZI? Hey rhymes w/Fonzi I did love Happy Days!)