while WE slept: USTs 'incrementally firmer' ahead of JPOW & JOLTS; USTs pricing Trump2.0 (DB, Yardeni, BBG, ING ...)? Maybe it's just 'UPflation' (BBG)
Good morning … Still making way through monthly charts in search of something which helps make sense of the sometimes seemingly senseless market machinations.
10yy HERE were definitively more BULLISH while the longer end of the curve — long bonds — a bit more MIXED (ie, ‘see what you wanna see’).
This brings me to this mornings updated monthly chart of 5s … (WHICH IS NOW ACTUALLY UPDATED … PREVIOUS VERSION HAD 10YY, MY APOLOGIES)
5yy: momentum more BULLISH, UPtrend (channel) broken and new (H2) trend emerging … but currently ABOVE said bullish TLINE
… clearly NOT one for longer term Team Rate CUT’ers
… Now, for those of us like myself, attempting to play along at home before deciding to join one ‘team’ or another and doing so, well AFTER the ‘facts’, and a funTERtaining, holiday interrupted week ahead got off to an interesting start …
CalculatedRISK: ISM® Manufacturing index Decreased to 48.5% in June
ZH: As 'Hard' DataCollapses, Manufacturing Surveys' Mixed Reality Emerges
… Wait, what? So bad data (bad = good at least for Team Rate CUT and should have been BULLISH for bonds but…) and by ‘interesting’, I mean a BEARISH one, at least as far as RATES were concerned (?) and by days end …
I believe some out there would like me to believe TRUMP for the win would possibly be more inflationary (and supportive of steepener) than Biden?
I’m no pundit and certainly not a political expert — never was — but check me if I’m wrong here … aren’t both on sked to spend like $6tril? A complete RED WAVE is to be more bearish steepener than a BLUE one?
Seems to me thats more of a SPIN DOCTORS (good band less so when it comes to politicals) truism than anything else…
Saying one has a bigger bearish steepening multiplier than another is, well, ludicrous TO ME, unless, of course you were to incorporate into the thesis that last / this weeks move in rates done during a period of time with lots of data and fewer headcount here to manage / TRADE the risks … In any case, that is what some of the popular kids are saying (DB, Yardeni, BBG & ING below) …
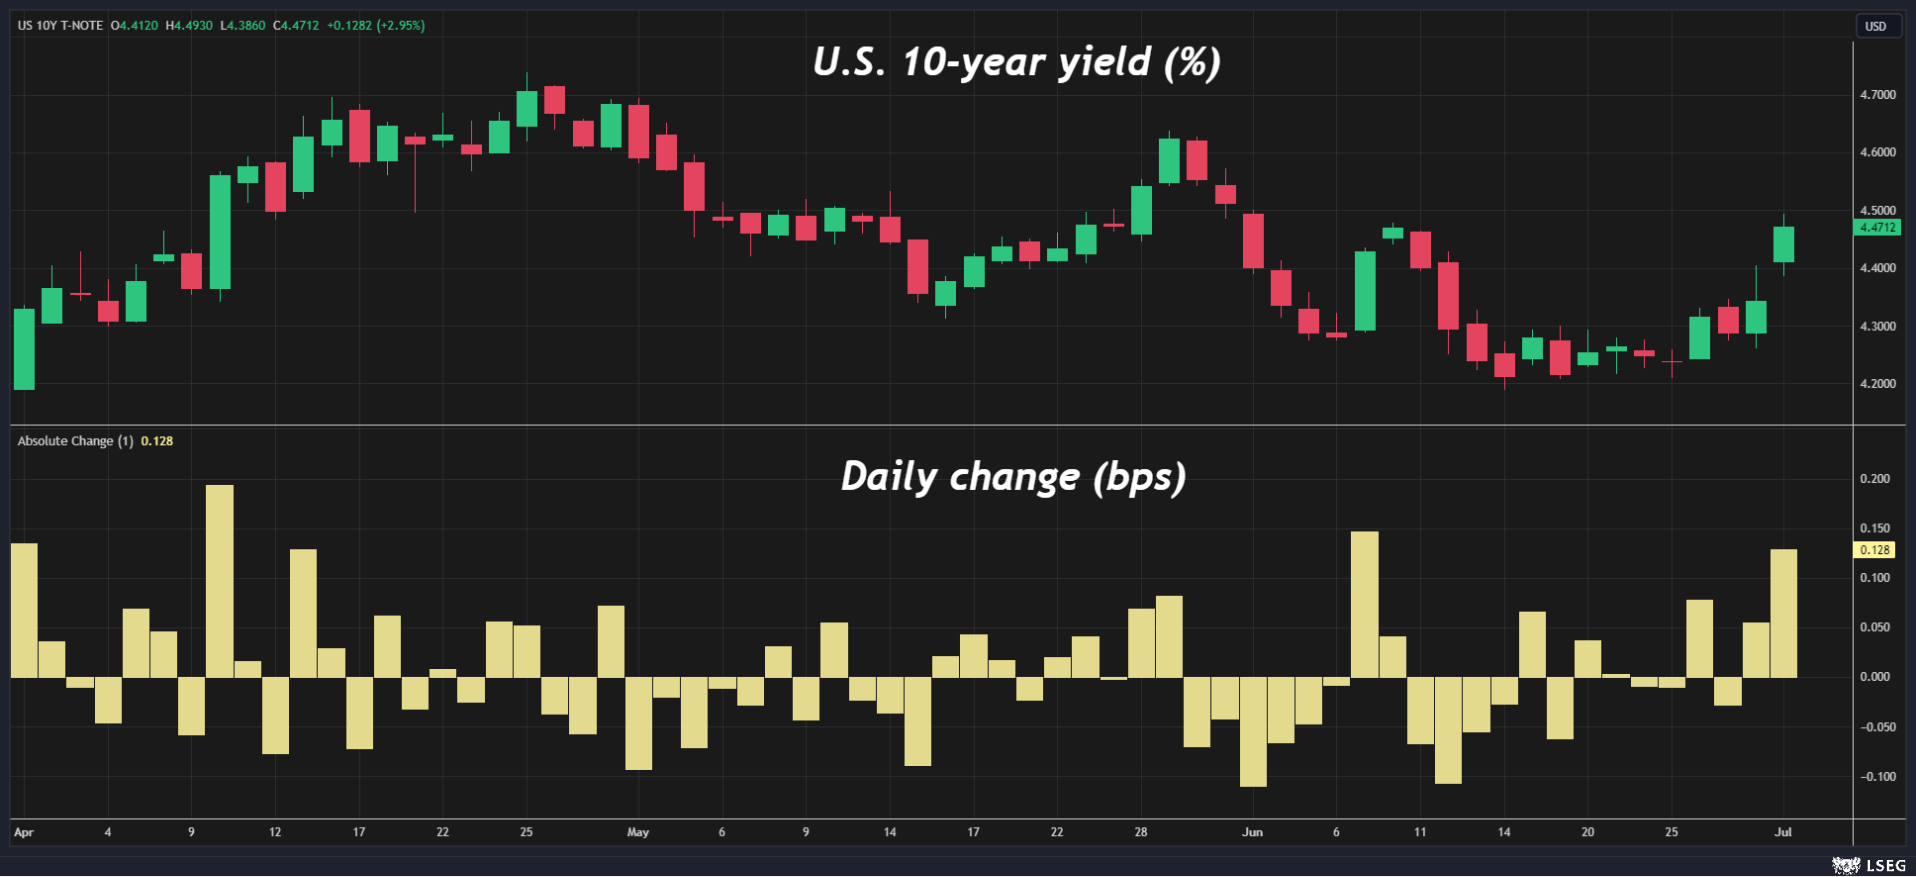
This left yields UP at nearly 4.50% (up about 20bps from Fri lows) and the biggest jump in a month…
… The 10-year U.S. yield jumped 13 basis points to 4.50% on Monday - the highest yield and biggest one-day rise in a month - as investors repriced the potential inflationary impact from mooted fiscal, tariff, and immigration policies under a Donald Trump presidency…
… Got it. RIGHT. A BIG move, indeed.
Saying to ME that I should ascribe bearish steepening TO … some sorta TRUMP inspired ‘INFLATION BOMB!’ … hold on, there, big fella …
I’ll stop … and move right along … here is a snapshot OF USTs as of 700a:
… and for some MORE of the news you might be able to use…
NEWSQUAWK: US Market Open: Equities pressured, DXY & USTs firmer into Chair Powell … USTs incrementally firmer into Chair Powell & JOLTS, no reaction to earlier remarks from Fed's Goolsbee; support comes in at 109-00 and then 108-17+ below while any further upside brings into play Monday's 109-24 peak and thereafter 109-27+.
Finviz (for everything else I might have overlooked …)
Moving from some of the news to some of THE VIEWS you might be able to use… here’s SOME of what Global Wall St is sayin’ …
BARCAP: ISM manufacturing: Moderating input prices support September cut prospects
The ISM manufacturing composite was little changed in June, reflecting mixed readings across major components. The index remains at the upper end of the range since late 2022, keeping manufacturing on a sideways course. Signs of moderation in the prices paid component support our September rate cut call for the Fed.
BARCAP: May construction spending declines on private residential spending weakness
Construction spending fell 0.1% m/m in May, driven by a decline in private construction spending. Today's data did not change our GDP tracker; it pulled our residential spending tracker down, but this was offset by an increase in government investment spending.
SPX/SPW returns are historically back-end loaded; 2023 was the opposite thanks to a narrow, front-end heavy rally. With the first half of 2024 looking a lot like last year, we wonder if SPX/SPW returns can keep up the pace, particularly with EPS growth for Big Tech and the rest of the SPX expected to converge by year-end.
Markets got Q3 off to a mixed start yesterday, with a pretty divergent performance across countries and asset classes. On the positive side, there was a noticeable recovery for French assets after the election results, with the Franco-German 10yr spread (-5.8bps) seeing its biggest decline since President Macron announced the election last month. However, that came alongside more weakness in US markets after investors became increasingly focused on the fiscal outlook, with the presidential election now just four months away. That saw the 10yr Treasury yield rise a further +6.5bps to 4.461%, building on its +11.0bps move on Friday and closing +20.3bp higher than the lows that came after Friday's soft core PCE. So had you got that data print right in advance you may have got bond markets totally wrong. I thought some of it was month-end shenanigans from Friday but a narrative has built up that due to the aftermath of the Trump/Biden debate, markets should be pricing in a higher probability of a Trump victory and larger fiscal deficits …
As discussed earlier, US Treasuries continued their significant last 36 hour decline from Friday as investors moved to focus on the upcoming election and the fiscal implications. That led to another fairly sharp curve steepening yesterday, with the 2s10s curve up +6.1bps to -29.9bps, having been at -49.6bps just one week earlier. For what it’s worth, this week is actually the second anniversary of the 2s10s inversion in July 2022, so we’re on track for yet more records in terms of this being the longest ever 2s10s inversion. And in terms of the specific moves, the 2yr yield was largely unchanged (+0.2bps) at 4.755%, but the 10yr yield saw a larger +6.5bps move to 4.461%. With the attention on the long end, fed futures were barely changed as the amount of cuts priced in by the December meeting was up just +1.0bps to 45bps. This morning in Asia, yields on the 10yr USTs have edged back down -2bps to around 4.44% as I type …
DB: Mapping Markets: Four H2 risks coming into focus (highlighting couple ‘existing risks’ which don’t seem to ME to favor Team Rate CUT but then again, if I were right and so smart, I’d be writing these reports not commenting on them…)
2024 so far has been a strong period for the global economy. Consensus growth forecasts have been upgraded, whilst risk assets have done very well, with many equity indices reaching record highs.
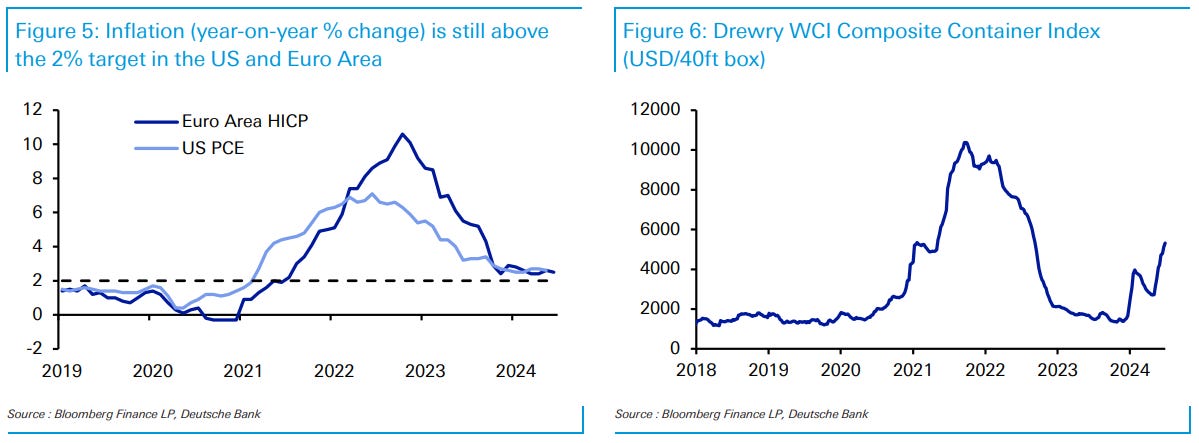
But as we begin H2, several risks are now coming into focus. For example, more data has been surprising on the downside over recent weeks. In addition, investors are becoming more nervous about fiscal policy given higher levels of debt and interest rates. And that comes on top of existing risks, such as inflation lingering above target, and monetary policy lags that are still working through.
With all these risks above, a big concern is that there’s a non-linear tipping point. So even though the global economy remains in a broadly good place, it's worth keeping an eye on them, as recent years have repeatedly shown that surprises can be just around the corner.
… The collapse in inflation in the US, the UK, and Europe has been miraculous, but cost of living remains a politically toxic subject. Consumers focus on price levels (especially for high frequency purchases) and the ending of margin expansion may slow inflation without lowering prices to levels consumers believe to be “fair” …
… The US job openings data (JOLTS) are due. The survey response rate for this data is so low it makes non-farm payrolls data look precise. The numbers have reflected declining labor market churn. Federal Reserve Chair Powell, ECB President Lagarde, and Banco Central do Brasil President Campos Neto are on a panel together. At least, Campos Neto is a qualified economist …
Wells Fargo: June ISM: Activity Still Soft, but Prices Cooling (so, Fed is #Winning?)
Summary Manufacturing activity remained in contraction territory in June, but in a sign of moderating inflation pressure, the prices paid component fell 4.9 points. New orders rose more than any other component but remains in contraction.
Wells Fargo: Construction Spending Weakened in May Tight Monetary Policy Weighing on both Residential and Nonresidential Activity
Summary Construction Spending Set to Downshift Total construction spending fell 0.1% during May. Both residential and nonresidential outlays dropped during the month. Although the construction market as a whole has navigated the higher interest rate environment relatively well thus far, the restrictive effects of tight monetary policy are becoming increasingly apparent across the industry. Separately reported, the forward-looking Architecture Billings Index (ABI) declined to the lowest reading since 2020 during May, which suggests further weakening in terms of construction spending is in the pipeline.
Wells Fargo: Break in Concentration? The Jobs Outlook for Three Key Industries Driving Payroll Gains
Summary Overall job growth has remained robust over the past year. Nonfarm payrolls (NFP) have expanded by an average of 230K per month, bucking expectations for a sharp slowdown in the wake of the FOMC's rapid tightening in monetary policy. An outsized share of these gains have been concentrated in a few industries that have lagged the broader recovery and/or been more insulated from the Fed's efforts to tamp down demand. Specifically, the healthcare, government and leisure & hospitality sectors have accounted for 66% of job growth since last June even though they comprise just 36% of employment. These sectors' ability to plow ahead with hiring has offered an important source of support to income growth and consumer spending growth. How much more runway remains for these industries to buoy payroll gains?
Healthcare: Healthcare payrolls have expanded by an average of 65K jobs per month over the past year, roughly three times the pace registered from 2017-2019. Solid demand growth resulting from higher rates of insurance coverage and rapid population aging is likely to keep headcount rising at a brisk clip. However, the industry's level of employment has returned to its pre-COVID trend, leaving less scope for "catch up" hiring to bolster its monthly run-rate ahead.
Government: After an initially slow start in recovering jobs this cycle, the public sector has added an average of 51K jobs per month over the past year, far exceeding the 12K monthly average in the three years prior to COVID. The recent breakneck pace has come not only from the need to restaff but the means to do so. Yet while the finances of state & local government— which account for about 90% of public sector payrolls—are still strong overall, they have started to erode. With employment in the sector already back to its pre-COVID trend, some moderation in the monthly pace of hiring appears in store.
Leisure & Hospitality: Having added an average of 35K jobs per month since last June, the leisure & hospitality sector has accounted for 15% of payroll gains. With employment in the industry still nearly one million workers below its 2017-2019 trend, we see room for this category to remain an outsized contributor to job growth in the months ahead. But slowing demand, the industry's dizzying jump in labor costs in recent years and room to extend existing workers' hours lead us to doubt that the trend in hiring can shift beyond its recent pace.
On net, we expect these three categories to continue to provide a sizable lift to the monthly rate of payroll gains that surpasses their pre-pandemic contribution and helps keep payroll gains afloat despite the current weight of monetary policy. That said, the gap between each of these industries' recent run-rate and their pre-COVID pace is likely to narrow ahead amid less scope for catch-up hiring, a less robust financial position and/or slowing demand. As such, they are likely to provide a smaller lift to the overall pace of job gains, raising the likelihood that payrolls growth slows more meaningfully ahead. We look for NFP gains to downshift to about a 150K monthly pace over the next 12 months amid a smaller contribution from recent industry standouts and diminishing appetite for employers to hire more broadly.
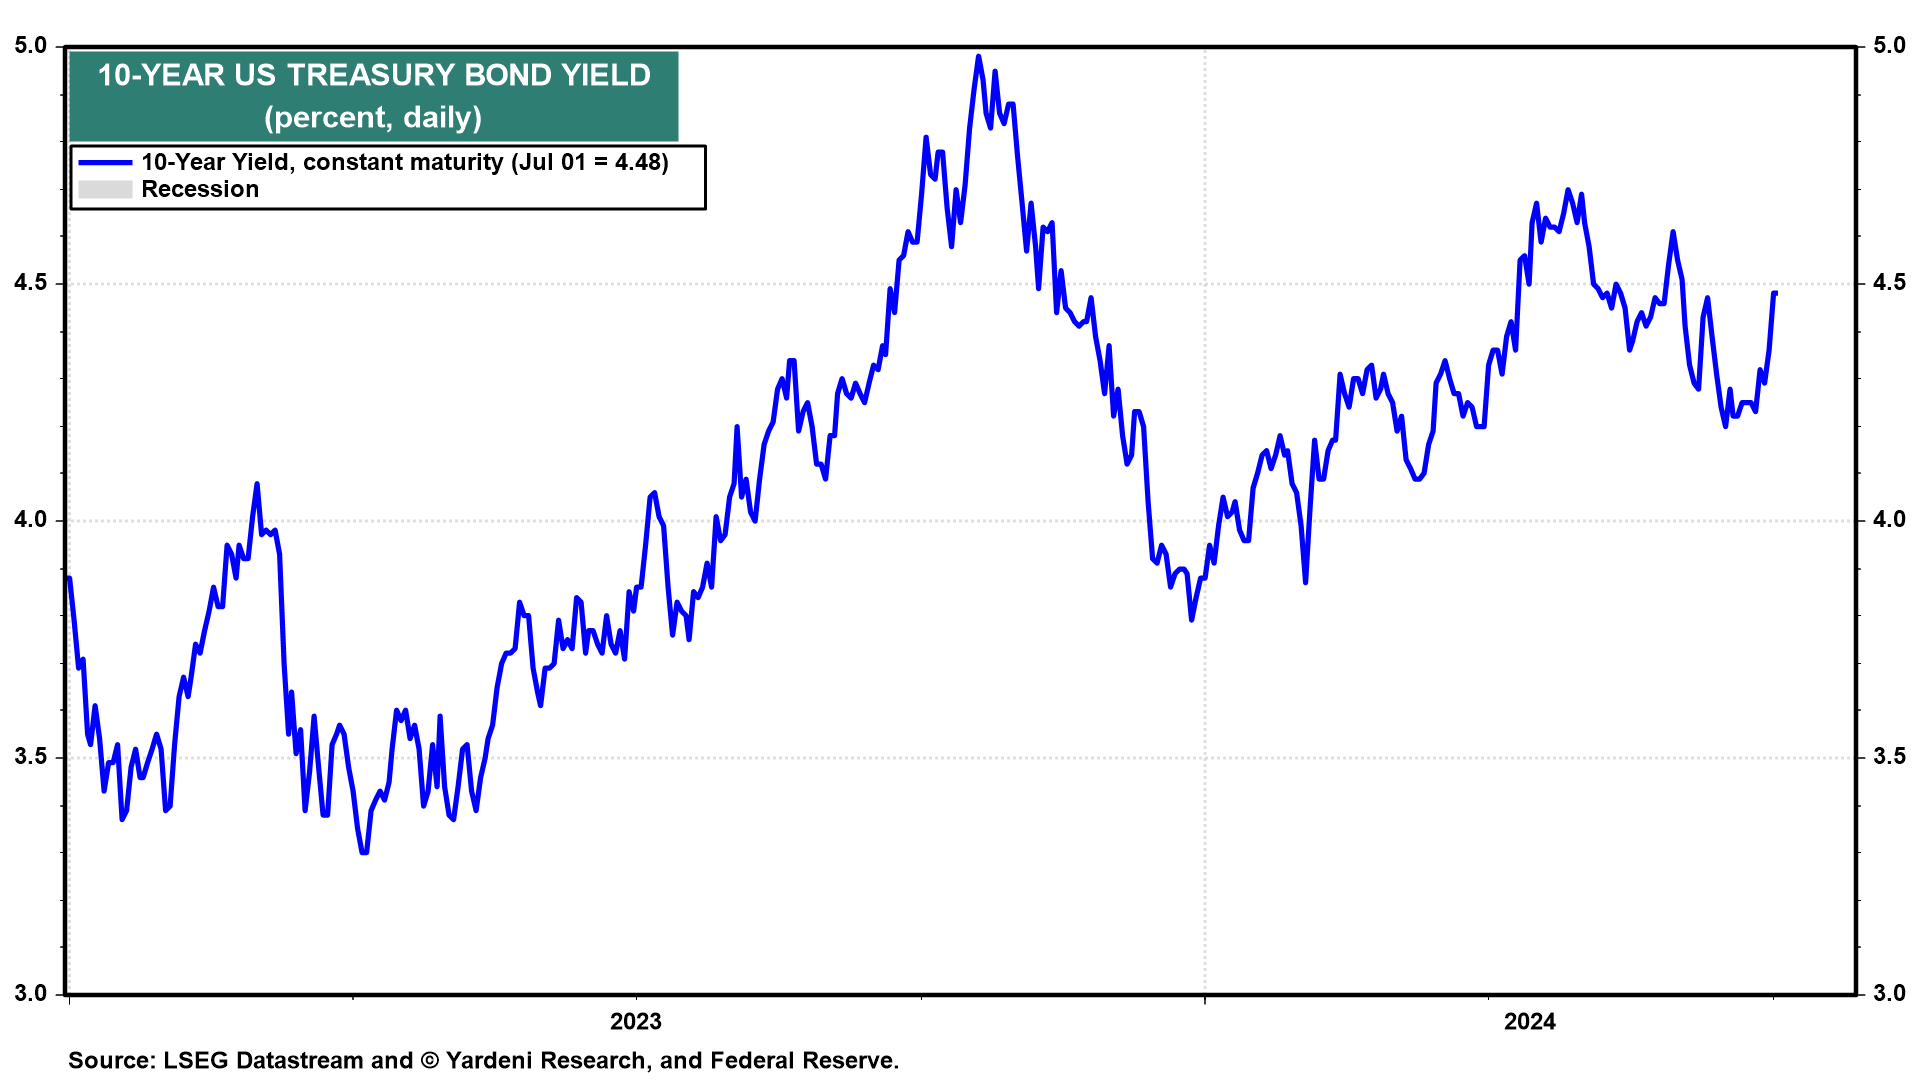
Long-term US government bond prices fell sharply since the presidential debate on Thursday evening. The 10-year Treasury yield rose from 4.29% on Thursday afternoon to 4.48% today, the highest level since May 31 (chart). That was in spite of the lowest y/y print for the personal consumption expenditures deflator (PCED) since March 2021 on Friday and another sub 50.0 report for the M-PMI on Monday. We think the bond market is reacting to the increased probability of a second term in the White House for President Donald Trump.
According to betting marketplace PredictIt, Present Trump's odds of winning the November presidential election have climbed to 57% from 52% a week ago, while President Biden's have fallen to 31% from 48%. The remainder of bids have mostly gone to alternative candidates who could replace Biden as the Democratic nominee. The Treasury market has apparently taken notice. Here's our perspective on the bond selloff:
(1) Bear steepening. The 2-year yield is only up 5bps in the last two trading days. Rising yields, led by the long-end of the yield curve, mean investors' long-term economic expectations are shifting while their outlook for Federal Reserve interest rate policy hasn't changed much (chart).
(2) Real rates. The 10-year TIPS yield is up around 14bps to 2.15% since Thursday (chart). Extrapolating the move in nominal and real yields, we think markets see a potential mix of stronger economic growth, higher inflation, and more Treasury supply in the event Trump wins.
… 8% in 3 Years As we get set for the second half, there's a cohort of investors calling this market "overheated." While that might be true for NVIDIA (NVDA) and other AI names that have pushed price-to-sales ratios up into the stratosphere, keep in mind that the S&P 500 Equalweight index is up just 8.8% on a rolling three-year basis. That's 25 percentage points below the Equalweight's average gain of 33.8% seen across all rolling three-year periods since 1990. Would you call that overheated?
Bloomberg: Treasury Yields Resume Climb as Morgan Stanley Flags Trump Risk
Wall Street sees higher inflation, yields in second Trump term
US 30-year yield rises to highest level in nearly a month
US Treasuries fell on Monday, pushing yields to the highest levels in more than a week, in what traders said was ongoing fallout from last week’s bump in the odds of a second term for Donald Trump.
Across Wall Street, interest-rate strategists are urging clients to start positioning for sticky inflation and higher long-term bond yields as the potential rises for another Trump presidency. Morgan Stanley and Barclays are among the firms bracing for such a outcome.
“I think the markets will be digesting a Trump win,” along with increased volatility in rates “around a bias to higher yields,” said Stefan D’Annibale, head of rates trading and sales at Odeon Capital Group.
The uptick in Treasury yields was led by the longest maturities, with 30-year bonds up more than five basis points to 4.615%, the highest level since June 3.
“We have been in the camp that we should be thinking about a bear steepening for some time, based on exogenous events that might not seem related, but will come together,” Marvin Loh, senior global macro strategist at State Street, told Bloomberg Television on Monday. “There is a sense that politics — and really this populist evolution around the world — is going to affect the amount of debt that we all need to absorb.”
Bloomberg: ‘Upflation’ Is the Latest Retail Trend Driving Up Prices for US Consumers (blame Trump2.0 if you want BUT … seems to me it COULD possibly have absolutely NOTHING to do with him … or at least difference of HIS spending relative TO Bidenomics …?)
First there was ‘shrinkflation.’ Now, consumers are confronting ‘upflation’ as companies seek to turn around the $100 billion personal care and beauty market.
Bloomberg: 5 Things You Need to Know to Start Your Day: Asia
… The latest Atlanta Fed GDP estimate for the US economy is pointing to a second consecutive quarter of growth trending below potential. If sustained, this will serve as a reality check for US stocks, whose performance has beaten most major assets worldwide in the first half.
Atlanta’s GDPNow projection for growth has slipped to about 1.7% from over 3% just two weeks ago. Granted, there’s still major data to come for June, including payrolls on Friday and CPI next week. Yet, if growth remains underwhelming and below the Fed’s 1.8% long-term target, the threat is that earnings estimates could soon start looking too rosy.
The S&P 500 is seen posting EPS growth of about 9% in the second quarter, before accelerating into double-digits later in the year, according to data compiled by Bloomberg Intelligence. Outside tech, earnings are finally supposed to overcome a profit downturn that has plagued much of corporate America for the past year. Softer growth would challenge those projections and once the narrative changes, risks such as pricey valuations will suddenly start mattering more.
ING: Rates Spark: Politics everywhere all at once (hmmm ok, but …?)
The first-round results from the French elections have reduced some of the tail risks in bond markets. Eurozone CPI data today are likely to come in softer, but the expected core reading remains elevated at 2.8% year-on-year. US markets are assigning a larger probability to a Trump win, helping push up 10Y UST yields by almost 20bp over the past days
…Also in the US politics are driving the curve Global bond markets are watching US rates for signs of direction, but whereas a lot of the price action was previously found on the short end of the curve, now the back end is playing a larger role. The latest inflation numbers in the US were supportive of a Fed cut and until data proves elsewise markets are fixed on pricing in between 15-20bp of cuts for September, keeping the short end anchored.
In contrast, the 10Y UST yield rose sharply the past few days, jumping from below 4.3% to almost 4.5%, thereby steepening the curve. Most of the move can be tracked to the upcoming US elections, whereby markets are assigning an increasing probability of a Trump win. First we had the weak performance of Biden in last week’s debate and just yesterday the Supreme Court ruled that Trump may have had immunity for actions within his Presidential authority during the previous elections. Although the ruling may not eventually impact the outcome, this does likely delay the case against Trump further reducing the chance of a courtroom session before election day. As the election day comes closer we can expect to see more politically-driven rates volatility
Liberty Street Economics: Exploring the TIPS‑Treasury Valuation Puzzle (interesting election year ‘research’ piece …)
…In practice, the ILS has almost always been higher than the BEI, as shown in the chart below. The resulting inflation basis has averaged approximately 30 basis points since 2004, an anomaly that has been called the TIPS-Treasury bond valuation puzzle.
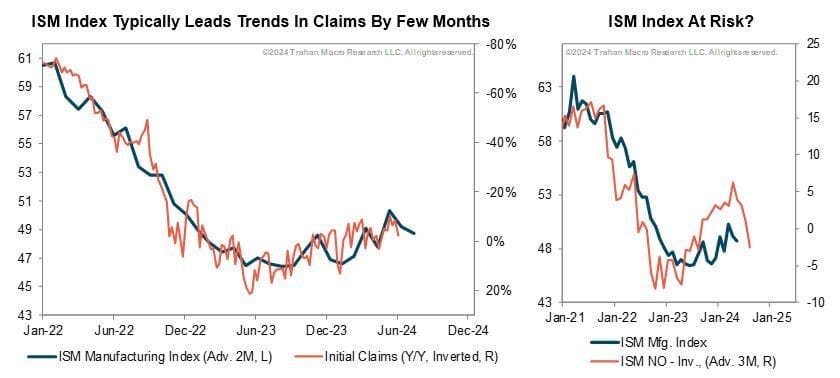
This week is chock full of key data releases despite the July 4th holiday. We will get the ISM Index for June this morning at 10am and it is a tad more important than usual this month considering the collapse in the New Orders component in April and May. As the clip chart on the right above reveals, the spread between the New Orders and the Inventories component gives a heads up on where the overall Index might be headed. It suggests weakness ahead.
The ISM is one of the earliest leading indicators in the U.S. since it gives us a read on the early part of the supply chain. It often helps inform on trends in other LEIs like Initial Jobless Claims. Claims will be released this Wednesday. In similar fashion, the payroll report for June will be released on Friday morning. Lots to ponder this week despite the holiday. Happy July 4th everyone.