Good morning … and happy Monday (said nobody ever).
Global markets appear to be fairly quiet and best I reckon, front end of the yield curve a touch better bid (2s -3bps) while the back end about UNCH (10s) to UP a couple (30s +2bps).
With most of the Eurozone closed for Easter Monday and only a bit of data from China over the weekend …
Bloomberg: China’s Industrial Upswing Is Latest Sign of Economic Recovery
Better than expected economic data points to signs of momentum
Property market and deflationary pressure remain challenging
… I’d not put too terribly much faith in the current price action and would rather consider the start of the day / week / month and new quarter as the calm before the storm. Quite literally. Not only data but Fedspeak and rain moving in with some clarity (hopefully) arriving Friday for the NYY home opener! …
This relative calm before the storm comes on the heels of Friday’s PCE which was mentioned over the past couple / few days and in the case you missed these links-A-palooza;’s,
weekly observations (4/01/24): PCE boosts GDP and most of Global Wall not yet to weigh in, stay tuned; Bond (bullish) seasonals
Powell Reiterates Fed Doesn’t Need to Be In Hurry to Cut Rates -BBG ... and another thing(s)
… AND with that little in mind, a look at front end …
2yy: TLINE TESTED …
… and it appears to ME that 2s are beginning the month of April ‘bout where they began the month of March, a month where we saw extremes of 4.40 up TO 4.75% or so.
As you make as much / little of that as you wish, I’m going to move right along TO a snapshot OF USTs as of 705a:
… HERE is what this shop says be behind the price action overnight…
… WHILE YOU SLEPT Treasuries are mixed with the curve twisting steeper around an UNCHD 10-yr benchmark amid market closures in Europe and the UK. DXY is modestly higher (+0.10%) while front WTI futures are a touch lower (-0.35%, see attachment). Asian stocks saw solid gains in China's markets while Japanese stocks fell on their first day of the new year, EU and UK share markets are little changed while ES futures are showing +0.4% here at 6:40am. Our overnight US rates flows were unavailable due to market closures while overnight Treasury volume was predictably weak at ~35% of average overall.
… The Bloomberg Commodity Index (BCOM) still looks aimed higher over the weeks ahead. The weekly chart of BCOM shows this (see weekly momentum, lower panel) but our next attachment shows front WTI futures (CL1) climbing closer to bull channel resistance that we'd spot near $84.00/bl. Gold is also quite interesting here after its major breakout higher at the start of last month.
… and for some MORE of the news you might be able to use…
BARCAP China: Beyond seasonal rise in PMI suggests upside risks to Q1 GDP
The fast recovery the NBS manufacturing, services and construction PMIs, and stronger-than-expected Jan-Feb IP and exports, suggest upside risks to our below-consensus Q1 GDP forecast, especially given China's production-based GDP reporting. However, we are cautious about the sustainability of the rebound.
BARCAP U.S. Equity Strategy: Food for Thought: Small Wonder
Small caps have outperformed since mid-March, but their earnings revisions continue to lag those of their large cap counterparts. We think the small cap upturn is tied to rate cut expectations instead of fundamentals, and continue to prefer large-caps. Concentration eased slightly within the large-cap universe.
UBS China Weekly: March PMI Beat but Y/Y Growth Slowed, No QE in China
Yardeni DEEP DIVE: The Fed Put Is Back (oh man … wrong or right, tough to read and then come to grips with …)
Monetary Policy I: Post-Modern Monetary Theory Melissa and I received quite a few favorable reader comments on last Monday’s Morning Briefing discussing our “Post-Modern Monetary Theory” (P-MMT). Many of the comments included thought-provoking queries about our P-MMT, which I address below. In addition, the Financial Times is running my summary of our theory in an op-ed titled “The Fed should resist messing with success.”
The basic concept of P-MMT is that recessions are caused by a process that leads to such economic downturns. As an economic expansion proceeds, inflationary excesses build up in goods and services markets as well as in asset markets along the way. Typically, as confidence builds in the longevity of the expansion, borrowers borrow more to purchase goods and services as well as assets. As such purchases become more leveraged, they expose both the borrowers and lenders to more risk.
The buildup of such inflationary and speculative excesses forces the Fed to tighten monetary policy. Interest rates rise, but along the way short-term rates rise faster than long-term rates. This leads to an inversion of the yield curve signaling that bond investors anticipate that if the Fed continues to raise short-term interest rates, something will break in the financial system. In the past, they’ve often been correct: A financial crisis triggered by continued monetary tightening did ensue (Fig. 1 below and Fig. 2 below). Such crises often resulted from the collapse of financial institutions that had lent too much to borrowers who no longer could service their debts when monetary conditions became tighter than either the creditors or debtors had anticipated.
Figure 1
Figure 2
In the past, the financial crises quickly turned into economy-wide credit crunches. So even borrowers with good credit ratings were unable to borrow. The Fed would respond by lowering interest rates, which it often did before the recessions occurred, i.e., when the financial crises first hit. The federal funds rate typically peaked at the point when the financial crises started. The yield curve would “disinvert” before the recessions officially started.
… And from Global Wall Street inbox TO the WWW,
Apollo: Your Chocolate Is About to Become Much More Expensive (get yer mini eggs while you can …)
Cocoa prices have tripled over the past six months, driven by extreme weather in West Africa, crop disease, and associated panic buying, see chart below.
Bloomberg: US Payrolls Seen Hitting at Least 200,000 for a Fourth Month (it IS NFP week and so why not …)
Chinese PMIs could signal return to economic expansion
Euro-zone inflation may show only slow progress toward 2%
… Payrolls in the world’s largest economy are seen increasing by at least 200,000 for a fourth straight month, according to a Bloomberg survey of economists. Average hourly earnings are projected to climb 4.1% from the same month last year, the smallest annual advance since mid-2021.
Resilient hiring is keeping demand and the economy moving forward at the same time inflation is slowing, albeit unevenly. It’s also allowing Federal Reserve policymakers to hold off reducing interest rates as they await further declines in price pressures…
Bloomberg: Financial Markets Just Delivered a Powerful Reminder (El-Erian OpED)
The strong rally during the first quarter showed yet again that under the right conditions equities can thrive amid considerable uncertainty.
… The first quarter of 2024 reminded us that US stocks can thrive amidst considerable uncertainty, especially when backed by a transformative sector narrative and a supportive central bank. Investors should cheer this environment while being mindful of the need to extend the rally’s drivers beyond these two influences.
Stocks made new record highs, with the S&P 500 setting an intraday high of 5,264.85and a closing high of 5,254.35 on Thursday. For the week, the S&P increased 0.4%. The index is now up 10.2% year to date and up 46.9% from its October 12, 2022 closing low of 3,577.03.
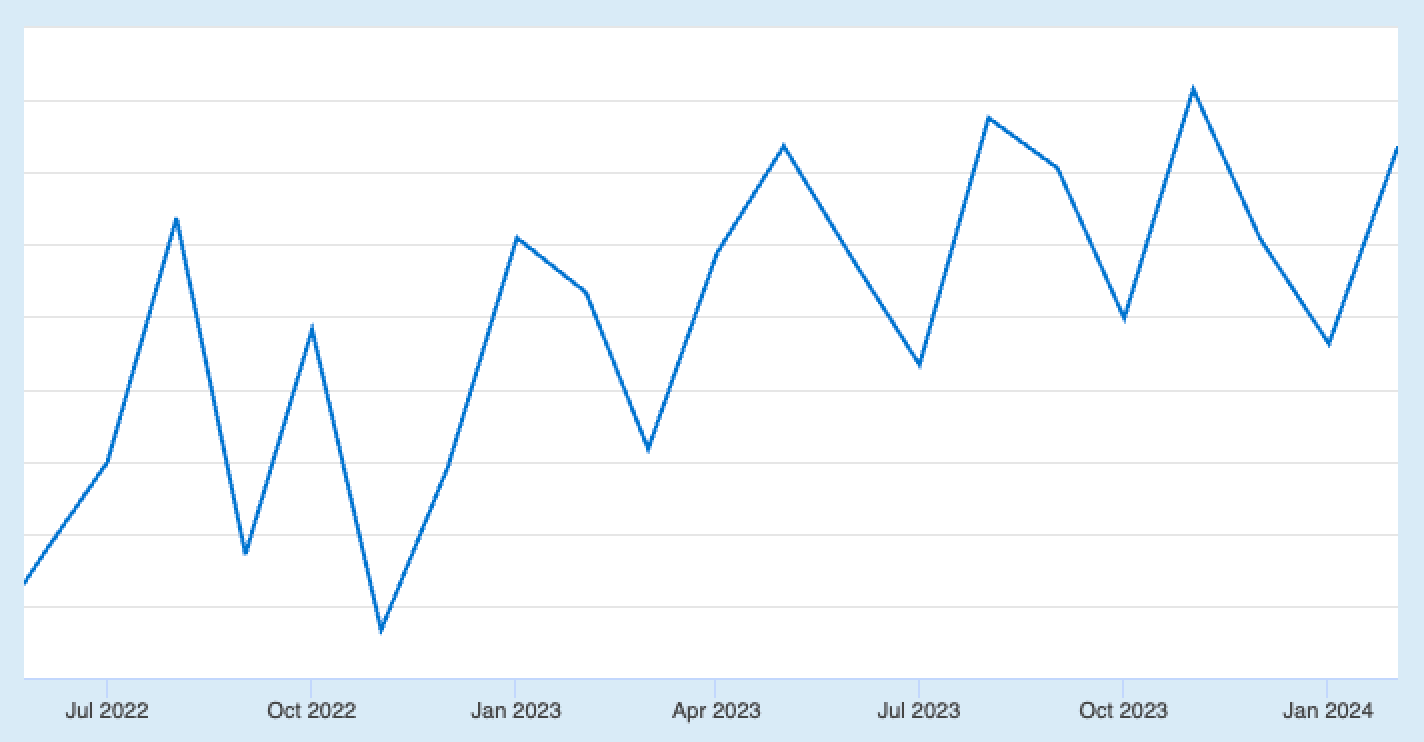
Believe it or not, the chart below is real. It reflects monthly developments in a major economic data set. Can you guess what it is?
… There were a few notable data points and macroeconomic developments from last week to consider:
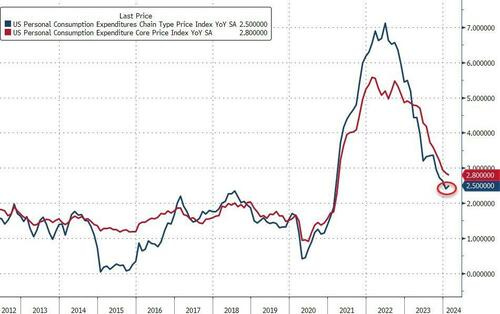
Inflation trends continue to cool. The personal consumption expenditures (PCE) price index in February was up 2.5% from a year ago, up from January’s 2.4% rate. The core PCE price index — the Federal Reserve’s preferred measure of inflation — was up 2.8% during the month, the lowest print since March 2021.
On a month over month basis, the core PCE price index was up 0.3%, down from the prior month’s print of 0.5%. If you annualized the rolling three-month and six-month figures, the core PCE price index was up 2.5% and 2.9%, respectively.
While inflation rates are hovering near the Federal Reserve’s target rate of 2%, the central bank has indicated that it wants prices to stay cool for a little while before it is confident that inflation is under control. So even though there may not be more rate hikes and rate cuts may be around the corner, rates are likely to be kept high for a while…
Generally speaking, rising interest rates are not welcome news for the economy and the stock market. They represent higher financing costs for businesses and consumers. All other things being equal, rising rates represent a hindrance to growth. However, the world is complicated, and this narrative comes with a lot of nuance. One big counterintuitive piece to this narrative is that historically, stocks have actually performed well during periods of rising interest rates.
BTW my 71 yr old mighty-mite Dentist who road trips solo to Disneyland used the term Earl Thursday. She was startled when I noticed, had to tell her my favorite Substacker uses the term, cool moment! She says Wershing rather than Washing too just like my old Grandma once did!
Lance Roberts at RIA often notes that S&P, NVIDIA, BTC, and GOLD, have all been levitating together, rising w/the money flows. Not saying a new trend's been established-yet, but I find it VERY interesting Gold's rising w/Rising rates yesterday. Far as I can tell, Gold's following your EARL now, really bears watching IMHO.