Good morning / afternoon / evening - please choose whichever one which best describes when ever it may be that YOU are stumbling across this holiday long weekend edition …
First up, economic funDUHmentals — Fed’s favored inflation gauge — released while nobody’s around to react …
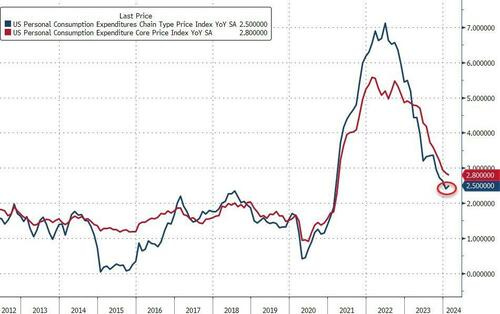
ZH: Disinflationary Path Stalls As Non-Durable Goods Prices Spike But Supercore PCE Slides (yea supercore MoM down — see visual of HEALTHCARE and other… and note income / spending both rose with SPENDING > income … make of this whatever you want, I suppose … and be thankful markets aren’t open today…)
… One of The Fed's favorite inflation indicators - Core PCE Deflator - was flat at +2.8% YoY in February (as expected) - the lowest since March 2021.
However, the headline PCE Deflator stalled its disinflationary path, rising to +2.5% YoY (from +2.4%)...
Inflation remains sticky, with people spending more than they earn. Nothing new
… I’ll set aside how this all feels quite like a communist china sorta plan — release data under the cover of night and HOPE by Sunday evening markets open we’ve gotten something far more exciting to focus on … and note …
… someone somewhere will eventually have something to say about all that data dumped while nobody was lookin (see below for more).
Next UP I’d like to deal with a couple / few things items from Thursday …
Yardeni: Sweet Economic Indicators (was data so good it was bad?)
Today's batch of economic indicators was mostly sweet. Q4's real GDP was revised from 3.2% to 3.4% (chart). The Atlanta Fed GDPNow model is projecting 2.1% for Q1-2024. Consumer spending was revised up from 3.0% to 3.3% despite fears that it would be depressed by the resumption of student loan payments. We disputed that notion by observing that real wages and salaries were growing solidly during the last three months of 2023. We also disputed the running-out-of-excess-savings thesis promoted by the hard landers. Corporate profits rose to a record high at the end of last year.
… The PCED rose 2.0% (q/q, saar) during Q4 for the second quarter in a row (chart). It is still up 3.2% y/y, but we expect to see that rate closer to the Fed's 2.0% target for the core PCED by the end of this year.
ZH: Jobless Claims Continue To Hover (Miraculously) Near Record Lows ZH: FInal Q42023 GDP Revision Comes In Red Hot 3.4%, Beating Estimates ZH: Pending Home Sales Hover Near Record Lows In February ZH: UMich Inflation Expectations Slide To 3 Year Lows, Republicans Lift Sentiment In March ZH: Bidenomics Blowback - Survey-Based Sentiment Collapses As 'Hope' Evaporates
… ALL this while markets were open and could in theory react TO the (so good it’s bad?) data and events. That was NOT the case in the wake of PCE … and despite / because that data and lack of a chance to react, here are a couple / few longer-term (ie monthly, quarterly) charts …
2yy: hopefully picture sends the message — watching front end (tied to Fed) vs 4.80 and 4.40 … momentum here hooking back UP (bearish … ) but that is certainly ripe to change IF Fed can convince markets of the immaculate disinflationary / NO landing story and so, rate CUTS then even EASINGS are comin’ …
30yy: hopefully picture sends the message — watching 4.50% and 4.20% on MONTHLY basis … momentum sending up a signal which is clear as mudd
… With these longer-term visuals for some context, i’d ALSO like to mention SEASONALS. A few words as they relate to … BONDS
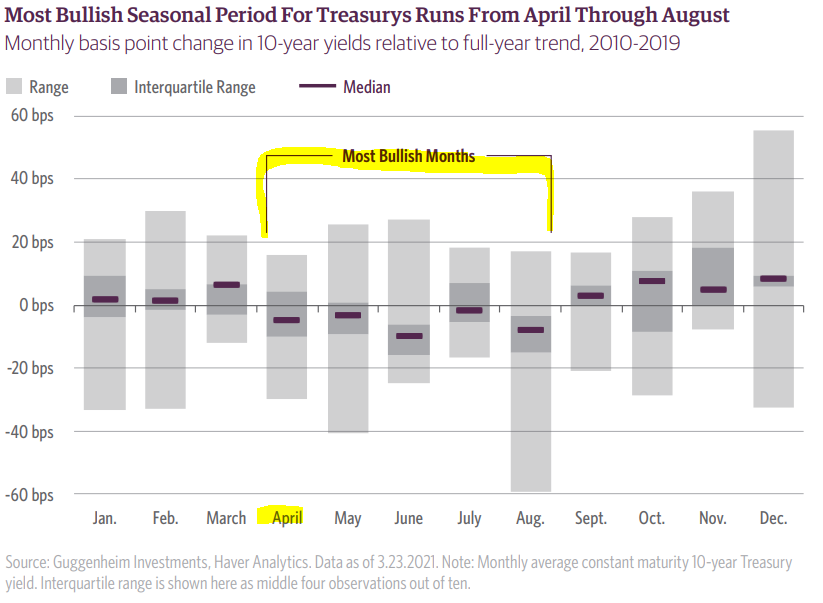
Guggenheim March 29, 2021 Don’t Look Now, But Bond Seasonality Is Turning Bullish
The seasonal pattern of stock market returns has made “Sell in May” a common refrain, but we find that seasonal patterns also exist in the bond market. The summer months, which tend to see weaker-than-average stock returns, also tend to deliver stronger-than-average returns for bonds.
The chart below shows the monthly change in 10-year Treasury yields relative to the trend of each year. After all, a 10 basis point monthly decline in yields wouldn’t tell you much about seasonality in a year that saw yields decline 120 basis points. Focusing on data during the 2010-2019 expansion (to avoid recession distortions), we find that 10-year yields tended to rise during the September-March period and fall during the April-August period, relative to the trend of each year.
Yields tend to rise into May and June, and drop toward the end of year; 2017 may be no exception…
… Ok SO that was then and this is now … I’ll move on AND get TO some WEEKLY NARRATIVES … a compilation of some of THE VIEWS you might be able to use into the week ahead … Things Global Wall is sayin’ and the ideas then they are sellin’ … some of the highlights (along with a handful of NFL precaps), then …
BMO weekly: April Hours Bring... (asked Gemini to summarize — HERE— and it concludes the author sees an opportunity for a steeper yield curve in the near term, meanwhile … )
… Our long FFZ4 position we entered in the wake of the SEP at 95.36 is trading a bit underwater, though we continue to like holding the position as a hedge against a more dramatic slowdown in economic activity … For a new trade this week, we entered a 2s/30s flattener position Friday morning at -26 bp. A deeper inversion from here is consistent with our view of the balance of risks surrounding the economic data on offer this week …
JPM: Bubble or bliss?Why we think stocks could grind higher. (asks and answers …)
UBS: Core PCE inflation falls to 2.78% (actually around to react TO the data … good on them!! … an interesting factoid and visual brought forward from the report…)
FOMC's preferred inflation metric cools on yearly basis, while real spending rebounds in February.
… Interest payments moved sideways in February, but are still at historically high levels as a share of personal income.
Nominal consumer spending shot up by the most in a year in February. Consumers are primarily deploying their outlays in the service sector and that is problematic because it is disrupting progress in bringing down service price inflation…
… The inflation rate for services less housing, or super-core inflation came in at 3.3% year-over-year, but the three-month annualized rate of 4.5% points to a problematic rise in service sector pricing (chart). While financial markets may take some comfort in the annual rate of the core PCE deflator coming in at 2.8% with a slightly smaller-than-expected monthly rise of 0.3% in February, service prices are no longer cooling as they were a few months ago.
… AND more. MUCH, much more…All told doesn’t YET sound like rate cuts / EASING alarm bells ringing inside walls of the Marriner S. Eccles Federal Reserve Board Building … call me crazy.
… Moving along and away FROM Global Wall Street narratives TO a few other things widely available and maybe as useful from the WWW
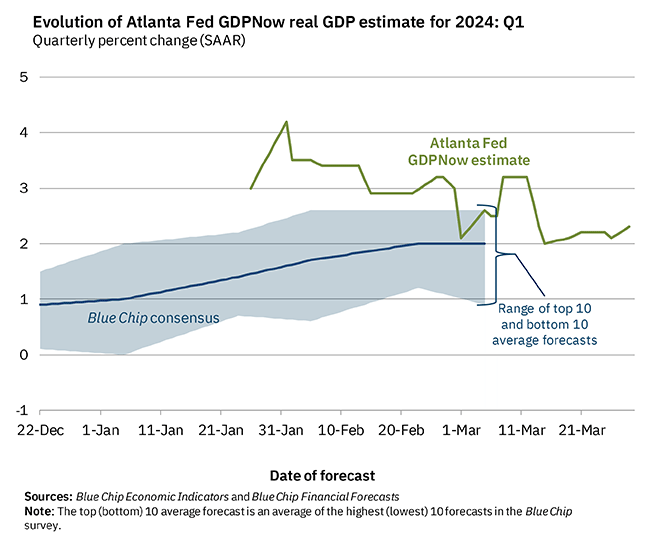
Atlanta Fed GDPNow: First-Quarter GDP Growth Estimate Increased - March 29, 2024 (and so … data comes OUT and revisions go UP … can’t WAIT to watch JPOW…!)
Latest estimate: 2.3 percent -- March 29, 2024
The GDPNow model estimate for real GDP growth (seasonally adjusted annual rate) in the first quarter of 2024 is 2.3 percent on March 29, up from 2.1 percent on March 26. After recent releases from the US Census Bureau and the US Bureau of Economic Analysis, the nowcast of first-quarter real personal consumption expenditures growth increased from 1.9 percent to 2.6 percent, while the nowcast of the contribution of the change in real net exports to first-quarter real GDP growth decreased from -0.16 percentage points to -0.47 percentage points.
Apollo: S&P 500 Market Cap Is Up $10.9 Trillion Since the Fed Pivot (um … adda boy, Jay)
The S&P 500 is up 25% since the November FOMC meeting. That is a $10.9 trillion increase in the market cap of the S&P 500 in five months.
Similarly, with lower rates and tighter credit spreads, the market cap of the US bond market is up $2.6 trillion. That’s a total increase in wealth since the Fed pivot of $13.5 trillion. For comparison, US consumer spending in 2023 was $19 trillion.
Combined with higher home prices and higher bitcoin prices, the bottom line is that the wealth gain experienced for US households since the Fed pivot is at least 70% of consumer spending, and this is going to be a strong tailwind for private consumption over the coming quarters.
Chicago Fed: Open-Ended Treasury Purchases: From Market Functioning to Financial Easing
We exploit the Fed’s Treasury purchases conducted from March 2020 to March 2022 to assess whether asset purchases can be tailored to accomplish different objectives: restoring market functioning and providing stimulus. We find that, on average, flow effects are significant in the market-functioning (MF) period (March-September 2020), while stock effects are strong in the QE period (September 2020-March 2022). In the MF period, the elevated frequency and size of the purchase operations allowed flow effects to greatly improve relative price deviations, especially at the long-end of the yield curve. But stock effects remained localized, thus not large enough to be stimulative. In contrast, in the QE period, stock effects were stimulative because cross-asset price impacts got larger as the Fed communication and implementation moved toward “traditional” QE, increasing purchases’ predictability. Lower uncertainty about the expected size and duration of total purchases facilitated their impounding into prices. Overall, these findings suggest that communication and implementation can be used to tailor the goals of asset purchases.
FirstTrust: Three on Thursday - State of the U.S. Yield Curve (basically what we’re doing here is another rehash of DBs Jim Reid chart of the day noted HERE)
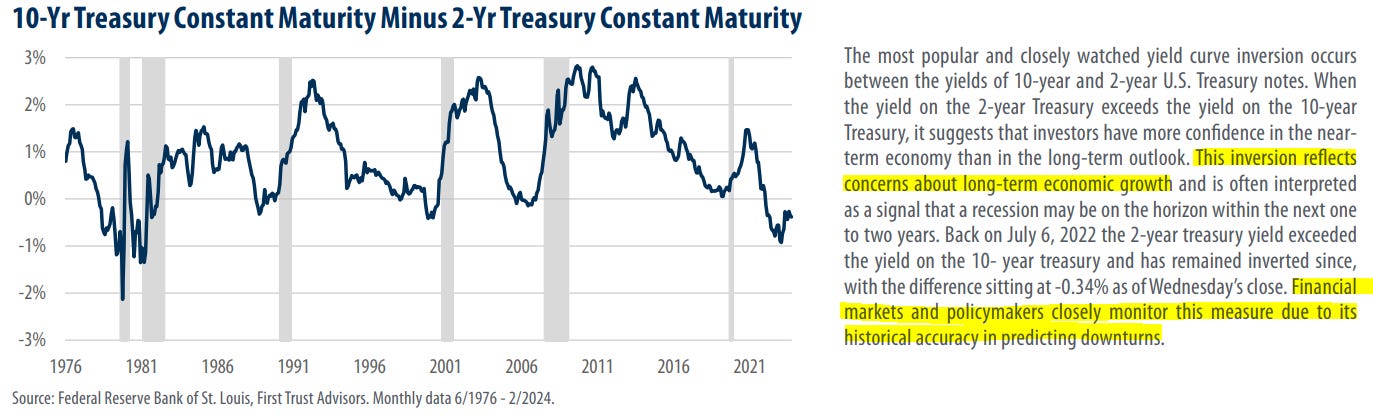
In this week’s “Three on Thursday,” we dive into the U.S. treasury yield curve. A normal yield curve, sloping upwards, suggests healthy economic conditions, with investors expecting higher returns for longer-term loans. An inverted curve, where long-term rates dip below short-term, often signals an upcoming recession. Currently, the U.S. yield curve has been inverted for a record 630 days as of this Wednesday, a trend raising eyebrows.
For just the 8th time since 1950 the S&P 500 posted back-to-back quarterly gains of 10%+.
Slice and dice the data however you want - the key takeaway is strength begets strength.
WolfST: Resurging Corporate Profits Show Inflationary Pressures Are Reheating after Lull: Corporate Profits by Major Industry
ZH: Philadelphia Fed Admits US Payrolls Overstated By At Least 800,000
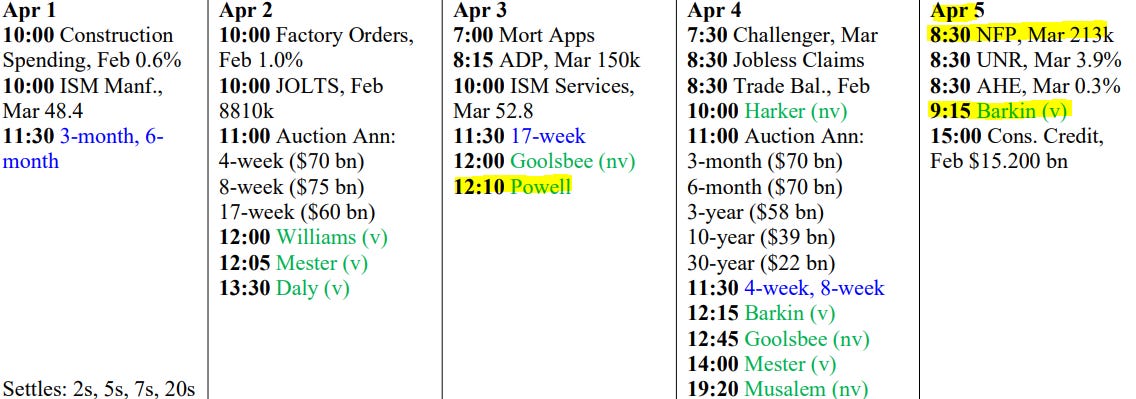
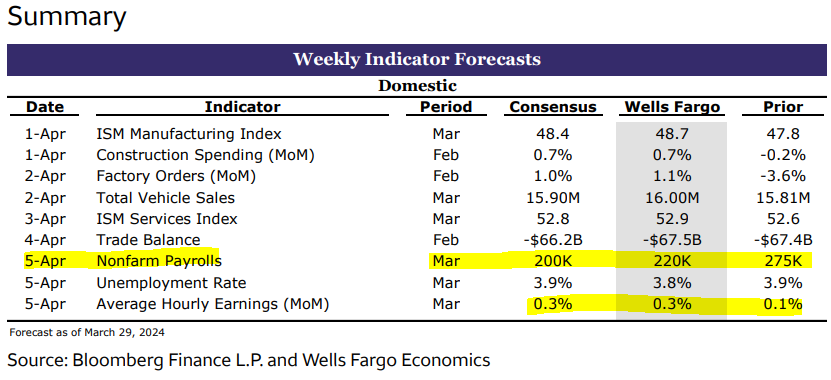
… AND for any / all (still)interested in trying to plan your trades and trade your plans in / around FUNduhMENTALs, here are a couple economic calendars and LINKS I used when I was closer to and IN ‘the game’.
First, this from the best in the strategy biz is a LINKthru TO this calendar,
The ole Friday Nite (or Thurs Nite in todays case) Bad News/Data Dump imho is aka Ancient Chinese Secret. I especially lol the pre-3day wknd Fri Nite News/Data dump. Sir Epstein 'suicided' on a late Fri-Nite. I especially enjoyed the security cam so-called 'glitch'. As a longtime Gov employe I can tell you in regards to the CA prison system, the cams ALWAYS work. ESPECIALLY when we staff can be incriminated. Interestingly the staff at Epstein's prison involved were swiftly dismissed & disappeared.
News is light today, thought I'd be 'sick' and skiing today, but the storm doesn't arrive till late today, so thanks for keeping me company today, BBK-Bong Beat King :)
To me it looks like the Same Economic
Trends are continuing.
Stronger Spending and Employment,
Sticky Inflation, all serving to push
Rate Cuts further down the road.
Status Quo Unchanged...
FED on HOLD, Indefinitely..