while WE slept: USTs 'thin', contained range; UPdated US rates f'casts (BAML and DB offer nuanced / bearish view); new world order = fear of the long bond(?)
Good morning … a(nother) very big macro week ahead as evidenced by economic calendars noted over weekend (updated stale link yest when I noticed, so sorry for that) …
Financing needs announced, pre JOBS report (JOLTS, ADP), month-end extension needs, GDP, ECI and PCE with grand poohbah of data on Friday (NFP) ...
There are a couple updated rates calls below and if they were uniformly bullish / bearish, well, that would be easy and I’d have said as much already.
Nuance in the call based on the curve and frankly, this moment in history. Stagflationary inputs are real and we’ve not been here before in recent memory so I’m taking in the updates all with a yuuuuge grain of salt and am currently more sympathetic to taking the ‘under’ in as far as 2025 rate cuts currently priced (CME FedWatch Tool) but at the same time, I’ve got a great deal of respect of Lacy Hunt/ HIMCo. Bill Blain below, too.
And so, on we go off into the wild blue yonder of another week but first, a look at 5s …
5yy DAILY: 3.90 seems about right for this moment in time … (down)TLINE and …
… recent lows all make current levels — 3.90% — worth WATCHING as opposed to engaging with a new position. Momentum (slow stochastics, bottom panel) have moved from overSOLD, and so a better BUY, to nearly overBOUGHT … might be time to unwed longs and put some hay in the barn … sorry for mixin’ matchin’ of metaphors …
… I’ll quit while I’m behind and get to IT but first … here is a snapshot OF USTs as of 651a:
… for somewhat MORE of the news you might be able to use … a few more curated links for your dining and dancing pleasure …
NEWSQUAWK US Market Open: US equity futures mixed, USD choppy on spot month end and USTs contained into Treasury Financing Estimates … USTs are contained, but do hold a downward bias. Newsflow on the tariff/trade front included indications of a potential path to a US-China agreement, however, specifics have been light with major catalysts ex-geopols a touch light. Amidst this, USTs find themselves in a thin 111-14+ to 111-22+ band. Ahead, the docket is focussed on the Dallas Fed Manufacturing Business Index before the Treasury Financing Estimates ahead of Wednesday’s Quarterly Refunding …
Finviz (for everything else I might have overlooked …)
Moving from some of the news to some of THE VIEWS you might be able to use… here’s some of what Global Wall St is sayin’ …
THE bank of the land … with an UPDATE OF YLD F’CASTS …
25 April 2025 BAML: Global Rates Weekly Double WAMmy
The View: Data and US refunding in focus We update yield forecasts to reflect fewer hikes (Japan), 2026 cuts (US) and lower troughs (Euro Area, UK). Next week sees a heavy US data calendar with NFP, ISM, PCE inflation, etc, but US refunding announcement possibly more important. BoJ and EA, AU CPI also in the mix.
Rates: Bond market finds its footing US: We tactically adjust our curve & spread views ahead of UST refunding next week. US rate forecasts updated. X-date is pushed to fall with recent data.
.. US rate forecast revisions: lower front end with Fed cuts We revise our US rate forecasts after a shift from our US economists. Our economists revise growth lower, inflation higher, & more stagflation risk. They now expect 100bps of Fed rate cuts in 2H ’26, not until after inflation peaks (see: Surfing tariff wave).
Our rate forecasts now reflect a lower path of front-end & belly rates but no change to our end ’25 & ’26 10Y forecasts (Exhibit 1). We also bump up our 30Y forecast to reflect increased supply / demand concerns. Our rate forecasts vs forwards: near-term = flatter with fewer near-term Fed cuts; medium-term = steeper due to later Fed cuts & continued back-end supply / demand concerns.
…Bottom line: we update rate forecasts and hold core duration views. We tactically adjust our curve and spread views ahead of UST refunding next week, which is likely to send signal on buybacks and less long-dated issuance. X-date is pushed to fall with recent data…
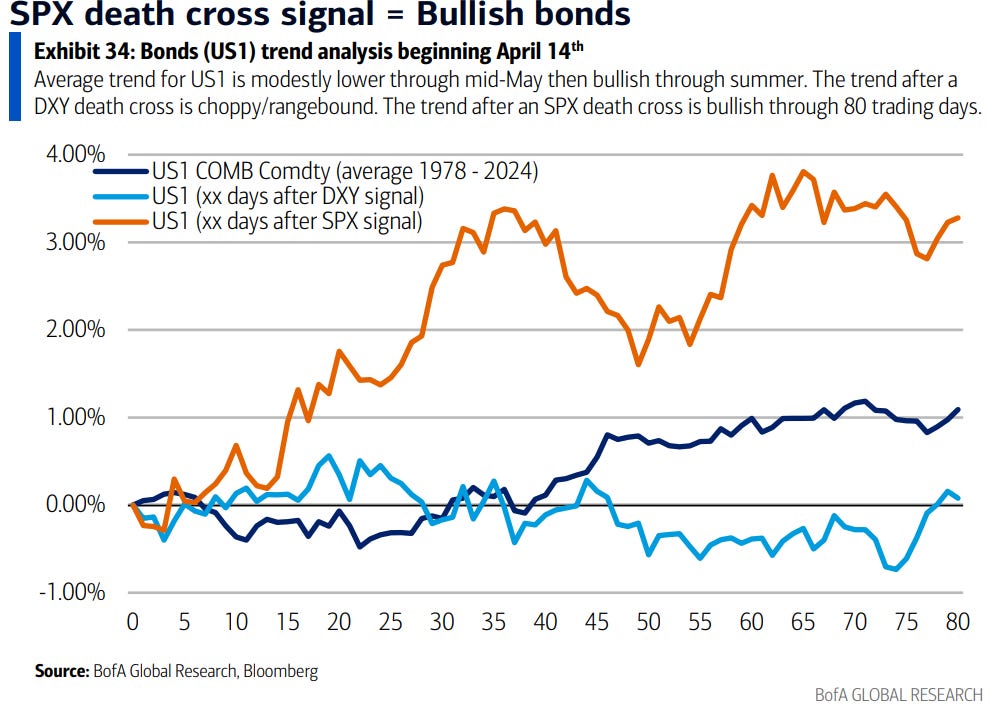
…Technicals: SPX death cross signal = Bullish bonds A death cross signal on SPX is bullish bonds. In the past, bonds have been up 20-80 trading days later 78% of the time. This suggests US1 is > 114-16 in June-Aug 2025.
The SPX saw a death cross signal on April 14. This signal has been a bullish indication for bonds. The forward trend outperformed a bullish seasonal trend.
The average down ratio for bonds from 20-80 trading days after was just 22%, or up 78% of the time. Average and median gains were positive and mostly trending up. This suggests US1 is above 114-16 in June-Aug 2025.
For more on macro market trends after this signal, please see: Quantifying Technicals: Macro trends after SPX & DXY death cross 23 April 2025.
Global WALL continues to question safety valve and value of USTs as a port in a storm …
27 Apr 2025 BNP: Sunday Tea with BNPP: UST pain leads to pivots
KEY MESSAGES
We think US administration reflexivity to pressure in the Treasury market favours buying 30y USTs versus swaps.
With bear steepening pressure in the US alleviating, we like positioning for flatter EM curves in 5s10s SGD, ZAR and CZK.
We think the USD can continue to trend weaker – even if US back-end yields are in the zone of peaking – as the rotation out of US assets appears to have room to run.
… For the market, what’s crucial is that there’s growing evidence the US administration has a pain threshold with the bond market (and that we are close to it). The 90-day tariff pause followed a 60bp sell-off in USTs over 7–9 April. The change of tone this week on Powell and China came after similar pressure in the UST market. We take signal from these data points and think the administration’s reflexivity to the bond market should favour adding long 30y swap spreads. We note two specific policy levers the administration can pull. To support UST demand, it can quicken reform of SLR. On the supply side, at the upcoming quarterly refunding on 30 April, it can suggest no further coupon increases for the foreseeable future. In an extreme scenario it could even reduce Treasury coupon issuance by a small amount although that is not our base case (see US rates: Treasury can consider cutting coupon sizes, dated 21 April).
We think the limit is approaching for how much US Treasuries can underperform versus swaps, and we think the limit may also be nearing for the degree to which the US curve can steepen further. A recovery in UST’s relative strength may support various EM rates markets which have steepened in a high beta format in response to the moves in the US. Accordingly, we see attractive risk–reward in SGD (see EM rates: Enter 5s10s SORA flattener, dated 23 April), CZK and ZAR 5s10s flatteners (see EM rates: CZK & ZAR flatter, take profit on rec CZK FRA, dated 23 April).
While US yields may find some support from the Treasury refunding meeting, we do not think the USD has troughed…
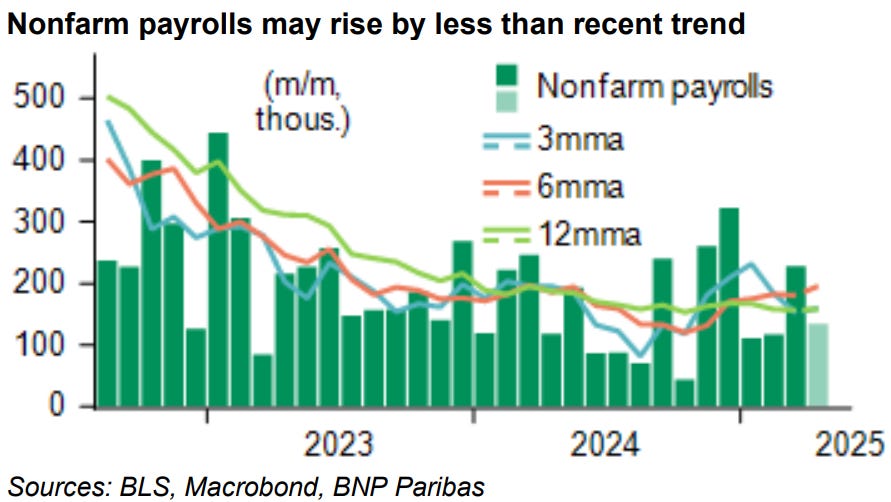
… The coming week brings a raft of key US data include April payrolls on Friday, Q1 GDP on Wednesday, and the ISM survey on Thursday. We expect April employment and Q1 GDP data will bear the imprint of the US administration’s economic policies but won’t be conclusive enough to move the Fed off the sidelines. We look for a 135k gain in nonfarm payrolls and a steady jobless rate at 4.2%, alongside an import-driven stall in GDP growth (0.4% saar). While anecdotes point to a softening job market, an unexpectedly resilient report coupled with rising inflation risks would align with our view that the risks are not wholly one-sided in terms of the direction of Fed policy this year.
We expect the FOMC to review the monetary policy response to tariffs at June’s policy meeting. The latest optimism about ongoing bilateral trade negotiations would tend to lengthen the current holding pattern, to the extent we begin to see an actual de-escalation in tariffs. The 90-day reciprocal tariff pause extends into July, which also argues for June being too early for a move absent clear data. For more see: US: Bracing for a disturbance in the force, dated 25 April.
Our recently updated base case for the US economy is one where tariffs are reined in from current levels, allowing the economy to narrowly avoid recession. A key feature of our view is that while hiring suffers amid uncertainty, the Trump administration’s policies are also constraining labor-force growth. As a result, the unemployment rate only grinds moderately higher – to 4.6% at year-end and stays below 5% in 2026 – while inflation heads toward 4% (see US: Things could get worse from here, dated 10 April).
AND another rates f’cast updated … TLINES drawn, then redrawn. Trends yer friend ‘til it bends … etc, etc … Key here is the word BASELINE which is Global Wall speak for their best guess …
Earlier this month we outlined 10y UST scenarios focusing on the potential fiscal policy response to the April 2nd tariff announcement as a key driver. Based on developments since, and in-line with our US Economics (USE) team’s updated outlook, we now formally revise our SOFR and UST forecasts.
Given elevated uncertainties around the path of key policies, in addition to a baseline that we adopt as our formal forecast we outline two alternative scenarios which differ in assumptions on tariffs and fiscal policy and the implications for the Fed rate path, term premia, and swap spreads. The set of outlined scenarios is best viewed as directional; there is clearly a very wide range of plausible paths ahead, but we see the ones here as providing a useful lens through which to track developments.
In our baseline, which aligns with USE’s outlook, 10y UST at the end of this year is 4.45%. Rates across the curve are modestly above forwards, reflecting a higher fed funds rate path and term premia than the market is pricing. In the scenario that entails escalation of tariffs relative to the baseline, the 10y comes in modestly higher at 4.55% but curves are significantly steeper and 30y UST reaches 5.25%. Finally in the scenario with more fiscal consolidation, 10y UST falls to 3.95% with lower rates and flatter curves than both the baseline and forwards.
Jamie Dimon’s operation on US FI markets …
25 April 2025 JPM: U.S. Fixed Income Markets Weekly
…Governments Treasury yields declined sharply over the last two weeks, but have lagged the retracement relative to other asset classes. Indeed, structural shifts in demand justify higher term premium, but yields have also been buoyed higher by positioning technicals which now look more neutral. Thus we continue to favor 2-year duration longs and 2s/5s steepeners to position for further normalization and as recession is likely to take hold in 2H25. We expect Treasury to keep nominal coupon auction sizes unchanged at next week’s refunding and project three quarters of auction size increases starting in November, but risks lean toward this being delayed until 2026. Treasury could leave its forward guidance unchanged to help anchor market expectations, but attempts to shorten the WAM or make more active use of buybacks is likely to not be viewed credibly by markets. We expect Treasury FRN DMs to widen over the medium-term. We recommend adding 2Yx3Y inflation swaps longs as the sector appears cheap to both surrounding sectors and against fundamentals…
…Treasuries I want new friends but they don’t want me
We think the rise in term premium this month has been justified by the structural shifts in demand for Treasuries, but yields have also been driven higher by more temporary technical factors. Market depth remains 30% below the levels that persisted prior to April 2, and may remain low over the near term. Position squaring also played a role in rising yields, and most metrics indicate long positioning is not as pervasive as it was earlier this month
We favor staying overweight duration to position for further normalization in an environment where we believe a recession is likely in 2H25, but given that higher term premium is likely a more permanent feature moving forward, we continue to recommend longs in the 2-year sector. We also favor 2s/5s steepeners
We expect Treasury to maintain current auction sizes until November, but risks lean toward this being delayed until 2026. Secretary Bessent has prioritized lowering 10- year Treasury yields, and a slower pace of QT reduces the urgency to increase issuance...
...Treasury could anchor market expectations through leaving forward guidance roughly unchanged, but we think attempts to actively shorten the WAM of the debt or to make more substantial use of buybacks would not be viewed as credible by markets
We would not be surprised if Treasury tasks TBAC with a charge question on stablecoin demand for T-bills, as it would be one reason to maintain a higher bill share than average, and we do think there is room for substantial growth here
Treasury FRN DMs are likely to remain rangebound over the near term but are biased wider over the medium term as the Fed resumes its easing cycle and as T-bill supply picks up following the debt ceiling resolution
… we believe technical elements are at work in keeping yields elevated, and these are unlikely to be as persistent as the moves in term premium. First, liquidity conditions have yet to fully normalize, and remain about 30% below the average levels observed prior to the “Liberation Day” announcement (Figure 13). Over the near term, our colleagues in derivatives strategy argue that persistent policy uncertainty, has created a supportive backdrop for long volatility positions due to highly elevated jump risk. We think the deterioration in liquidity conditions amid sharply increasing volatility have allowed yields to remain elevated, but over the medium term, as conditions normalize and market depth improves, this should allow for further declines in yields.
Questioning the safety of USTs as a portfolio hedge? Yer not alone …
April 27, 2025 MS Sunday Start | What's Next in Global Macro: The Safe-Haven Question
The prospect of foreign investors reducing exposure to US assets amid concerns about the continued predominance of US Treasuries as a safe haven has been at the center of market debate over the last few weeks. Significant shifts in cross-asset correlations, particularly between US equities and USD, are adding to concerns. The correlations between US equities and FX are nearly two standard deviations above their average over the last five years (see Are Cross-Asset Correlations Broken?), with USD weakening as equities have sold off – a pattern more associated with emerging than developed markets. In our view, evolving market perceptions of the trajectory of the US economy and policymaking are taking the global economy and markets to unprecedented levels of uncertainty and challenging long-held assumptions about cross-asset relationships.
Over the last 20 years, US markets have had a terrific run, and for good reason. US growth has consistently outperformed much of the rest of the developed markets. Furthermore, US policymaking has been consistent if not infallible, with clear lines of demarcation between the executive branch and the central bank. US markets have attracted abundant capital flows during periods of stability as well as stress, and USD has remained entrenched as the global reserve currency. While capital inflows during periods of relative normalcy driven by the persistent relative outperformance of US equities are not surprising, it is noteworthy that even during periods of stress in risk markets, much of the world turned to US Treasuries and other high-quality US fixed income instruments as safe-haven assets. This held true even when market stress emanated from the US, as during the global financial crisis. USD’s dominance and global influence are evident across multiple metrics – central bank reserve allocations, global trade financing, foreign exchange activity, crossborder lending, and debt issuance.
However, some recent developments may signal that the environment is changing…
…The concern about US Treasuries’ continued safe-haven status bangs up against practical realities, however, raising the question of where to find safe-haven alternatives. Two points are worth considering here. First, the quantity of global safe-haven assets excluding US Treasuries has declined meaningfully in the last 15 years. As Matt Hornbach, our global head of macro strategy, notes, global safe havens ex US Treasuries outstanding stand at ~4-5% of the total today versus ~14-17% during the global financial crisis. Second, while alternatives exist – government bonds in select European countries are potential candidates – their scale, size, depth, and liquidity are meaningfully lower. For example, the US Treasury market is 10 times larger than equivalently rated government bonds in the euro area. While the expected ~€500 billion issuance by Germany for infrastructure- and defense-related spending would help, it will take time and will provide only a marginal increase in the availability of alternative safe-haven assets.
… and another note, same shop, questioning more than USTs as a hedge but …
April 28, 2025 MS: The Weekly Worldview: The Fed's Independence
The structure of the FOMC leaves very little room for concerns about the Fed's independence.
Fed independence was one of the key topics being discussed at the IMF spring meetings last week. The President’s most recent stance was that he has “no intention” of firing Chair Powell, despite comments from government officials in recent weeks. Regardless, the debate is not new. Last year, we published a view that Fed independence was at immediate risk. It is a good time to revisit that view and re-assess.
A relevant but highly technical starting point is that the President names the Chair of the Board of Governors of the Federal Reserve System (the Board), subject to confirmation by the Senate, but the entity that sets the policy rate is the Federal Open Market Committee (FOMC). The FOMC is technically distinct from the Board. The FOMC comprises each member of the Board and 5 of the 12 Reserve Bank Presidents. By convention, the Chair of the Board is the Chair of the FOMC, but the FOMC in fact selects its own Chair. Consider the fact that John Williams, the President of the FRBNY, is the Vice Chair of the FOMC, while Phil Jefferson is the Vice Chair of the Board. Powell is simultaneously Chair of the Board, a Governor on the Board, and Chair of the FOMC…
…Looking further down the road, the composition of the FOMC would continue to change. Governors are able to resign whenever they choose, and few stay the entirety of their 14 year terms. Reserve Bank Presidents are selected by the Board of Directors of the local Reserve Bank, but are subject to veto by the Board of Governors. The term of the President of the Federal Reserve Bank of New York is up in 2028, and so the Board of Governors at the time will have substantial influence.
Same shop with a global MACRO note on USD outflows…
April 28, 2025 MS: US Primary Dealer Perspectives on USD Outflows | Global Macro Strategist
If investors abroad exit their USD-denominated investments, other investors – foreign or domestic – need to buy them else they sit on the balance sheets of US primary dealers. We analyze holdings and transactions to evaluate the aftermath of April 2.
Key takeaways
Primary dealer holdings data show that USTs and MBS accumulated on balance sheets ahead of April 2, but only holdings of MBS remain higher as of April 16.
Primary dealer holdings data suggest if investors abroad sold USD-denominated assets, other investors – foreign or domestic – bought most of them.
Short-end US rates and policy uncertainty are critical factors in determining the path of USD and the risk premium with which it trades relative to rates.
We think risks relating to these two factors skew more USD-negative than USD-positive and continue to recommend short USD positions versus EUR and JPY.
… Exhibit 3 shows US primary dealer holdings of fixed income securities ahead of April 2. Exhibit 4 shows how primary dealer holdings evolved over the past decade.
US Treasuries and mortgage-backed securities (MBS) dominate primary dealer holdings – a decade-long dynamic that investors should find unsurprising.
Primary dealers hold almost twice the amount of US Treasuries today than during the "global dash for cash", but roughly the same amount of MBS.
…Exhibit 4: US primary dealer holdings over the past decade (five-week moving average)
In this context, the difference between how primary dealer holdings of Treasuries evolved in recent weeks versus the "global dash for cash" suggests very little "dumping" by investors. In addition, it suggests that primary dealer balance sheets better dealt with the selling that occurred…
Same shop with a look at STOCKS …
April 28 2025 MS: US Equity Strategy: Weekly Warm-up: Testing Both Ends of Our Range
We remain in a late cycle backdrop where both quality/large cap relative outperformance should persist. On this front, we offer new analysis to help investors selectively pick spots in quality cyclicals that have already discounted a material growth slowdown.
Testing Both Ends of Our Range...The S&P 500 tested both the lower and upper ends of our 5000-5500 range last week, reinforcing the notion that we remain in a volatile trading environment. Incrementally positive news on a potential tariff deal with China and hope for a more dovish Fed lifted stocks into the end of the week, and the S&P closed slightly above the upper end of our range. While a modest/brief overshoot of 5500 can persist very short-term, a sustained break above the next level of resistance (5600-5650) is likely dependent on developments that have yet to come to fruition: (1) a tariff deal with China that brings down the effective rate materially; (2) a more dovish Fed; (3) back-end rates below 4% without recessionary data; and (4) a clear rebound in earnings revisions (see 1Q Earnings Update for more). Bottom line, until we see clearer risk-on shifts in these factors, range trading is likely to continue.
How to Position...The most important takeaway here from our perspective is to stay up in quality (see last week's note for screens)…
…Rates Remain Critical to Watch...The sharp rise in the 10-year yield from April 7-11 coincided with the peak in the rolling equity return/bond yield correlation. Since then, this correlation has gone from meaningfully positive (bad is bad/good is good) to essentially zero today. This shift makes sense in the context of the fact that the term premium drove the upside in yields during that period (as opposed to an improvement in growth expectations, which would be the more risk-on reason for higher yields). Should this correlation drop further and enter negative territory again, the long end of the yield curve will matter more for equities—i.e., a further drop below 4.0% in the 10-year driven by a decline in the term premium could be the positive catalyst for a more material breakout beyond 5600-5650. Conversely, a break above 4.50% in the 10-year yield in the context of a negative equity return/bond yield correlation would likely mean risk-off price action.
Last Friday’s US data showed a notable improvement in late April consumer sentiment, but only for registered Republicans. Consumers today are buying goods imported before the oppressive burden of trade taxes (on average, it will take about three months for pre-tax inventory to be used). This means economic reality has not penetrated the partisan media bubble around consumers. Businesses are faster to react, with uncertainty fueling a collapse in US port activity as companies “wait and see”.
US President Trump suggested that trade tax revenues could finance an income tax cut for people earning less than USD 200,000 a year. This hints at an understanding that low income households pay trade taxes, not foreigners. However, trade tariffs cannot replace income taxes—to suggest otherwise either raises questions of policy competence, or implies a deficit-financed tax cuts. Neither is likely to shore up waning faith in the safety of the US dollar.
The Federal Reserve is in its blackout period, and there are just a couple of ECB speakers today. Last week’s barrage of policy-maker comments reduces the impact of today’s remarks.
There are some sentiment surveys, which are not to be taken as reflecting reality. The US Dallas Fed manufacturing sentiment data does offer the always entertaining comments section.
Finally, another look at the economic week ahead …
Apr 27, 2025 Yardeni: ECONOMIC WEEK AHEAD: April 28–May 2
The week ahead is jampacked with economic updates. The headliners will be Q1's GDP and March's personal income and expenditures (both Wed) as well as April's payroll employment (Fri). We're expecting relatively strong employment data, which should highlight the US economy's resilience notwithstanding Trump's Tariff Turmoil (TTT). The week's inflation indicators likely remained subdued, although tariff-related inflationary pressures are building…
… And from the Global Wall Street inbox TO the intertubes, a few curated links …
Credit cards are dangerous …
April 27, 2025 Apollo: Credit Card Data Shows More Consumers Under Pressure
Data from the Fed shows that a record-high share of households are only making the minimum payment on their credit cards, see chart below.
Here’s a VIEW which certainly catches ones eye — click bait or not, you decide … interesting, though, he (Bill) refers TO what Apollo notes …
April 28, 2025 Bill Blain: Blain’s Morning Porridge April 28th 2025: The US DATA is undeniable – recession this way comes..
That was an interesting weekend. Strip away the politicking in Rome, or how China is blanking Washington by playing the Long Game with an increasingly beleaguered US President holding a crap hand of cards, or even the sustained tumble in the US$ – the economic reality is becoming increasingly apparent: an increasing number of Western Consumers live in a barely coping society which is about to be tested to the limit.
If consumers aren’t consuming, the inevitable result is economic slowdown and recession.
More Americans than ever before are making minimum payments on their credit cards. It’s not just the USA – nearly 1/3rd of Brits loose sleep at night, worrying just how tenuous their finances are.
April 27, 2025 at 7:00 PM UTC Bloomberg: Treasury Market’s ‘New World Order’ Brings Fear of the Long Bond
The “Sell America” trade that gripped markets this month has left a potentially lasting dent in investors’ willingness to hold the US government’s longest-maturity debt, a mainstay of its deficit-financing toolkit.
For bond managers at BlackRock Inc., Brandywine Global Investment Management and Vanguard Group Inc., the problem is that as President Donald Trump approaches his 100th day in office, he has generated a growing lists of unknowns, forcing traders to focus on a broad array of issues beyond just the likely path of interest rates.
To name a few: What do Trump’s trade war, tax-cut agenda and scattergun policymaking mean for already weakening economic growth, sticky inflation and massive fiscal shortfalls? Will he again threaten to fire Federal Reserve Chair Jerome Powell? Is he actively seeking a weaker dollar?
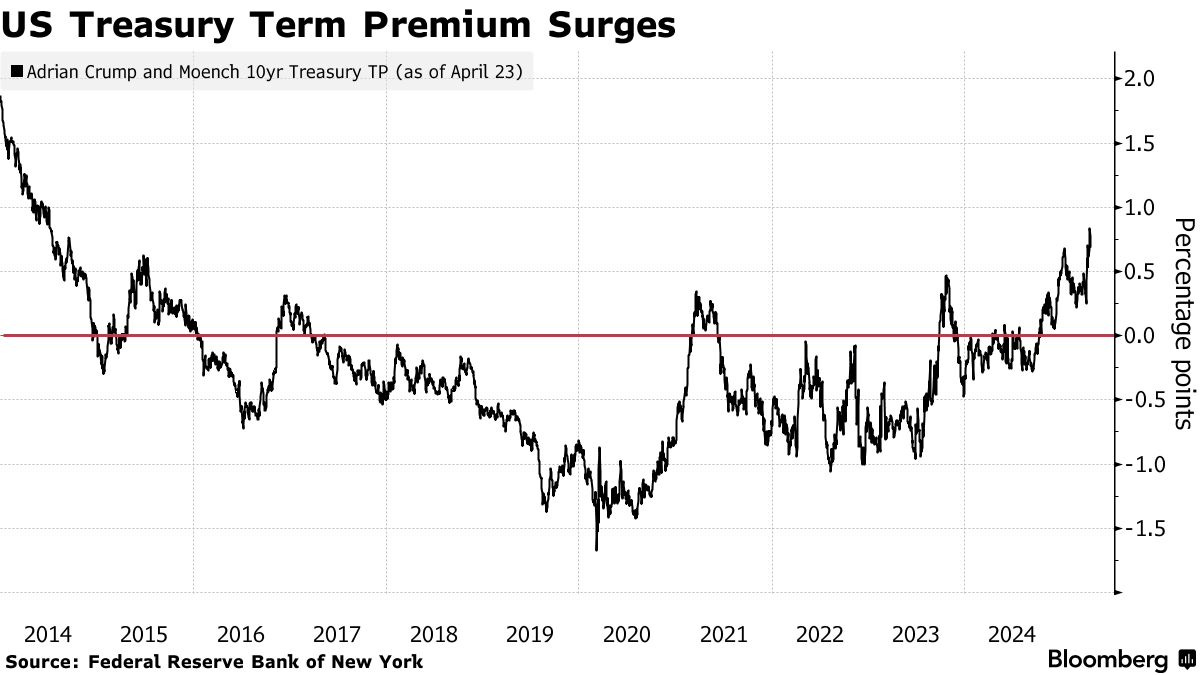
The result is a heightened notion of risk that’s leading bond buyers to question the traditional haven status of US government debt and require higher yields on longer maturities. By one measure, that added cushion, which traders dub the term premium, is around the highest since 2014.
“We’re in a new world order,” said Jack McIntyre, who with his team oversees $63 billion at Brandywine. “Even if Trump backpedals on the tariffs, I think uncertainty levels are still going to be elevated. So that means term premium stays elevated.”
Of course, some of the angst around Treasuries could well fade should Trump strike trade deals or continue to signal that he’s wary of a full-fledged rout in bonds. But as Treasury Secretary Scott Bessent prepares to unveil the government’s latest borrowing plans on Wednesday, he faces the added task of calming investors grappling with a growing host of concerns.
All the uncertainty is leading McIntyre to stay roughly neutral to his benchmark. It’s also changing how he sees the long bond behaving in the event of an economic slowdown. In a nutshell, he says yields would remain higher than he’d otherwise expect.
No Flight
It’s not as if investors are fleeing Treasuries wholesale. JPMorgan Asset Management sees them as a better bet than European government bonds. And this month’s 30-year Treasury auction showed that there’s appetite for the maturity — at the right price. The result allayed fears of a buyers’ strike, and long-bond yields have eased back from their recent peak.
Sentiment, however, remains fragile. For example, while Trump last week said he had “no intention” of firing Powell, his criticism of the Fed chair leaves some investors worrying about the central bank’s independence.
Pacific Investment Management Co., which likened this month’s episode of triple-weakening in the dollar, US stocks and Treasuries to something one might expect in emerging markets, has also been buying Treasuries. But it’s been limiting how far out the yield curve it goes. The $2 trillion bond manager currently favors maturities from five to 10 years.
There are other signs of investor anxiety around the long bond: After adjusting for inflation, 30-year yields this month reached the highest since the financial crisis. Although they’ve since receded, they remain higher than when Trump announced his plan for sweeping tariffs on April 2.
For Vanguard, there’s scope for the extra insurance being built into longer maturities to swell further, especially if widening federal deficits lead to more bond issuance.
“Term premium is no longer low, but you can’t make a case that it’s historically high,” said Rebecca Venter, senior fixed-income product manager at the roughly $10 trillion asset manager. “When you see the fiscal risks in the background, term premium can build over time.”
Vanguard expects US growth below 1% this year, which would be the weakest since 2020, and Venter said “that does not bode well for the US budget deficit.”
Next Chapter
When the Treasury releases its latest bond issuance plans this week, Wall Street expects steady auction sizes over the next three months. With Republicans debating how to pay for their tax-cut bill, the fiscal story is the next chapter for the term premium.
One reason a fatter premium matters is that every fraction of a percentage point in extra yield counts for the government at a time when it’s paying upwards of $1 trillion per year to service its debt.
At BlackRock, which oversees almost $12 trillion, the broad slide across US asset classes earlier this month magnified its concerns around the government’s finances post-pandemic, and how US bonds were vulnerable to shifting investor confidence.
The selloff in US markets “suggests a desire for more compensation for risk and brought that fragile equilibrium into sharp focus,” BlackRock Investment Institute said in a report.
George Catrambone at DWS Americas sees how the term premium might recede, but only so far, given all the shifting signals out of the White House on tariffs and other policies.
“Once greater clarity is given and agreements are reached, I’d expect term premium to abate,” said the firm’s head of fixed income. “Although not back to the lows of the past decade as fiscal will be an ever-present concern.” …
Positions matter and here’s an update on SPECS out the curve … shorts a 30w HIGH…
27 APR 2025 Hedgopia CoT: Peek Into Future Through Futures, How Hedge Funds Are Positioned
Often say that if yer NOT even a little confused, yer NOT payin’ attention … Sam RO …
Apr 27, 2025 TKer by Sam Ro: CHART: The confusing state of the economy
On the other hand, the hard data, which reflects actual activity, has been strong. Retail sales hit a record high in March, and weekly card spending data — which you can see below in TKer’s weekly review of macro crosscurrents — suggest that strength has continued into April. Durable goods orders and shipments continue at elevated levels. Meanwhile, key labor market metrics including job creation, unemployment, and claims for unemployment insurance continue to trend at levels associated with economic expansion.
This narrative of contradictions is illustrated nicely in this chart from Goldman Sachs, which shows how soft data has been surprising to the downside while hard data has been surprising to the upside. In other words, sentiment has been weaker than expected while realized activity has been stronger than expected.
The hard data has been surprisingly good despite the soft data being surprisingly bad. (Source: Goldman Sachs)
Renaissance Macro’s Neil Dutta wrote about these “data discontinuities” in his April 21 note.
“It’s probable that much of the recent upside surprises in hard data reflect pulling forward activity in the anticipation of tariffs,” Dutta wrote. “Consumers pulled forward auto sales and consumption on other household durables, as an example. Firms likely pulled forward some orders too. That likely gives the veneer of strength in the recent high-frequency dataflow.”
During much of the economic expansion that began in 2020, it’s paid off to focus on what consumers and businesses did (i.e., the hard data) over what they said (i.e., the soft data). The Federal Reserve just published research explaining this phenomenon.
“[R]ecent hard data in the U.S., mostly for March, are overstating activity and it’s worth noting that conditions were not especially strong to begin with,” Dutta added. “The collapse across a range of survey-based measures of activity suggest that actual activity will continue to slowdown, in a potentially abrupt manner. Recession may already be here.“..