Good morning / afternoon / evening - please choose whichever one which best describes when ever it may be that YOU are stumbling across this weekends note…
First UP, the wait is OVER and the good doctor Lacy Hunt, has arrived and his latest quarterly is presented HEREwithout further interruption…of course, I’ll spoil it and lead with conclusion … He remains steadfastly BULLISH of long bonds as the speed of money through the system slows along with ODL which again, all points to increased chances for recession. It’s only a few pages (HERE) and so, without further adieu …
…Monetary Policy Since the Fed's first year of operation in 1914, the current four-year percent change for detrended real M2 is in its ninth fall into negative territory (marked as #9 in Chart 1). The second occurrence, marked as #2 Chart 1, is a highly relevant experience for the current situation. Money growth began decelerating sharply in the late 1920s and then turned negative from 1931-35. Then, aggregate demand faltered in response to repeated contractionary BTN measures and the depressive effects of extreme over-indebtedness. However, the Fed did not reverse the monetary contraction, for which it was subsequently excoriated by Nobel Laureate Milton Friedman and former Fed Chair Ben Bernanke.
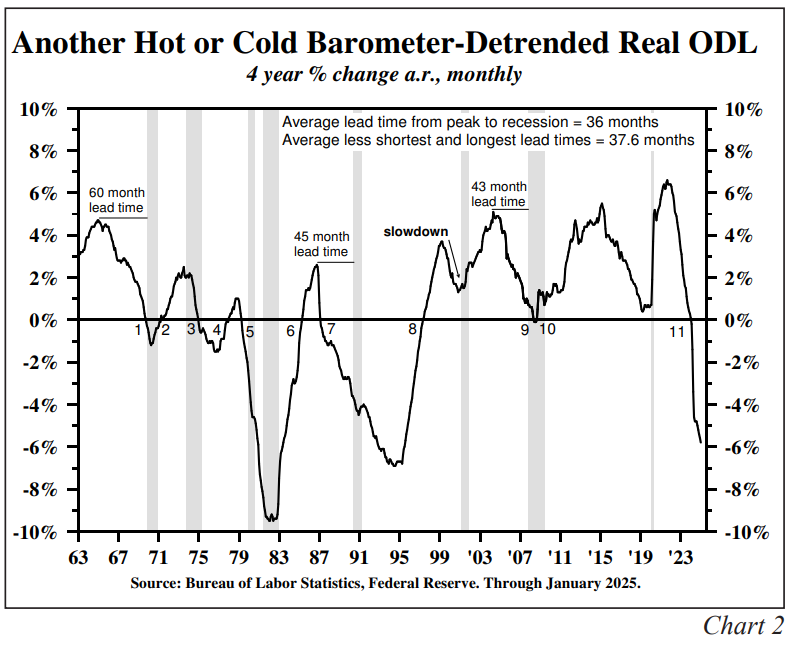
The lagged monetary restraint from 2022 is confirmed by the movement in the Fed's H.8 line item, Other Deposit Liabilities (ODL). As measured on a real detrended basis for the last four years, ODL, which decelerated before all recessions since 1961, has been negative since 2024 (Chart 2).
In recent times, Fed leaders have reiterated that they are data dependent. The experience of a century ago is that tariffs are recessionary but even more so when real money growth contracts. In such circumstances, the Fed should be preemptive, act before data confirmation and speed support to the economy…
…Long-Term Treasury Bonds The current and future direction of government spending is contractionary. Due to the extreme government debt and interest costs, proposed tax cuts, which are in the main extensions not additions, will be slow working. Decreasing regulation, increasing domestic energy production, shifting back to lower-cost fossil fuels, suppressing crime and its cost, and making the government more efficient are all disinflationary measures that help boost the standard of living. However, restoring the U.S. to its historical trend rate of economic growth depends heavily on reversing the debt overhang.
The Fed has yet to cushion the economic restraint from current federal spending and adverse multipliers, the lagged effects of prior central bank actions, and the immediate demographic drag. Thus, the five convergent factors mentioned initially suggest that the risk of recession is high, and the transition to meaningful recovery will be fitful, uncertain, and labored. Such an uncertain environment of tepid or negative economic growth will be conducive to a downward trajectory of long-term Treasury rates.
… sorry, NOT sorry. This weekends ‘stack should end now. Read his views a couple times and note … This is NOT a political comment but rather, a global MACRO note, a few pgs in length, with a review and conclusion that recession RISKS are HIGH and rate cuts are overdue.
That sentiment was expressed by DJT in the week just past.
Funny enough, CME FedWatch Tool still showing the pricing in of a large dose of rate CUTS. Agree or not (the market continues to AGREE with Lacy Hunt), what I can say with 100% confidence this fella has forgotten more about markets and economics as well as geopolitical interplay than I may ever know if I lived 100 lives.
MY focus has been more here and now helping see and keep portfolio managers and HF traders on the right side of current days battle. Longer-term maybe a couple / few months (into and out of recessions, GFC, 1998 and things like COVID) and the like.
Frankly, if I were so good, I’d likely still be doing it.
That’s just the point … I don’t have to be good to know and recognize who IS.
Folks like Danielle DiMartino Booth (of The Daily Feather), Ian Lyngen (BMO, see below) and folks like Eric Basmajian (EPB Research) who I’ve ALWAYS thought our modern day Lacy Hunt…in depth analysis and process of thought.
Unparallelled — ALL of them.
With Lacy Huntcomments in hand, I’ll continue along with my humble offering and begin with a look at some yields …
5yy WEEKLY: 4.20 - 4.05% are TLINE levels I’ll be watching in the week ahead …
… as you can see, we closed below ‘resistance’ (4.05) which is a bullish development BUT momentum (slow stochastics, bottom panel) isn’t really that compelling and so, perhaps some patience and HOPE for a dipORtunity, warranted
30yy WEEKLY: 4.95 - 4.60% are TLINE levels I’ll be watching in week ahead …
… momentum here looks a touch more oversold BUT not yet in convincing style so once again, await dipORtunities and / or lean on DAILY charts …
… As far as a couple / few other items caught MY eye and which helping inform aforementioned price action … Surprising NOBODY, ECB cuts …
ZH: ECB Cuts Rates For The 7th Time, Outlook Leans Dovish Amid "Exceptional Uncertainty"
… Alrighty, then. Domestic housing anyone …?
ZH: US Housing Starts PlungedMostSince COVID In March
…watching what they say AND WHAT THEY DO (important) … IJC for NFP survey week …
ZH: If A Trump-Tariff-Driven Depression Is Imminent, Why Aren't Scared CEOs Firing Anyone?
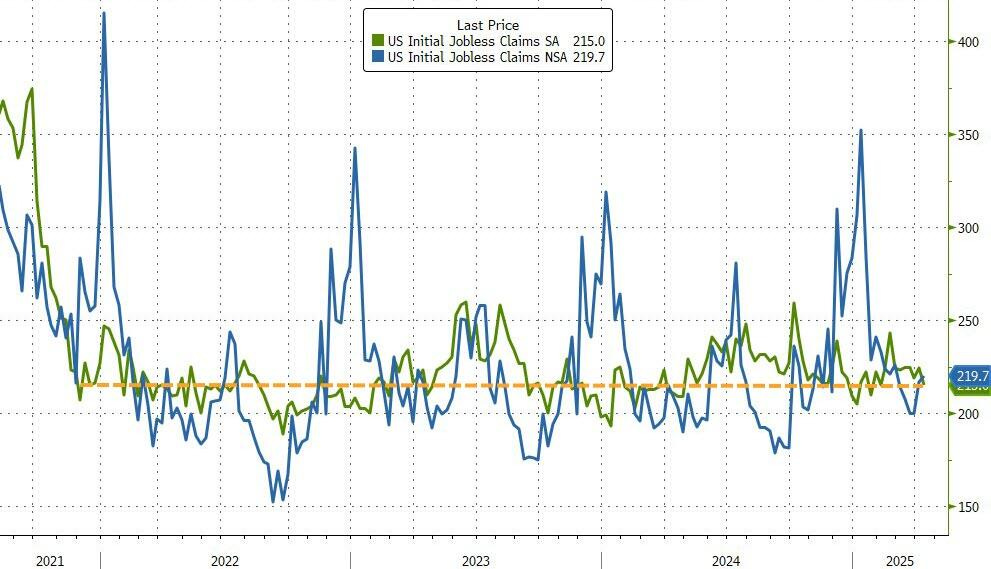
Another week, another bulletproof jobless claims print...
Just 221k Americans filed for jobless claims for the first time last week - a number that is the same level as it was in November of 2021...
… Philly Killa …
ZH: Philly Fed Surveys ScreamsStagflation As 'Soft' Data Slump Continues
… by days and weeks end, though, there’s one visual from ZH recap which stopped me in MY tracks … it brings me back TO HIMCOslatest above, and the increasing chances of recession (and so, justifying rate CUTS currently priced) …
ZH: Oil & Gold Soared This Week As Dollar's Demise Continued; Mega-Cap Tech Wrecked
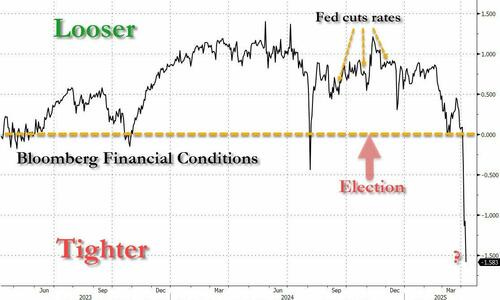
… This should not be a surprise given that The National Team has been active from Beijing for 8 straight days and perhaps explains why The White House is fuming at The Eccles Building over Powell's lack of willingness to do (or say) anything supportive... despite Financial Conditions being dramatically tighter than during the pre-election period when he was more than willing to cut-baby-cut...
… FAVOR / REQUEST if anyone with a Terminal might please send my over a visual of the Bloomberg FCI+ (the “+” is financial conditions index including rates / yld curves), i’d be grateful. Just curious if as dramatic a look as this.
In any case, with the above in mind, well … I’m done …
… I’ll move on TO some of Global Walls WEEKLY narratives — SOME of THE VIEWS you might be able to use. A few things which stood out to ME this HOLIDAY LONG weekend (less is more) from the inbox …
Focus REMAINS on the belly and this note earlier in the week just passed …
14 April 2025 Barclays: Re-initiating long 5y USTs
We had turned neutral from our earlier long duration view on 3 April. With concerns about foreign demand spilling into economic sensitive parts of the yield curve, we recommend re-initiating long 5y USTs. Intermediate real rates are looking high relative to the economic outlook with downside risks.
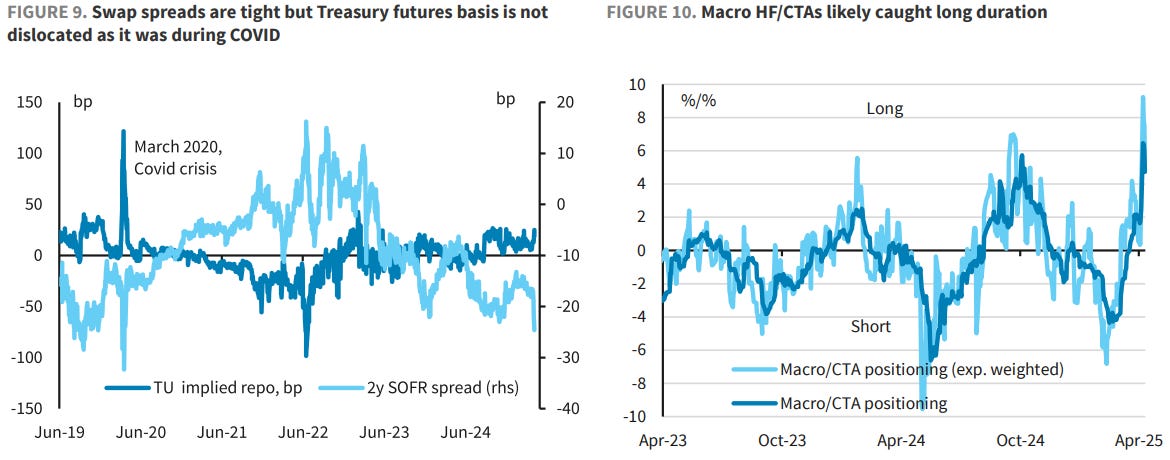
… Investors likely caught wrong-footed in spread wideners and long-duration trades. Part of the cheapening of USTs has to do with tightening of swap spreads. Figure 9 shows that frontend swap spreads have tightened to the narrowest levels observed even during COVID dash for cash. However, measures such as the Treasury futures basis (see here), errors to Treasury splines do not show similar level of stress. This suggests that swap spreads positions in particular were likely caught wrong-footed. In a similar vein, macro HFs /CTAs were likely caught long duration as the narrative of owning bonds in a recession gained prominence. Figure 10 shows our measure of positioning of macro HFs /CTAs positioning which was at the extreme.
Overall, we believe investors are likely to find the intermediate sector attractive at current levels. Recent events have caused intermediate yields to deviate from the economic outlook. We recommend re-initiating long 5y USTs.
Best in the biz staying in 2s10s flattener AND BUYIN’ 5s IF (above 4.02%, the center of MARCH range in ‘open / close terms’) …
… There's been signs that some bilateral trade war negotiations are making headway toward striking a deal that can be signed before the end of Trump's 90-day pause on 'reciprocal' tariffs. While there have been moments when the Treasury market has welcomed hints of flexibility in Trump’s tariff agenda, the Administration's ever-changing tariff rhetoric has left investors reluctant to assume that the delays, carveouts, and negotiations might ultimately translate to a meaningfully lower effective average trade-weighted tariff in the coming months and quarters. That said, the results of the preliminary negotiations with the US's major trading partners remain closely watched given all that they will imply about the potential for the tariff pause to yield lower trade barriers and a less dramatic outcome for the US economy.
The surge in term premium has sent a powerful message to those trying to make sense of the price action since Liberation Day. The message is that investors are demanding excess compensation for bearing the risks associated with President Trump's tariff mayhem at a moment of historically-unprecedented levels of trade policy uncertainty. The New York Fed's ACM model shows that 10-year term premium recently reached 71 bp, its highest level since 2014, and nearly 50 bp off the early-April lows. It's this dynamic that speaks to the idea that Treasuries' safe-haven status has come under pressure as the President’s tariff agenda has ostensibly posed a threat to US credibility.
Despite lingering concerns around the global willingness to underwrite the US Federal deficit, the performance of April's 10-, 20-, and 30-year auctions has shown ongoing end-user demand for US Treasuries. While Bessent has already revealed that the 10-year auction saw "a lot of foreigners show up" with "increased foreign competition" at the long-bond offering, the looming release of the investor class auction data will put some numbers behind the Treasury Secretary's comments. While a sense of stability returned to the Treasury market last week after the violent selloff of early-April, we're wary that the market may have temporarily found itself in the eye of the hurricane. Alas, we don’t have a great deal of confidence that a reprieve from Trump's erratic economic policy changes is in the offing…
…Trading View …The red flags raised by recent leading indicators have informed our dip-buying bias heading into this week, which we'll focus on the 5-year sector given the risks associated with term premium angst in the long-end at the moment. 4.0% is an obvious line in the sand, and we'd look to add a core long position if yields move back above 4.02%, the center-point of March's trading range in open/close terms ...
A large German shop with an (updated) inflation outlook — in a monthly CHARTBOOK form …
17 April 2025 DB: US Inflation Outlook: Calm before the tariff storm
Headline and core CPI prints much softer than expectations
…Recent market selloff will cause portfolio management to be a drag in the near term
Here’s a quick recap / walk through global MACRO on Thursday …
April 17, 2025 MS: Global Macro Commentary: April 17
ECB cuts rates and highlights deterioration in the growth outlook; Bunds bull-steepen as additional ECB cuts are priced in; risk sentiment recovers amid optimism around trade talks; USTs bear-steepen; CBT unexpectedly hikes rates by 350bp; BoK on hold; DXY at 99.46 (0.1%); US 10y at 4.325% (-4.8bp)
…USTs sell-off (30y: +6bp) in a low-volume session ahead of the long weekend as risk assets gain with the 2s30s curve steepening ~3bp d/d…
…It was a relatively quiet session for USTs with low volumes in a shortened session ahead of a long weekend. As US equities gained, USTs began to sell-off led by the long-end. Softer-than-expected second-tier economic data had little impact on the price action. March housing starts had a larger-than-expected drop led by declines in single-family starts that was not echoed in single family permits.
Additionally the April Philadelphia Fed business outlook survey unexpectedly swung into contraction falling to -26.4 (P: 12.5) potentially reflecting deteriorating expectations amid tariff developments. New orders and shipments fell into contraction, while employment growth slowed to neutral. The workweek fell which could signal a cutback in hours worked ahead of a need to shed labor. Meanwhile, prices paid and received surged higher. Overall, the report had some troubling signs, but only reflects one regional survey.
The UST curve ultimately bear-steepened with 2y yields 3bp cheaper, and 30y yields 6bp cheaper, and yields across the curve closing near session highs. The steepening effect may have spilled over from European government bonds where front-end yields rallied following the perceived dovish implications from the ECB meeting. SOFR swap spreads tightened with 30y spreads ~1bp lower…
… Moving along TO a few other curated links from the intertubes, which I HOPE you’ll find useful …
Awaiting any sort of major trade deal / breakthru (impacting the oncoming recession noted by HIMCOabove, a reminder …
April 18, 2025 Apollo: US Makes Up Only 14% of Chinese Exports
The share of Chinese exports going to the US has declined from 20% to 14% since 2017, see chart below.
With China’s market share in the US declining, the economies that have gained market share in the US include Vietnam, Taiwan, Mexico, India, and South Korea, and studies show (see here and here) that about two percentage points of the rise in the market share of other regions is because of an increase in China’s share of their goods imports.
In other words, some exports from China to the US may be rerouted elsewhere or used as input in production in other areas.
The bottom line is that more than 80% of exports from China end up in other places than the US.
It should also be noted that de minimis exports from China to the US (direct shipments to US consumers with a value less than $800) are around $20 billion, much less than the $500 billion in total goods exports from China to the US seen in the chart below.
This next one cannot be good for ‘risk’ assets (or USTs as the portfolio hedge) …
April 18, 2025 at 3:08 PM UTC Bloomberg: Trump Studying Whether Removing Powell Is Option, Hassett Says
Donald Trump is studying whether he’s able to fire Federal Reserve Chairman Jerome Powell, his top economist said Friday, a day after the president publicly criticized the head of the central bank for not moving fast enough to slash interest rates.
“The president and his team will continue to study that,” National Economic Council Director Kevin Hassett said Friday when asked by a reporter if removing Powell was an option.
Hassett went on to suggest that the Fed under Powell, who was appointed by Trump during his first term, had acted politically to benefit Democrats…
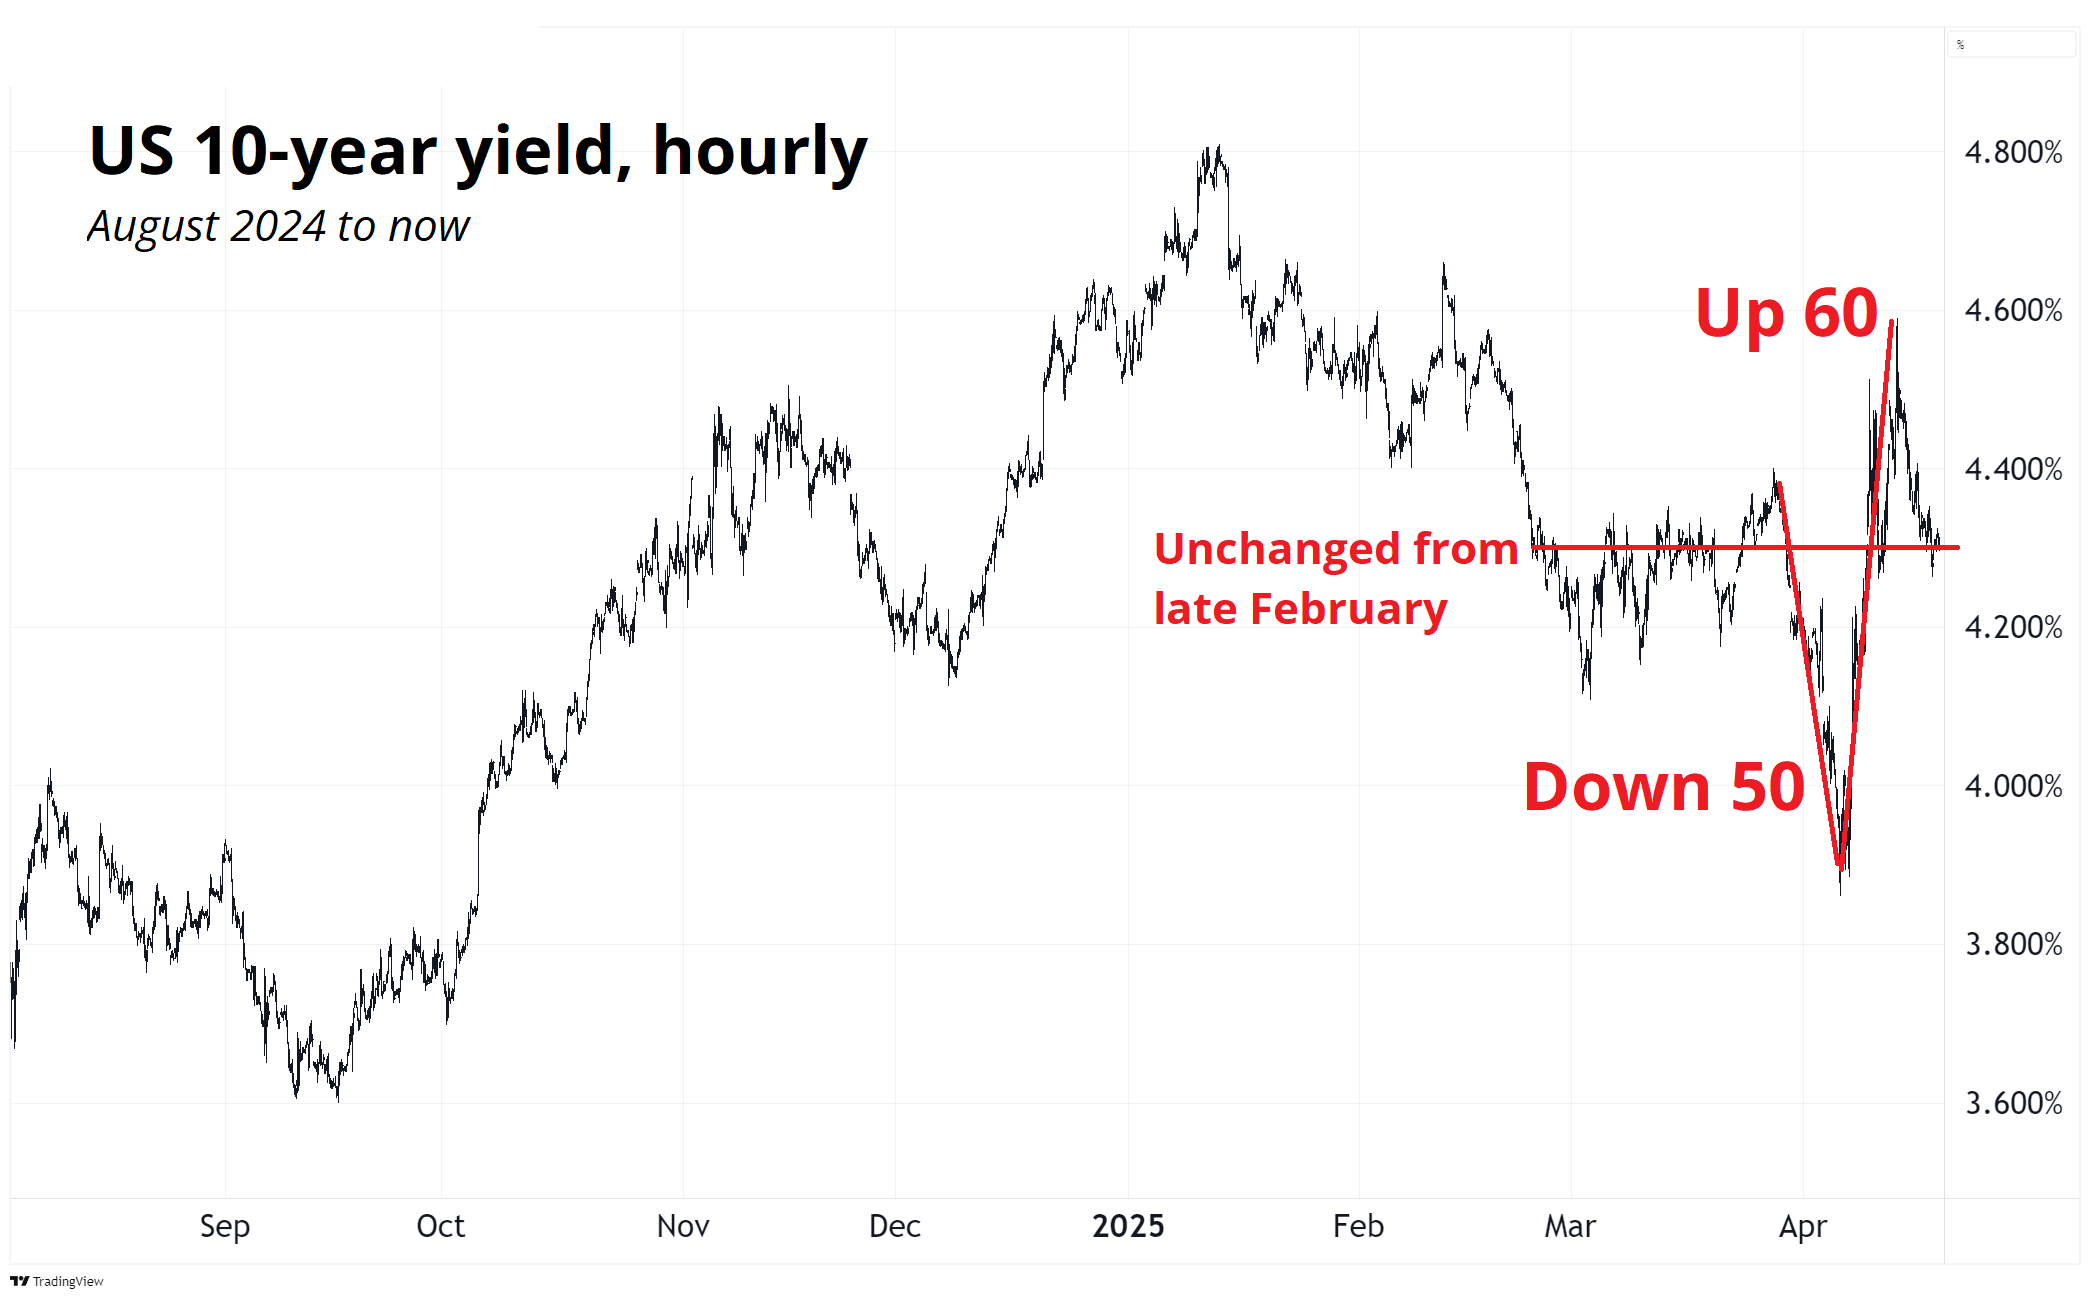
… a Friday speedrun through mtks (excerpt on HOURLY 10s) …
April 18, 2025 SPECTRA MARKETS: Kiss of Death Normally, you want to buy whatever assets the government tells you to buy. This time is different.
…Interest Rates The US bond vigilante trade was hot last week and has cooled off, as The Economist trumpets the story, and a media flurry goes viral. The question now is whether the rip from 3.90% to 4.50% in 10-year yields was a one off and meaningless reversal of a meaningless drop after Liberation Day, or something more nefarious. The breathless reports citing the largest 1-week move higher in yields since 2001 fail to mention that yields went down almost as much right beforehand and currently trade at the same levels as they did in late February.
Then again, these unchanged yields come after an 11.4% drop in SPX, so that’s not totally normal. To get a sense of how abnormal it is, I looked at all the 6-week drops in SPX of 10.5% and 12.5% and then looked at the 6-week change in US 10-year yields. Here’s the chart.
So, you can see this recent action is a bit odd, and when you add the fact that the USD sold off in the same period, it’s even more strange…
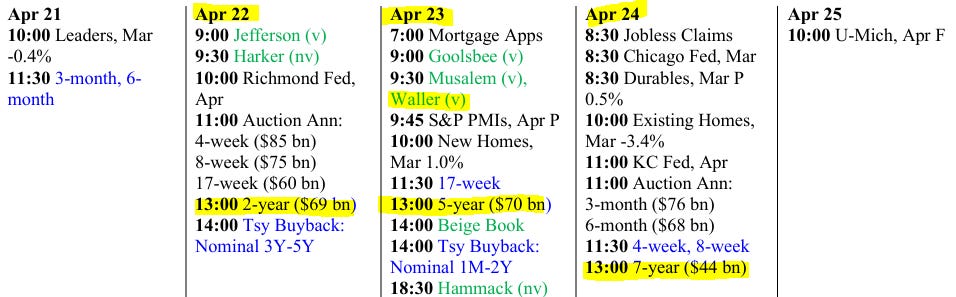
… AND for any / all (still)interested in trying to plan your trades and trade your plans in / around FUNduhMENTALs, here are a couple economic calendars and LINKS I used when I was closer to and IN ‘the game’.
First, this from the best in the strategy biz is a LINKthru TO this calendar,


Thanks for the shout! ... Love your stuff .. read it religiously
bd