30yy DAILY: support up near 5.00, 5.02, 5.15 while resistance down near 4.84
… momentum suggest bonds becoming oversold (seen this movie before)
… and with headlines like these …
Bloomberg: Germany’s 30-Year Borrowing Costs Climb to Highest Since 2023 Bloomberg: Japanese Bonds Tumble as Fiscal Worries Mount Before Election Bloomberg: BOJ Is Said Likely to Consider Raising Inflation Forecast
… it’s easy to see why fiscal follies here, there and everywhere continue to weigh on long bond prices.
Looking at the belly — 5s — there remains some ‘hope’ in the form of a TLINE HOLDING so I thought I’d share cuz, you know … sharing is caring …
5yy DAILY: 4.00 support …
… momentum leaking up into overSOLD territory as yields approach bullish TLINE support (4.00%) …
… Looking at 5s vs 4% and I’m thinkin …
… it’s gotta hold.
Moving along and since we’re STILL WAITING for latest from HIMCO to drop …
… and it is a Monday FUNday, might as well make use of our time here together…
Saw a story over the weekend (after reading through inbox and sending out this weekends missive, with an updated view of long bonds) and it speaks TO the 60/40 portfolio. Hope some of my former clients and all my friends — old and new — enjoy and take something from this well done note …
Jul 11, 2025 Morningstar: The 60/40 Portfolio: A 150-Year Markets Stress Test
…Between the bond market’s dismal 2022 and the stock market’s downturn from the inception of the Russia-Ukraine war, the 2020s were the only market crash of the past 150 years when the decline experienced by a 60/40 portfolio was more painful than the decline experienced by an all-equity portfolio.
Earlier this year, we demonstrated a key lesson from the past 150 years of stock market crashes: Though we can guarantee that there will be bear markets in our future—on average, about one a decade—the stock market will always recover and go on to new highs.
But what happens to an investor’s portfolio if one of those bear markets begins at a terrible time—like just as an investor is approaching her intended retirement date? Or if she’s faced with the worst bond market in history?
To evaluate the power of diversification in staving off the losses of a market crash, we took a look at the same period through the lens of the 60/40 portfolio. Here’s what we found:
As with the stock market, it’s impossible to predict how long it will take for the bond market or a 60/40 portfolio to recover from a downturn.
The upside potential of a 60/40 portfolio is a lot less than that of an all-equities portfolio, but the depth of inevitable market downturns will be much less.
Here’s what the past 150 years look like for the 60/40 portfolio….
…150 Years of Market Crashes Through the Lens of the 60/40 Portfolio
There have been 19 bear markets for stocks and three bear markets for bonds over the past 150 years—that is, periods in which these investments’ value has declined by 20% or more. This has translated into 11 bear markets for a 60/40 portfolio.
Our stock market analysis uses data that former Morningstar director of research Paul Kaplan compiled for the book Insights into the Global Financial Crisis. (Note: This data includes monthly returns going back to January 1886 and annual returns for the period from 1871-85.) Our historical bond market analysis uses data that economist Robert Shiller compiled for his book Market Volatility, which is derived using an equivalent of the 10-year government-bond yield…
…The Pain of Stock Market Crashes vs. the Pain of Crashes in the 60/40 Portfolio
So, how severe were these market crashes?
To assess the level of pain experienced in each market crash, we use a framework Kaplan calls the “pain index.” This framework considers both the depth of each market decline, as well as how long it took to get back to the prior level of cumulative value. And to gauge the severity of these downturns, we measure the volume of the “lake” that one creates.
The table below shows how all stock market declines and 60/40 portfolio declines of the past 150 years compare with the worst downturn since 1870—the stock market crash of the Great Depression.
That is, the stock market crash during the Great Depression has a “pain relative to worst historical loss” of 100%. And during this same period, a 60/40 portfolio only has a “pain relative to worst historical loss” of 23%. So because the 60/40 portfolio declined 53% versus the stock market’s 79% (and because it recovered to its previous high so much faster), investors who held the 60/40 portfolio only experienced about a fourth of the pain that those who held all stocks did.
The table below lists the bear markets of the past 150 years, sorted by the severity of pain…
…As you can see, the 60/40 portfolio experienced less pain than the stock market during nearly every market crash of the past 150 years.
The Great Depression was 4 times more painful for the stock market than for a 60/40 portfolio. The Lost Decade, the longest period on this chart, was more than 7 times as painful for the stock market. And the covid-driven stock market crash of March 2020 barely even registered for the 60/40 portfolio (which clocked only an 8.5% decline). In aggregate, a 60/40 portfolio experienced 45% less pain than an all-equities portfolio during the stock market crashes of the past 150 years.
Interestingly, there was only one period that saw more pain for the 60/40 portfolio than for the stock market—the period we’re in now…
… hence why increasing calls for the death of the 60/40 … I don’t want to put any words in authors mouths but said another way …
I’ve said it before and I’ll say it again. Diversification via USTs as an integral part of 60/40 portfolio continues to make sense and days like we’ve had in the past week are a reminder… The BondBeat Dec 1, 2021
… HEREis what this shop says be behind the price action overnight…
… WHILE YOU SLEPT USTs retain a modest bear-steepening bias amid Summer trading conditions dominated by a flurry of weekend headlines (EU/Mexico tariffs, Japan Election and Fed independence challenges). USTs were broadly unchanged in the front-end and belly in APAC, while the long end drifted modestly lower alongside the weakness in JGBS (20y +10bps). Our desk in LDN reported better selling of spreads on the London open from dealers on the back of better receiving flows. Fast has generally been a payer of curve in 2s10s or 5s30s, but some flattening interest has arrived as we approach the NYC open. SPX futures are -0.3%, DAX -0.7%, CAC40 -0.5% with Crude Oil +1.5%. DXY is flat alongside a slight softening in USDJPY -0.1%, with Gold +0.5% here at 6:45am.
… for somewhat MORE of the news you might be able to use … a few more curated links for your dining and dancing pleasure …
NEWSQUAWK US Market Open: ES -0.3%, FX and Fixed markets contained after Trump announced 30% tariff on EU and Mexico … USTs are contained. The bias from JGBs was a softer one after better-than-expected Machinery Orders data. USTs themselves in a thin 110-23+ to 110-28 band, entirely within but towards the trough of Friday's 110-22+ to 111-08 range. Newsflow has been focussed almost entirely on trade, after Trump delivered his EU letter, with European officials since indicating a desire to work towards a better outcome but outlining that countermeasures are being prepared. The relatively muted nature of moves thus far indicates that markets do not see the 30% tariff level as the likely end point and instead regard it as a negotiating tactic.
Finviz (for everything else I might have overlooked …)
Moving from some of the news to some of THE VIEWS you might be able to use… here’s some of what Global Wall St is sayin’ …
Sponsor of Wimbledon (great final yest) offering some thoughts on China …
14 July 2025 Barclays China: Decent June exports; signs of H2 slowdown
The pickup in June exports was driven by a rebound in shipments to the US (amid the trade truce) and continued transshipments via Asean. However, high-frequency shipping data show some slowdown in July, especially for US-bound exports. The US agreement with Vietnam will hit China's transshipments.
June: 5.8% y/y for exports, and 1.1% y/y for imports (both in USD terms)
Bloomberg consensus (Barclays): 5.0% y/y (5.5%) for exports, and 0.3% y/y (-1%) for imports
May: 4.8% y/y for exports, and -3.4% y/y for imports (both in USD terms)
A rather large French bank with some Sunday FUNday musings …
With markets relatively unperturbed by last week’s flurry of tariff ‘letters’, the focus is likely to shift to the impact of tariff rises on economic data. On Tuesday, we expect June’s US CPI data to provide further evidence of tariff pass-through into prices.
Although we think the effect is likely to be larger from July onwards, this should strengthen the case for the Fed to keep rates on hold. Meanwhile, differences in the new tariff levels between countries suggest downside risks for FX and front-end rates in some EMs.
In Europe, as well as ongoing trade negotiations, we expect focus on fiscal developments. French Prime Minster Bayrou is kicking off budget talks early, while the EU Commission is set to unveil its own budget plans including a push for a joint borrowing instrument.
While investor concern about French fiscal risk could resurface heading into September, we see the case for long summer carry spread trades.
Last year, the late-July/early August period set the stage for the worst market turmoil of 2024. This year, that week looks seriously problematic again from a market perspective.
First, there’s the new August 1 tariff deadline. Markets are clearly not pricing in these higher tariffs, and we may only know the outcome in the final hours, offering the potential for a sharp market reaction and heightened volatility.
Second, it’s the US jobs report that same day, and last year demonstrated that even a modest downside surprise can cause a big selloff, if investors are already jittery.
Third, long-end bond yields are going into this period at higher levels today, meaning it would take less of a jump before we move into problematic territory that re-ignites fears around fiscal policy.
This means the market narrative could suddenly shift in a more negative direction. If the tariffs snap back higher on August 1, and we then get an underwhelming jobs report, that would easily resurrect fears around a US recession. This playbook happened last year when the ISM manufacturing fell beneath every forecast on Bloomberg, and then an unexpected jump in the unemployment rate breached the Sahm recession indicator, which quickly led to mounting fears about a US slowdown. So it doesn’t require weeks of buildup, and it’s not difficult to draw a picture of how this could happen in the space of 48 hours.
Same shop (and the source of the “What IF?” over weekend suggesting JPOW OUT adds 30-40bps to 10s) …
14 July 2025 DB CoTD: An alternative debt scenario
…Recently, the CBO published a report exploring alternative scenarios to their baseline. They found that if productivity growth were just half a percentage point faster per year than their base case, the debt trajectory would be dramatically different: es sentially flat over the coming decades. This analysis predates the latest tax bill, so assumptions may need to be revised slightly higher—but even so, it was enough to make me say “WOW.”
Under this higher-productivity scenario:
Debt rises slowly until the 2040s, then stabilises.
The US runs a primary surplus by 2049 —that is, a surplus excluding interest payments.
GNP per capita is 17% higher than the baseline by 2055.
The average interest rate on federal debt is 0.5pp higher by 2055, reflecting stronger growth.
With the rise of AI, this faster productivity path is plausible. That said, if such growth materialises, it may simply encourage policymakers to continue with fiscal giveaways—so debt could still rise. There are many moving parts, but this scenario offers a potential positive pathway.
For balance, the CBO also notes that if productivity growth is half a point slower, debt could surge to over 200% of GDP by 2055.
That’s a massive bid-offer spread —and a clear reminder of how sensitive debt projections are to underlying assumptions…
AND another manic Monday driven by tariffs and so, Global Wall’s happy cuz they have something to yap ‘bout here in these dog days of summer …
13 July 2025 ING: US increases pressure on trade negotiations in a make it or break it moment
The US hits the EU and Mexico with 30% tariffs starting 1 August – despite speculation of an imminent trade deal with the former. With retaliation delayed and talks ongoing, the next three weeks will be crucial. But even a deal may not bring lasting certainty to global trade
Taking the summer off? Permanently be directed to ‘the beach’? Maybe. Perhaps only the shadow knows …
July 13, 2025 MS Sunday Start | What's Next in Global Macro: Shadows in Late Summer?
The notion of a “Shadow Fed Chair” stirs discussions. Recent headlines on renewed criticism of Chair Powell fuel speculation over who the next Fed Chair will be and when the name will be released. How should investors think about the issue?
President Trump has been consistent in messaging a desire for the Fed to cut rates more. The market pricing, however, implies a rate of just over 3% at the end of next year. Through the end of Chair Powell’s term, as we have said before, we don’t see an immediate change in the Fed reaction function. We have said that Committee dynamics will likely limit any changes, for at least a while beyond June. Perhaps that is why investors do not seem convinced of a big shift in policy, even after Powell’s term as Chair is up. Might that pricing change if there is a “Shadow Fed Chair” before Powell’s departure?
Because the Chair of the Federal Reserve Board also needs to be a member of the Board, the vacancy on the Board in January could easily go to the successor, while waiting for the Chair seat to open up. Perhaps a “Shadow Chair” that is on the FOMC would move markets more? News reports suggest a successor could be named as soon as later this summer, but the same Committee dynamics are reason to suspect the status quo could last. Indeed, a purely hypothetical wrinkle is that Powell’s seat on the Board of Governors does not expire when his Chair tenure does; in principle, he could stay on as a member, just as Michael Barr remained on the Board after stepping down as Vice Chair for Supervision and Regulation. Chair Powell has avoided any such discussion, so we have a thought experiment, nothing more.
That possibility, in turn, raises another institutional quirk. The FOMC is technically a distinct agency from the Federal Reserve Board, and the Chair of the FOMC is only the Chair of the Board of Governors by convention, not law. Another thought experiment is that the FOMC is not obliged to pick the Chair of the Board to be Chair of the FOMC. Of course, such an outcome would be highly unusual, particularly for an institution that has historically been very orthodox.
Those technicalities aside, there remains the discussion of whether the market might start to react to a “Shadow Chair” who is very vocal. An argument against that outcome is that market pricing may rather reflect history, where political appointees tend to shed past allegiances and work toward the institution’s legislative mandate of maximum sustainable employment and stable prices after taking office.
None of which is to say the Chair doesn’t matter. While the FOMC votes at each meeting, limiting the Chair’s ability to diverge dramatically, there is always wiggle room. Noisy data always present judgment calls, and the Chair is the leader. Moreover, as time goes on, turnover on the Board allows new appointees to have larger and larger sway over the Committee. Ultimately, even the choice of Reserve Bank Presidents is subject to a veto by the Board, giving influence over the entire FOMC.
For now, the “Shadow Chair” debate is nuanced and probably secondary. I do not think the reaction function of the FOMC will change notably between now and May. Over time, however, the range of outcomes grows notably. Until Powell’s term is up, though, the bigger risk to our Fed forecast is our economic forecast ... where we remain quite humble…
Ever wonder why the economy matters to the markets? Me too …
We explain the divergence between our economic outlook and our strategists' views on the US equity market.
We get that not everyone is as interested in economics as we are, but investors care because the economy helps to drive the market. But it is critical to remember that the economy is not the market, and the stock market is not the economy. That fact is particularly true now, and current policies can exaggerate this differential. For example, not only can policies affect different companies differently, they need not have a material implication for GDP. Similarly, the moves in the dollar will affect some companies more than others, but the S&P 500 as a whole is much more exposed to overseas profits than the 12% export share of GDP. Right now, we are forecasting a substantial slowdown in the US and global economy, while the equity market has remained resilient, and our colleagues remain constructive. Let’s look under the hood.
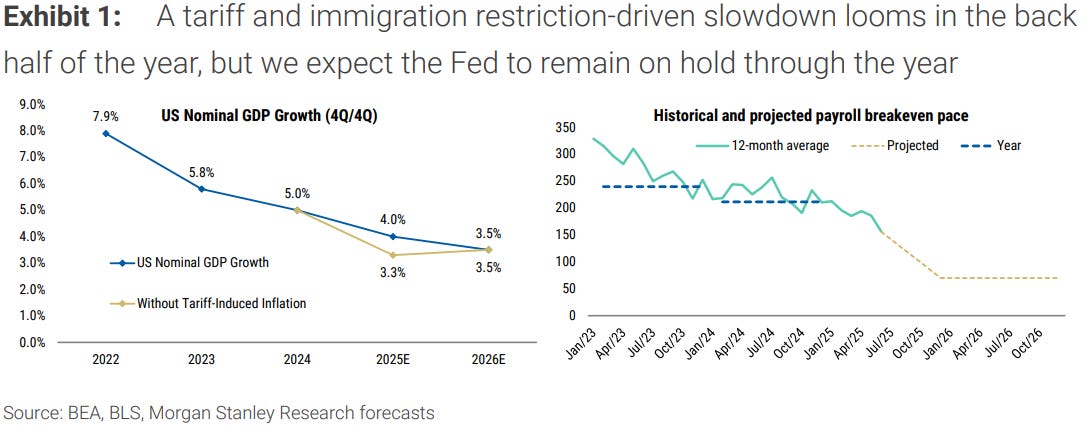
We see a pickup in inflation over the next couple of months as tariff costs begin to show through to consumer prices. Historically, there has been a lag of about 3-4 months from tariffs to CPI, though the front-loading of imports in the first quarter could muddy the waters. Against that backdrop, we are looking for a subsequent slowdown in the US economy in the second half, as tariffs and immigration restrictions play out. The last nonfarm payrolls report suggested a cooling in the labor market, but no collapse. As payrolls soften, we expect a less-than-proportional rise in the unemployment rate; immigration restriction is slowing labor supply growth, consistent with the last NFP. These factors should keep the Fed on hold for longer than the market expects. These headwinds are still ahead of us, so is there work to be done to reconcile the near-term economic risks with the longer-term S&P target?
Our equity strategy team’s target for the S&P is 6500, one year forward, and comprises earnings near $300 per share—about 10% growth—on a multiple of 21.5x. One part of the resolution of the apparent tension is that our equity strategists expect increased volatility later this summer. Another key thought is that earnings growth is inherently nominal, and our economic slowdown is more notable for real GDP. There remains a gap between our 4% nominal GDP growth forecast and the earnings forecast, but while earnings and nominal GDP growth are correlated, Exhibit 2 shows, the deviations can be persistent.
Other drivers of the divergence between earnings growth and nominal GDP growth are tied to the dollar move, regulatory policy, and fiscal policy. The equity market is much more exposed to the rest of the world than the economy as a whole. To date, the dollar has fallen close to 10% and our house view is for another 10% decline or so. That dramatic shift implies a greater wedge between the economy and market. For fiscal policy, the economic literature is fairly clear that aggregate demand rather than tax treatment is the main driver of investment spending, but the recently passed tax provisions are very likely to help cash flow for many firms. Similarly, we see deregulation as important for the bottom line but not so much for the top line. The recent move to lower the SLR is a great example – we do not expect a boost to GDP, but bank earnings should be well supported.
Finally, after inflation has peaked and begins to recede, against a backdrop of a very weak labor market, we look for the Fed to start cutting rates. Our strategy colleagues see that fact as supporting multiples, a phenomenon that standard macroeconomics is not well equipped to weigh in on. Looking forward, as the market tends to do, productivity gains from AI are on the horizon, and the market can easily price such gains before they show up in the GDP data. The market is not the economy, the economy is not the market.
For somewhat more on the teams 6500 S&P target …
July 14, 2025 MS US Equity Strategy: Weekly Warm-up: Equity Market Impacts from Tariffs and Tax
Equities have been resilient despite new tariff announcements. For stocks, potential trade-related risks would center more around China, the USMCA exemption and Section 232 tariffs vs. what's recently been announced. The new tax bill is constructive for large cap indices as are strong EPS revisions.
Why Has the Equity Market Been Resilient in the Face of New Tariff Announcements? We think there's a few reasons for this up to this point: (1) import cost exposure for S&P 500 industries is more limited thus far given the combination of the countries in scope and the exemptions seemingly still in place (i.e., USMCA-compliant imports from Mexico, though we're still awaiting more clarity here); (2) the higher tariff rates recently announced on several trading partners are generally not perceived by market participants to be the final rates as negotiations continue; and (3) tariff-sensitive equities, particularly in the consumer goods space, have already experienced significant (25%+) drawdowns…
…Key Equity Market Impacts from the "One Big Beautiful Bill"…Net-net, the new tax bill is supportive of large cap equity indices. Given reinstated and expanded expensing, we believe the "cash" (economic) tax rate will likely now test prior lows (13%, down from 20% currently), which is a positive for cash flow. The upfront R&D expensing and bonus depreciation aspects of the bill are most impactful from this perspective. The former benefits companies in Tech, Communication Services and Healthcare, in particular. The latter is a tailwind for capital intensive industries—Aerospace and Defense, Telecom, Technology, Energy, and Multi-Industry/Capital Goods. The Foreign-Derived Intangible Income incentive also benefits large cap indices given higher foreign sales exposure. As trade negotiations progress, there's also the potential for US corporates to face lower Digital Services Taxes.
… finally, a couple from Dr. Bond Vigilante …
Jul 13, 2025 Yardeni: MARKET CALL: Trump's Reign Of Tariffs Ain't Over
It’s July. Back in March, we expected that Trump’s Tariff Turmoil (TTT) would become less tumultuous by the end of the summer. We figured that President Donald Trump would start to declare victory in his trade war with the world. We figured he would start to move on to other issues to reduce the risk that his trade war would cause a recession in the US. The political calendar shows that the congressional mid-term election campaigns will be starting in the not-too-distant future. Trump needs a good economy to increase the odds that the Republicans will hold onto their thin majorities in the House and the Senate come November 2026.
In fact, the economy is in very good shape right now. The labor market is at full employment given that the unemployment rate is 4.1%, and CPI inflation, excluding the slow-motion decline in rent inflation, is below 2.0% y/y (Fig. 1 below and Fig. 2 below). The Misery Index, which is the sum of the unemployment rate and the headline CPI inflation rate, is at 6.6%, well below its average over time of 9.0% (Fig. 3 below)…
This will be a jampacked week for economic indicators and big banks' Q2 earnings reports. We are relatively optimistic about the latter, which should be bullish for the stock market. The inflation news may show some signs of tariff-related warming. Consumer-related data are likely to be be mixed. The White House will probably keep tariffs and the Fed in the news on a daily basis. On balance, we expect the stock market to be choppy over the remainder of the summer into early fall before a yearend rally. The stock market's V-shaped pattern during H1 should look more like a square-root sign in coming months.
Consider the following:
…(2) CPI and PPI. So far, the impact of Trump's tariffs has been difficult to spot in hard inflation data. That may be about to change, albeit modestly with June's CPI report (Tue). The Cleveland Fed's Inflation Nowcasting is showing a 3.0% y/y increase in this inflation rate, up from 2.8% in May (chart). June's PPI report (Wed) might confirm that the downward trend in inflation has been interrupted at least on a transitory basis by Trump's tariffs. That may be enough to keep the Fed on hold.
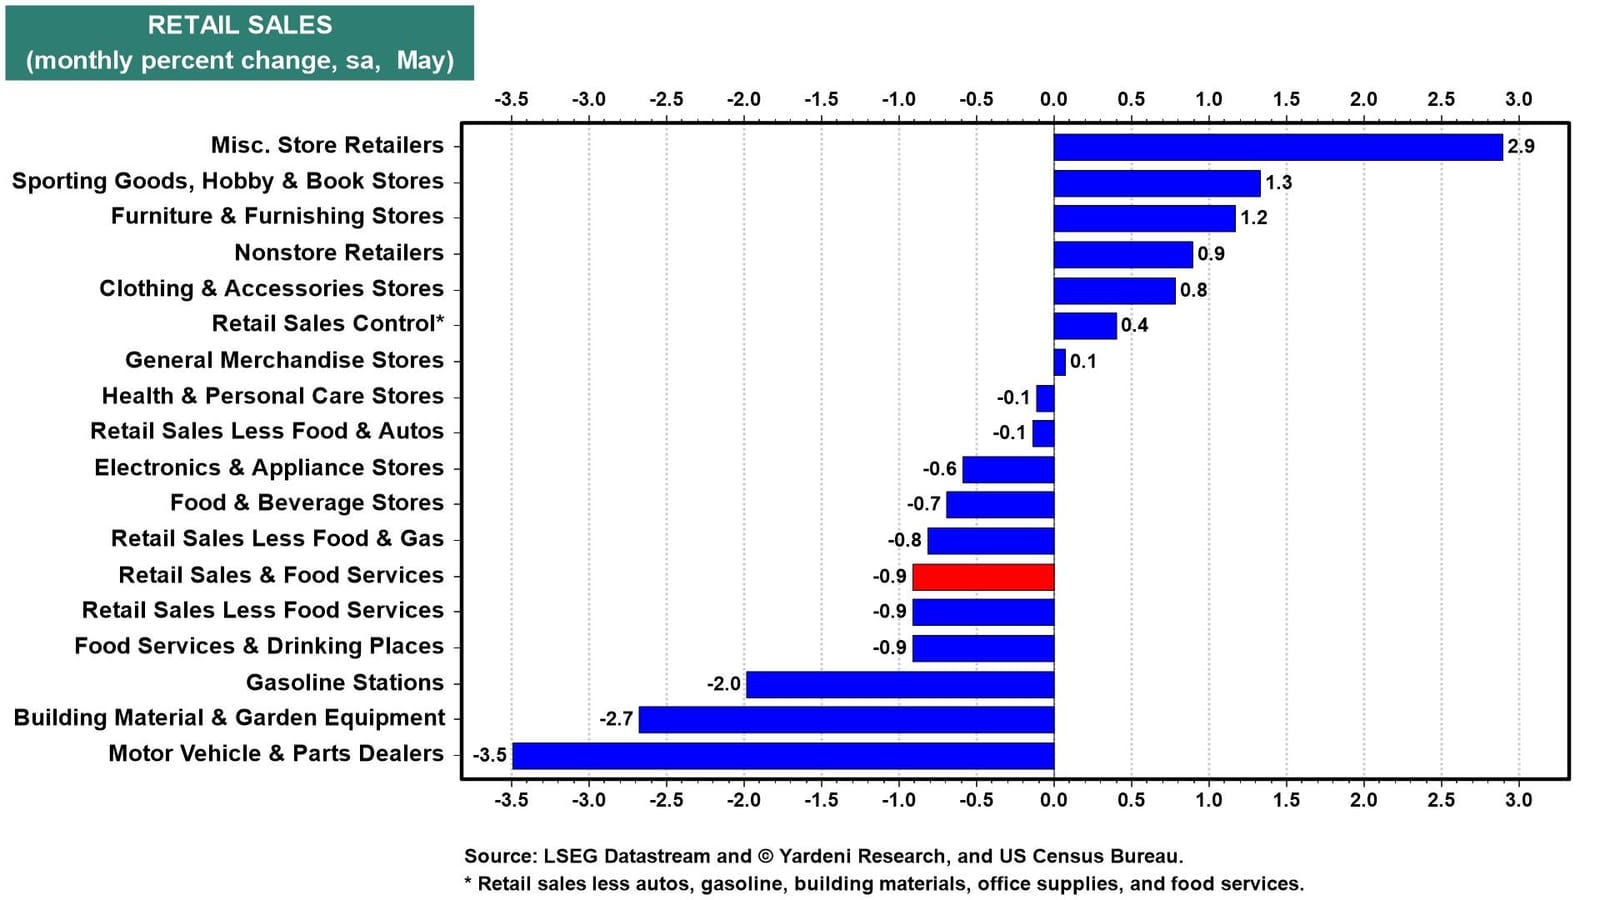
(3) Retail sales. The sizable 0.9% drop in retail sales in May, the first back-to-back monthly decline since the end of 2023, was offset by the month's "core group," which was up 0.4% (chart). June's retail sales report (Thu) could also be a mixed bag, with auto sales weak again and a small increase in the control group. Our Earned Income Proxy for private industry wages and salaries in personal income was flat last month.
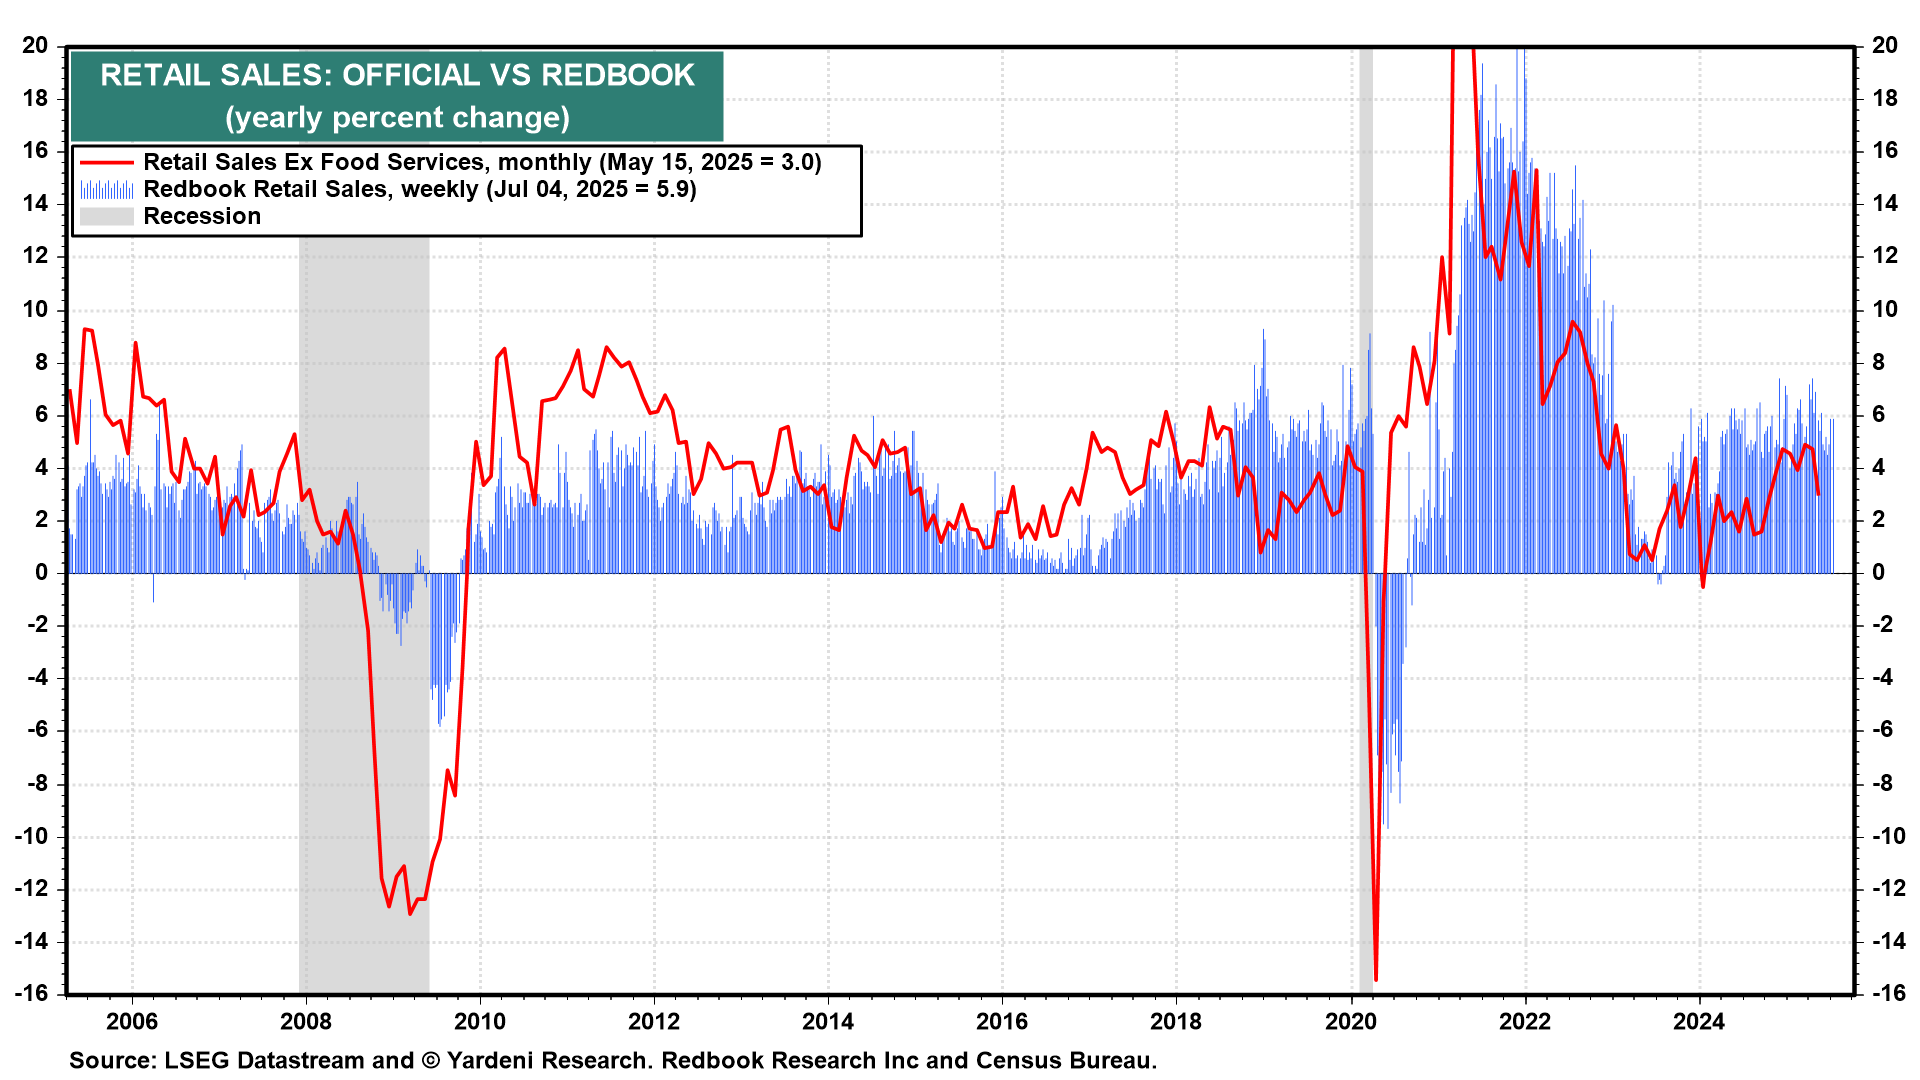
Anticipation of Amazon's Prime Day, the annual deal event on July 8-11, might have reduced online shopping last month. However, there's no sign of that happening in the weekly Redbook retail sales series, which remains robust (chart). That's consistent with the low readings for weekly initial unemployment claims (Thu).
…(5) Fed fight. A number of Fed officials will have their chance at publicly parsing this week's economic indicators. Among top Fed policymakers giving speeches are: Governors Michelle Bowman (Tue), Michael Barr (Tue and Wed), Adriana Kugler (Thu), and Christopher Waller (Thu). It will be interesting to see whether any of them takes sides in the Great Fed Fight between Trump and Fed Chair Jerome Powell. The President has been attacking Powell almost daily of late for not lowering interest rates.
Trump still wants Powell gone before his term as Fed chair expires in May 2026. Though the Supreme Court complicated his hopes to fire Powell, Trump World is getting quite creative about grounds for termination. Case in point: arguing that Powell mismanaged renovations at Fed headquarters and lied to Congress about the project.
… And from the Global Wall Street inbox TO the intertubes, a few curated links …
… A couple / few from The Terminal dot COM …
July 12, 2025 at 8:00 PM UTC Bloomberg: US Inflation to Pick Up on More Tariff Pass-Through
… Prices of goods and services, excluding volatile food and energy costs, rose 0.3% in June, the most in five months, according to a Bloomberg survey of economists. In May, the so-called core consumer price index edged up 0.1%.
The measure, regarded as a better indicator of underlying inflation, is seen accelerating on an annual basis for the first time since January. to 2.9%…
July 13, 2025 at 7:00 PM UTC Bloomberg: Bond Traders Cast Doubt on September Fed Cut Before Key CPI Data
…The CPI figures “could set the tone for the direction of the Fed and risk sentiment for the second half of the year,” said Zachary Griffiths, head of investment-grade and macroeconomic strategy at CreditSights.
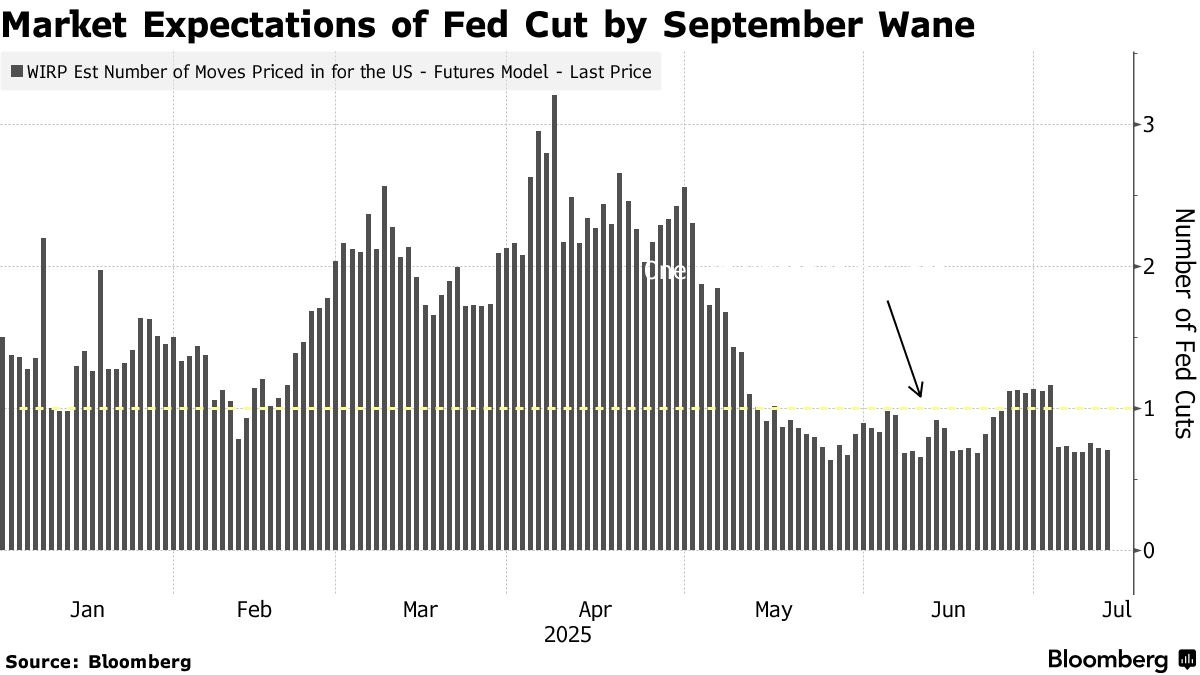
A batch of strong jobs figures in early July led traders to rule out a rate cut at the Fed’s gathering this month. They also now see about a 70% chance that officials ease at the central bank’s September meeting, whereas a reduction by then was viewed as a lock as recently as late June.
That backdrop raises the stakes for Tuesday’s release of the June consumer price index, which according to Barclays Plc strategists has averaged the biggest absolute surprise of any month in recent years.
Signs that price pressures are building amid President Donald Trump’s tariff rollout would risk raising further questions around a September cut, and may buoy those positioning for higher yields. Conversely, a tame report could re-energize wagers on near-term monetary easing.
“We should be able to see the effect of the tariff war” in the coming inflation reports, said Tracy Chen, a portfolio manager at Brandywine Global Investment Management. “I don’t see how the Fed can cut in September. The resilience of the job market and the frothy risk asset market do not justify the cut.” …
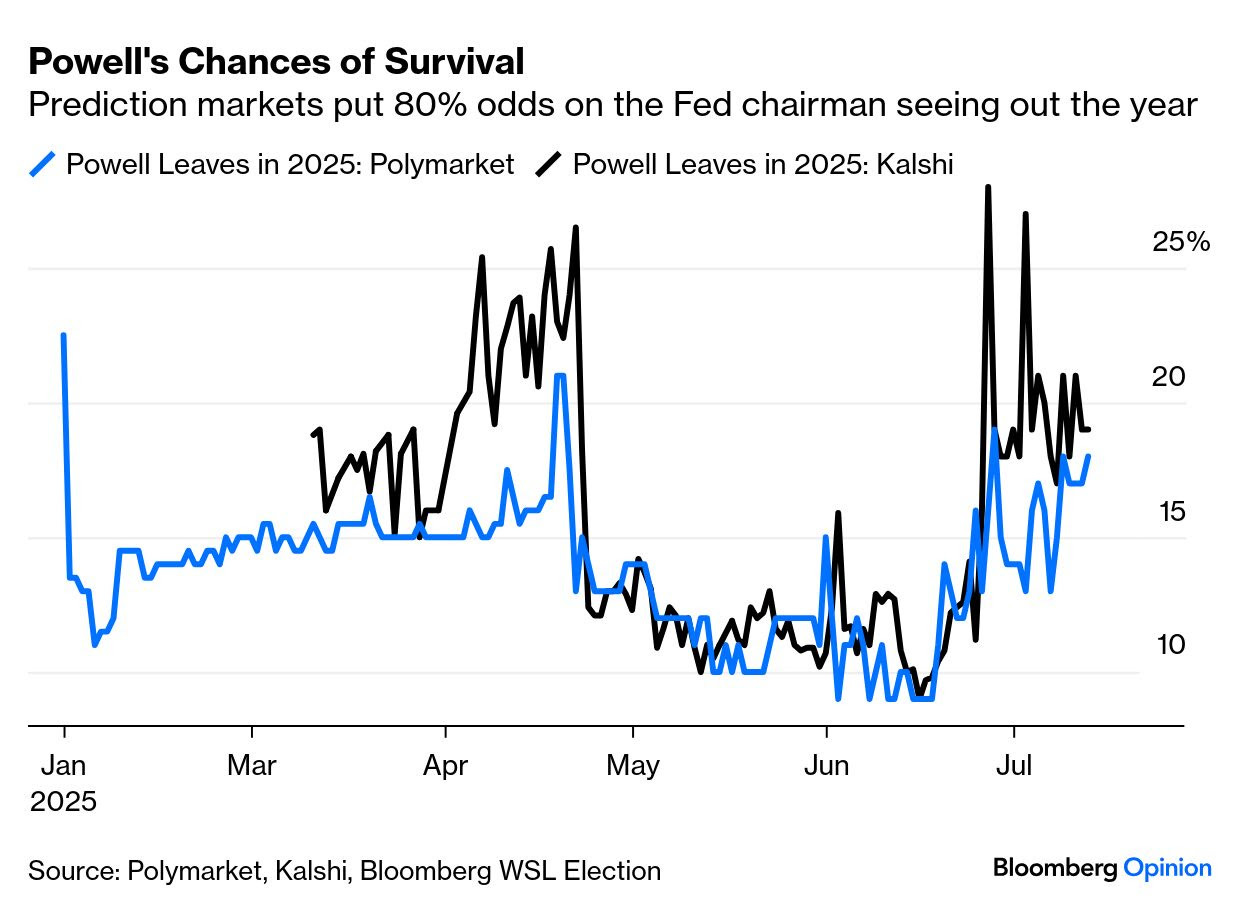
July 14, 2025 at 4:27 AM UTC Bloomberg: All the President's Men Are Coming After Powell Prediction markets still give the Fed chair strong odds of finishing out the year.
…Powell’s X-Factor Search for the word “Powell” on X, as Twitter is now known, and you will swiftly conclude that the chairman of the Federal Reserve is about to resign, before he’s fired. The financial markets, and even the prediction markets, still find this a remote possibility. Which should we take seriously?
Odds of a departure in 2025 spiked earlier this year on Polymarket and Kalshi when President Donald Trump made an explicit threat to fire Jerome Powell, and subsided a few days later once he said that he had “no intention” of doing so. The tremors of the last few days have left Powell’s chances of surviving the year at a little better than 80% on both sites:
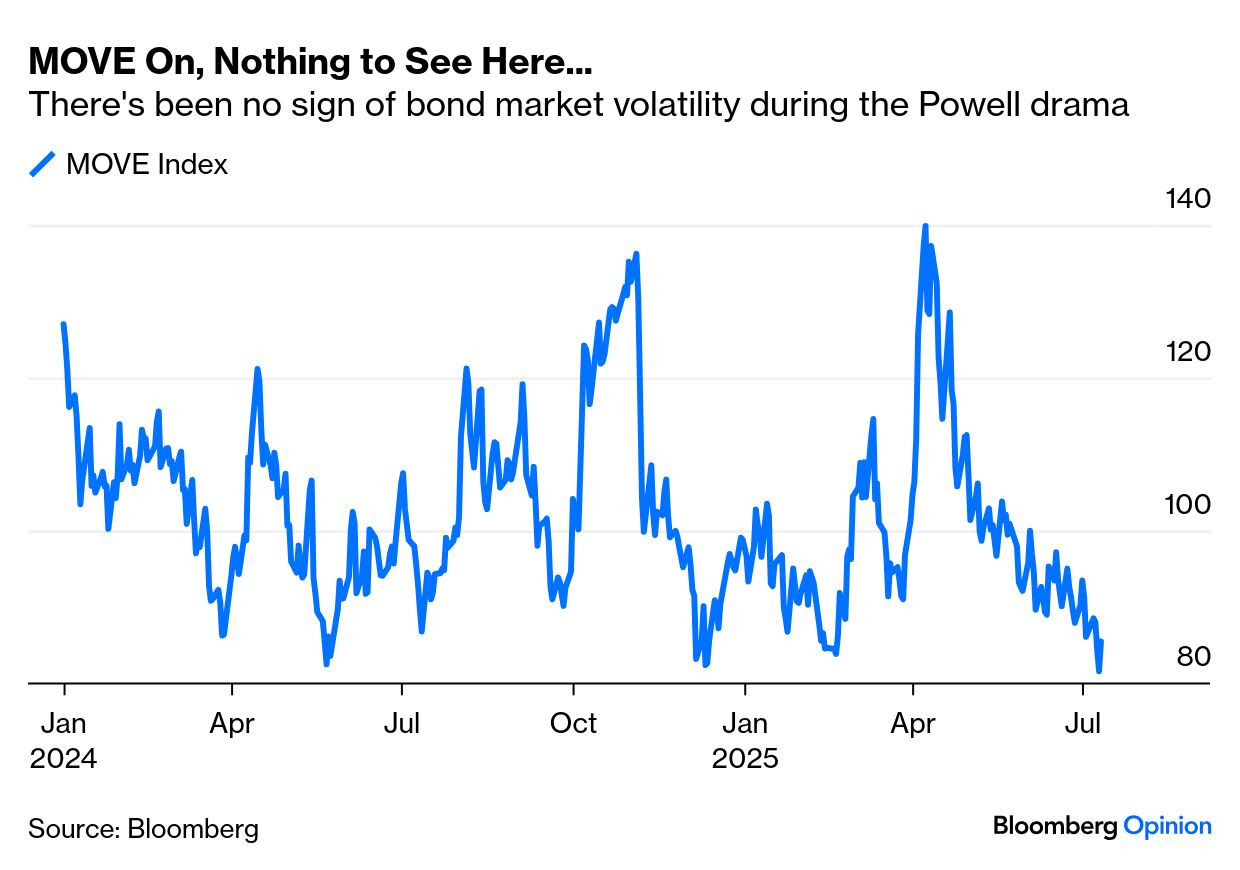
In more important financial markets, there’s no sign that the world’s most powerful central banker is about to lose his job. The MOVE index of bond market volatility spiked after the Liberation Day tariffs and the initial threat to fire Powell. It’s now at the bottom of its range:
The rates market also shows little concern. Powell is under fire for keeping rates too high. Any replacement will have to promise a more dovish monetary policy — and a number of well-qualified candidates did just that last week. But the futures market’s projected path of the fed funds rate has barely budged over the last two months. There is a Powell effect, as futures now see a significant easing after Powell’s last scheduled meeting as chairman in April — but it isn’t pricing in an early departure…
…A Powell exit would be a big shock. Saravelos suggests the DXY dollar index would fall “at least 3% to 4%” in the first 24 hours, while long Treasury yields rose 30 to 40 basis points — a combination usually seen in emerging market crises, and similar to April’s response to Liberation Day. These charts show what those predictions would entail. The 10-year yield would come back to challenge its 2023 high, while the dollar would drop to a four-year low. Big moves but not a paradigm shift:
…Ten-year yields back close to 5% are exactly what the administration doesn’t want, but exactly what it would deserve for a naked politicization of its central bank. Equities could be different. Longer yields would rise, but shorter term rates would fall with a new dove at the Fed. That should help equities in the short run, as this chart from Absolute Strategy Research makes clear:
Ian Harnett of Absolute Strategy suggests that the stock market would get through this, as all the potential replacement candidates are “more than credible.” In the short run, they would likely add liquidity when conditions are already very stimulative (even if the administration desperately wants lower rates).
There are further issues. Powell might resign as chairman but maintain his seat as governor for another two years. The Fed’s regional governors might take a strong line against any new attempt at dovishness. All of them have voted in line with Powell over the last year, and their response could be critical.
This remains a dumb risk that doesn’t need to be taken. Powell oversaw a terrible policy mistake in 2021, but at present he’s presiding over declining inflation and low unemployment. There’s little upside to getting rid of him, while the downside is cavernous. Investors can see this, which is presumably why this extreme risk isn’t being priced, but it’s not clear the president does…
Wolf on BONDS …
JUL 12 2025 WolfST: 30-Year Treasury Yield Jumps to 4.96% despite “Solid” Auction, Long End of Yield Curve Steepens, Mortgage-Rate Spread Historically Wide
The bond market’s reaction to the inflationary environment, to fears of a lax Fed, and to a Mississippi River of new debt.
The 30-year Treasury yield rose by 10 basis points on Friday to 4.96%, despite a 30-year Treasury auction on Thursday that was described as “solid” and “strong,” where the government sold $22 billion of 30-year bonds at a yield of 4.89%.
So far in July, the 30-year yield has risen by 18 basis points. It is now 63 basis points above the effective federal funds rate (EFFR), which the Fed targets with its monetary policy rates (blue in the chart).
This increase in yield came despite the government’s assurances that it would only slowly replenish its checking account, the Treasury General Account – which had been partially drained during the debt-ceiling period – by taking it easy on issuance of long-term notes and bonds, and by slowly increasing the issuance of short-term T-bills, all in order to defuse the pressures around long-term yields, while short-term yields are bookended by the Fed’s policy rates and expectations of those policy rates over the near term.
So, since the Fed cut by 100 basis points starting in September (dotted blue line), the 30-year yield (red line) has risen by 102 basis points!
The 30-year yield is a thermometer of the bond market’s current fears about:
Inflation over the long term
A lackadaisical Fed in face of this inflation
And a Mississippi River of new Treasury debt flowing into the market.
That the 30-year yield is back near 5% amid all these efforts to keep it from going there is quite something.
This reaction – rate cuts of 100 basis points lead to a 102-basis-point increase of the 30-year yield – raises the secret question: How many more rate cuts would it take to drive the 30-year yield to 6%?
Cutting policy rates in an inflationary environment has turned out to be a very tricky thing. Bessent may have had this type of conversation with Trump, but it likely went in one ear and out the other…
…For 30-year fixed mortgage rates, the 10-year yield and the spread matter.
The average 30-year fixed mortgage rate has been above 6% since September 2022 and has stuck fairly closely to either side of 7%.
In the latest reporting week, which does not yet include the rise of the Treasury yields over the past few days, the average 30-year fixed mortgage rate ticked up to 6.72%.
It didn’t drop to 5% until the Fed started QE, including buying trillions of dollars of MBS, from early 2009 on, which helped push down mortgage rates. But the consumer price inflation that broke out in 2021 put an end to it.
The spread between the average 30-year fixed mortgage rate and the 10-year yield has been fairly wide since the Fed ended QE and thereby stopped buying MBS, and then started QT in the second half of 2022, thereby starting to unload its MBS. It has by now unloaded over $600 billion of its MBS, and has said many times that it wants to get rid of its MBS entirely, and only hold Treasury securities on its balance sheet.
The spread between the weekly average 30-year mortgage rate and the weekly average 10-year Treasury yield was 2.34 percentage points. Over the past four decades, that happened only four times, twice very briefly just before and at the end of the Dotcom Bust, and twice during two panics, when the 10-year yield plunged amid massive QE, and mortgage rates were slower to follow. Now there is no panic, the 10-year yield is near 4.5%, and the Fed is doing QT..
Given tariffs continue to be one of main drivers of markets in these dog days of summer, here’s one I think ALL ‘Merica can get behind …
… 200% on golf courses? Thoughts? AND … THAT is all for now. Off to the day job…


