Good morning … ahead of NFP there’s very little insights I have to offer … and so, I’m not going to try, certainly not as hard as ZH notes a specific trader appears to be trying — see full ZH hit just below where THIS GUY is trying,
The breakeven for the trade at expiry is a yield level of approximately 4.2%, so it is only profitable if the Fed cuts below this level.
As Bolingbroke explains, the $80 million SOFR bet was placed via a December 2023 SOFR call spread, where the owner of the position is long one strike equivalent to a 4.5% yield and short a higher strike equivalent to a 2.5% yield, where the maximum profit would be reached…
More below … For NOW, here is a snapshot OF USTs as of 706a:
… HEREis what another shop says be behind the price action overnight…
… WHILE YOU SLEPT Treasuries are modestly higher and the 5s30s curve steeper (+1.25bp) ahead of NFP and ISM. Services PMI data out of China and Japan scored upside beats overnight while we've tried to capture other overnight developments in our news links above. DXY is modestly lower (-0.13%) while front WTI futures are UNCHD to start the day. Asian stocks were mixed (China lower, others modestly higher), Eu and UK share markets are mixed-to-lower while ES futures are showing -0.6% here at 7:10am. Our overnight US rates activity saw a firm start in Asian hours with the desk reporting better long-end buying (even as our volume sheets showed highest turnover in intermediates). Prices came off the boil after the London crossover as EGB's and Gilts retraced some of yesterday's sharp gains. Overnight Treasury volume was about average overall with my sheet showing 3's (160% of ave) as the turnover leader among benchmarks overnight.
… questions asking what next resistance is for Treasury 10yrs. Our next attachment takes a look at the daily chart of Treasury 10yrs. As you can see, 10yr yields remain below their former bear channel/trend, a nice positive after this week's rally. But 10yr yields remain just above their move low in January (~3.32%) so we still expect resistance there after the level was swiftly rejected on the 19th. Below that Jan low, things may get interesting as a consequence of the straight-shot sell-off from August 2nd last year. It only took 10's ~7 weeks (or less) to move up from the 2.51% area to today's yield and there's that old saw that markets can retrace as fast as the move that preceded it. I use congestion levels, well-defined (3 points or more) trendlines, range highs and lows, former move highs and lows... to set my support and resistance levels. Others weave in moving averages and Fibonacci numbers to find things in between; I don't believe in them or follow them, as you may know. I just care about where barriers of supply or demand have shown up in the past whilst assuming these barriers will show up a second time, until taken out. The point is, below last month's 3.32% rate move low in 10's, this observer sees no resistance for 10's until 2.515%. It sounds so far away for brains inured by 4%-handle benchmarks but, again, it was basically a straight shot rise from there to here during a small brace of weeks last fall. Of course, the newly bullish monthly momentum studies hint of PLENTY of bandwidth to get there, if data/events warrant. Just sayin' …
… and for some MORE of the news you can use » IGMs Press Picks for today (3 FEB— and STILL SPORTING THAT NEW LOOK!!) to help weed thru the noise (some of which can be found over here at Finviz).
From some of the news to some VIEWS you might be able to use — just a couple thoughts / visuals ahead of NFP. Global Wall St SAYS:
As Bloomberg's Edward Bolingbroke observed, an unidentified investor started amassing the position in the morning and continued buying through the afternoon as Fed Chair Jerome Powell expressed confidence that inflation was improving.
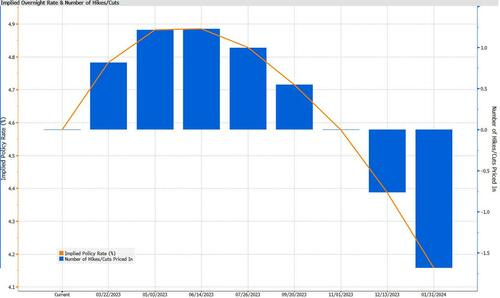
The trade’s $80 million outlay would turn into a $400 million profit if the Fed were to cut its benchmark rate to 2.5% by the end of the year. A lesser amount of cuts, to 3.8%, would lead to a $100 million gain, according to Bloomberg’s Option Scenario Analysis function.
While the market is certainly pricing in aggressive rate cuts by year end - a 50bps cut to 4.4% in December from a 4.9% June peak, is now very much a given - a plunge to 2.5% in Fed Funds would be unprecedented and even a drop to 3.8% would require some unexpected shock to startle the Fed. The breakeven for the trade at expiry is a yield level of approximately 4.2%, so it is only profitable if the Fed cuts below this level.
As Bolingbroke explains, the $80 million SOFR bet was placed via a December 2023 SOFR call spread, where the owner of the position is long one strike equivalent to a 4.5% yield and short a higher strike equivalent to a 2.5% yield, where the maximum profit would be reached. Thursday’s preliminary Chicago Mercantile Exchange open interest data suggested the trade was a new position. Those options expire December 15, two days after the Fed’s final policy meeting of 2023.
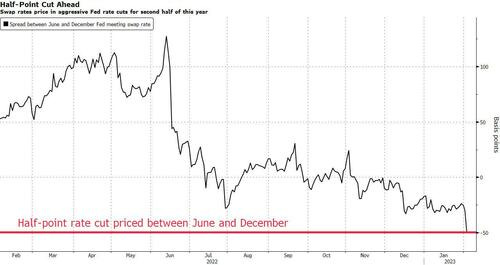
Of course, once you start fighting the Fed - successfully - you don't stop until you win, and on Thursday, another big SOFR options trade hit the tape, amounting to about $50 million. It stands to benefit from a continued collapse in volatility through the end of the year that would coincide with the steep rate cuts priced into markets.
Next up and in the wake of global central banking yesterday, I really have to say I despise these sorts of terms Goldilocks using re BoE — dovish hikes — to whit,
BOTTOM LINE: The MPC voted by a majority of 7-2 for a 50bp hike in today's meeting, highlighting continued concerns around the tightness in the labour market and persistence in domestic price pressures. But the minutes acknowledged that some forward-looking indicators had started to point to a slowing in wage and inflation data, and the language on the path ahead was softened notably. In particular, the MPC no longer guides that further Bank Rate rises are required and instead moved to an entirely data-dependent approach. The updated projections in today's MPR showed a shallower recession and slightly higher headline inflation at the end of the forecast horizon, but still well below the 2% target. The risks to the MPC's baseline inflation projections, however, were judged to be skewed largely to the upside, reflecting the possibility of more persistence in wage- and price-setting.
UBSs Paul Donovan on difference between (lower)earnings and (lower)wages
It is US employment report Friday, which means economists will be tirelessly reiterating their monthly reminder that “average hourly earnings are not wages.”The increase in the number of people taking additional jobs to help overcome disastrously bad real wages will tend to lower average hourly earnings. However, as not all the job layoffs that have been announced have been implemented, the payrolls number may get some support.
The Bank of England’s 50bps rate increase was coherently explained as an insurance against unexpectedly high inflation. The bank does expect inflation to fall quite quickly, and that raises the possibility of rate cuts if insurance is not required later in the year.
The explanations around the European Central Bank’s 50bps rate increase were a little less coherent (there is no forward guidance, but the next hike will be 50bps). The ECB does seem likely to continue raising rates for longer—partly because it was late to start, but perhaps also because a large, faction-ridden decision-making body under weak leadership may find it difficult to change course….
Okie dokie … there’s PhD and ivory tower theory and there’s actual hands on TRADING experience and with that in mind, ahead of today’s NFP — for those attempting to PLAY along at home, DB offers how one should be,
Trading the employment report
It has been a whirlwind of Central Bank activity and market price action going into this particular payroll, but this will not detract from the capacity for the report to generate more vol. After all, labor market weakness has been the missing link in the face of a considerable slowdown in US activity, and a soft payrolls report including a rise in the U3 unemployment rate would make its own arguments for i) a more sustained weakening in demand; ii) more subdued wage inflation, and, iii) perhaps a peak in rates at the March meeting. Extraordinarily, the last significant downside miss on NFP was the Dec ’21 numbers, released in January 2022 (see Figure 1).
Ok, then … TRADING of NFP and game aside, same firm offering an updated model of 10yy which seems to be leaning a certain way and offering,
A mild bullish signal We have recently updated our 10Y UST model to improve its fit. Our latest iteration suggests that yields may still have some room to fall, but the gap between the market and the model has narrowed and is no longer statistically significant. Our previous model correctly sent a bullish signal for rates in early November. But over the past few months, it has consistently produced a fair value that was more than 2 standard deviations below the market, prompting the need for a recalibration.
The key changes to our model include:
Addition of 5y5y OIS vol as an explanatory variable. Since our forecasting framework includes an outlook on the Treasury term premium, and we occasionally compare it to 5y5y vol to identify potential dislocations, it made sense to include it in the model.
Replacement of the Global QE Flow variable with a calculation of the Federal Reserve’s share of the UST market. This change allows us to move away from using a backward-looking average and instead consider the stock effect, which incorporates information about previous QE purchases. The removal of other central bank purchases did not have a meaningful impact on the model.
Removal of the UST Issuance variable, since information about Treasury supply is already embedded in the Fed’s share calculation described above.
Calculation of the Speculative Positions z-score based on risk-weighted positions as a percentage of aggregate open interest, instead of just on risk-weighted positions. This change better reflects the size of speculative positions in relation to the overall futures market.
A comparison between the previous and updated models’ regression and backtesting results can be found in the note. At present, the new model suggests a fair value of 3.17% for 10Y Treasuries, which is about 22 basis points below where the market is trading. We interpret this to be a mildly bullish signal…
10yr US Bond Yields have reversed back lower and are retesting their key 200-day average at 3.335/32%….
… Short-term Strategy: We stay tactically bullish from ~3.85% and look for a move to resistance at 3.00%, where we would consider turning tactically neutral. A close above 4.00% would also make us consider turning neutral.
Putting SOME of this all together, John Authers latest morning missive offers an interesting macro markets and bond market specific visual which caught my
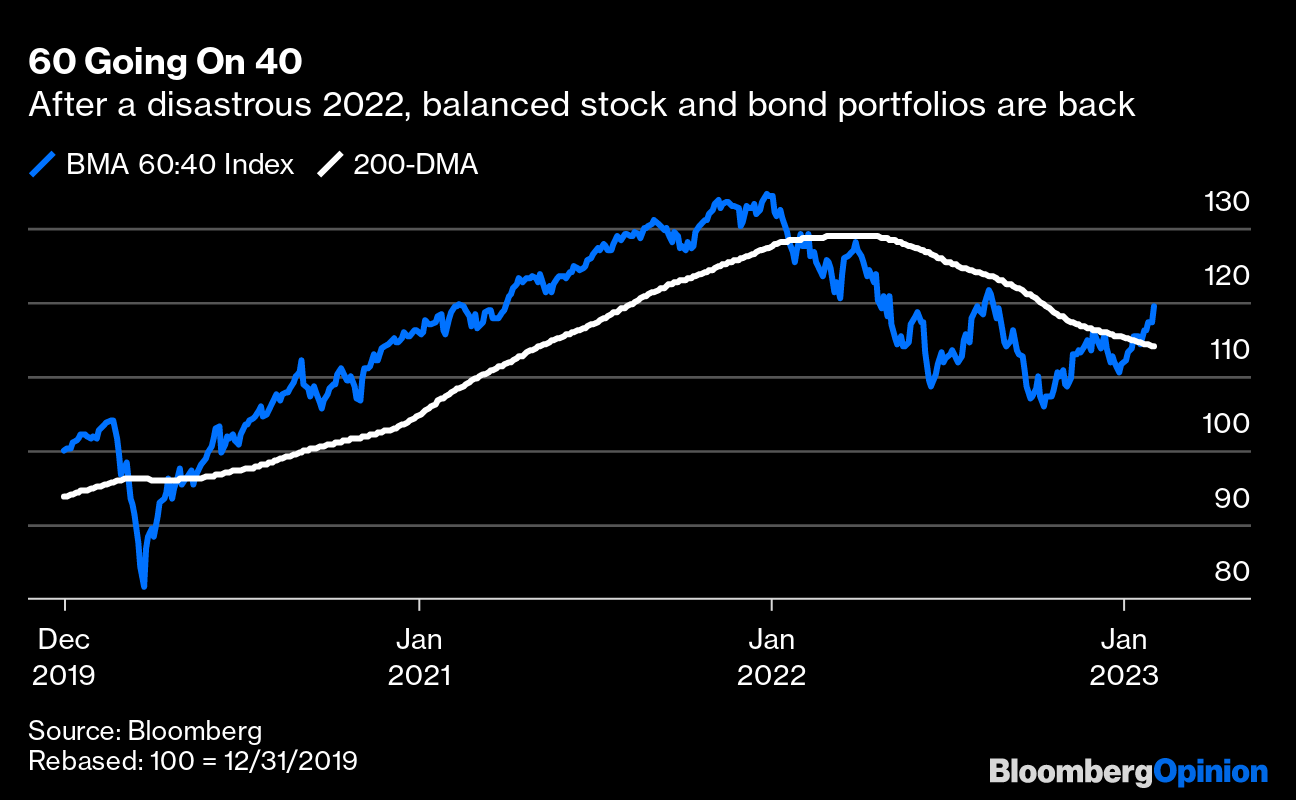
… Adding to the fun, bonds have also been delivering capital gains for a change. That means the classic balanced portfolio, of 60% stocks and 40% bonds, has started to perform again after a historically miserable year in 2022. This is how Bloomberg’s 60:40 benchmark has performed — note, yet again, that it appears to have broken decisively above the 200-day moving average:
All these technical landmarks do matter. Many are now comfortably proclaiming that a new bull market is under way. And they are doing so within hours of rate rises by three of the world’s most important central banks.
Perhaps it was and still is that 60/40 is NOT DEAD YET