Good morning … 5yy and 7yy auctions both in rear-view mirror and long end USTs got clubbed on Wednesday along with BIG tech’s MAG7 … Seems as thought that was just a passing fancy as rates went back down ‘bout as much as they went UP — markets declared a mulligan?
Be that as it may, I’m going to lead with a WEEKLY chart of 10s as desks likely to be thinly staffed (if not already) and trading activity likely to be muted shortly after 10a data (all detailed HERE) …
10yy: levels of importance (IMO) to watch are 4.34% (Oct ‘22 cheap), 4.18% (Apr ‘24 low, uptrend channel)…
… and here we sit nearly right in the middle of aforementioned levels with momentum overBOUGHT looking to be on verge of turning higher … rates can go UP from here OR, simple grind around, passing time which will, in turn, work off any overbought reading …
… AND a couple / few catchup bullets / links after a day away from keys …
ZH: Yields Jump After Soggy 5Y Auction Tails BMO: 7-year auction stops through 0.5 bp -- highest non-dealers since Jun. '23
* Today's 7-year auction was well-received with a stop-through of 0.5 bp and non-dealer bidding of 91.1% vs. an 85.8% average. * 7-year auction stopped at 4.162% vs. six auction average of 4.377%. * Bid/Cover was 2.64x compared to an average of 2.54x. * Dealers took 8.9% vs. a 14.2% average. * Directs claimed 16.8% vs. a 17.5% norm. * Indirects were awarded 74.4% vs. an average of 68.3%. * Before the auction, 7s had partially retraced the overnight gains that brought rates as low as 4.114%, and yields went into 1pm roughly 4 bp lower on the day. Since the result, rates have ticked lower in the follow-through.
ZH: Bonds & Big-Tech Bloodbath: Mag7 Meltdown Accelerates As Yield Curve 'Dis-Inverts' To 2-Year High
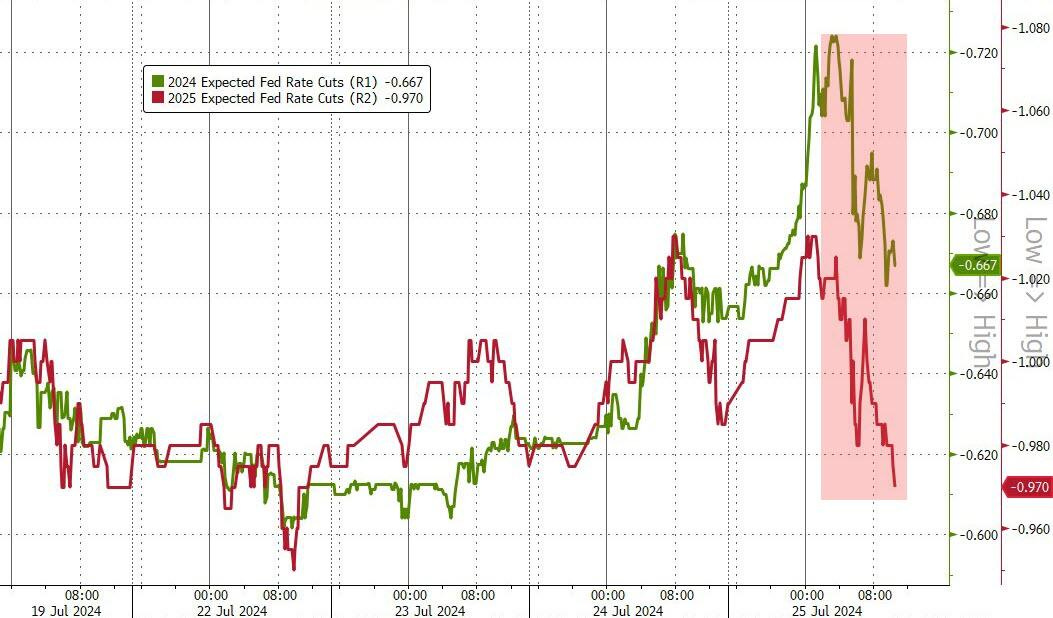
KC Fed survey joined yesterday's Regional Fed surveys in the doldrums (as did today's plunge in durable goods orders) but of course, all eyes were sternly focused on Q2 GDP's beat.
That 'good news' sparked a hawkish shift lower in rate-cut expectations...
NEWSQUAWK: US Market Open: Sentiment improves with equities and antipodeans on the front foot, DXY flat ahead of US PCE … USTs are rangebound, EGBs softer with European specifics-light … USTs are flat and trade has been rangebound in the run-up to US PCE at 08:30 EDT / 13:30 BST. Focus is on the core metric which is seen in a 0.1% to 0.2% range, a 0.2% figure may not knock the narrative for September easing, but could impact pricing for the remainder of the year.
Finviz (for everything else I might have overlooked …)
Moving from some of the news to some of THE VIEWS you might be able to use… here’s SOME of what Global Wall St has been sayin’ while I was away …
BARCAP Advance Q2 GDP: Resilience, again and again and...
The BEA's advance report placed Q2 GDP growth at 2.8% q/q saar, with a swing in inventory investment driving an acceleration from 1.4% in Q1. PDFP remains on a sustained upward trajectory, pointing to solid momentum into Q3. Meanwhile, core PCE prices surprised to the upside, directing attention to tomorrow's monthly data.
… Core PCE prices rose 2.9% q/q saar in Q2, about 0.2pp faster than expected, implying upside risk to our June core PCE inflation estimate…
… Today's data likely rule out any slim possibility that the FOMC might initiate cuts in July, with prospects for September still inflation-dependent. The strong activity data highlight the resilience of activity, reiterating the message that the FOMC can afford to wait to see more data before initiating cuts. Although tomorrow's inflation details will likely lift the trajectory of monthly inflation through June, we doubt that this would be enough to derail prospects for a cut in September. We maintain our baseline that the FOMC will initiate quarterly rate cuts in September, continuing through Q3 25, which is conditioned on forecast moderation in core PCE price inflation to around 0.2% m/m in June and thereafter. Somewhat stronger prints could push the timing of the first rate cut to December.
BARCAP: Federal Reserve Commentary: July FOMC preview: A hint, not a strong signal
With encouraging inflation data and the labor market showing signs of moderation, we expect the FOMC to hint at a September rate cut. But with key data to come in the next several weeks and markets having already priced in a September cut, we see little upside for the FOMC to provide a strong signal.
BARCAP: July employment preview: Upside and downside risks aplenty
We expect a 175k increase in nonfarm payroll employment in July, slower than June's 206k gain, with average hourly earnings rising 0.3% m/m (3.7% y/y). On the household side, we look for the unemployment rate to round up to 4.1%.
Once again, markets are pricing in an extended cutting cycle, reflecting recent softer inflation readings and inferences about a cooling labor market. The latter partly reflects a perception that the unemployment rate is providing a better signal than payroll employment. We use census counts to show that this is misguided.
BNP US Q2 GDP: Robust growth augurs continued Fed caution
KEY MESSAGES
A stronger Q2 GDP print (2.8% q/q saar) relative to consensus (2.0%) and our own estimate (2.2%) revealed a rapid build-up in inventories that offset a drag from trade, leaving a picture of robust underlying growth in the US economy intact.
Final sales to domestic purchasers edged higher to 2.7% from what Fed Chair Powell called expansion “at a solid pace” in Q1 (2.4%), allowing policymakers to ensure they have a couple more months of “good” inflation data in hand so as to start the rate-cutting cycle in September.
At face value, barring revisions to April and May, the quarterly core PCE price deflator at 2.9% implies a monthly print of at least 0.25% in June – the data to be released 26 July.
We expect Chair Powell to set the stage for a September rate cut at July’s FOMC meeting.
We think the FOMC will continue to highlight data dependence, with a September cut conditional on no material upside surprises in inflation data over the next two months.
We expect 25bp rate cuts in September and December, and 100bp of cuts (at a quarterly pace) in 2025.
DB: Early Morning Reid (on data and rate CUT pricing)
… There were also other less dovish data elements. For instance, the GDP release showed that core PCE inflation was running at +2.9% in Q2 (vs. +2.7% expected). So unless there are revisions to April/May, this would imply a hotter than previously expected June number when released today. This will be an important print. Meanwhile, weekly initial jobless claims were down to 235k in the week ending July 20 (vs. 238k expected), and continuing claims were down to 1.851m (vs. 1.868m expected) over the week ending July 13.
Still, viewed across the day as a whole, there was no reversal of Fed easing hopes with some probability of either a move next week or a cut of more than 25bps by the September FOMC with markets pricing in 28.6bps of cuts by then as of yesterday’s close (+0.8bps on the day before). For what it’s worth, the first rate cuts in 2001 and 2007 were both 50bps, although both of those came in the context of imminent recessions. By contrast, when the last cutting cycle began in 2019, the Fed delivered three 25bp moves, until Covid hit in 2020 when they slashed rates more aggressively.
The fact that markets ended the day pricing more cuts perhaps reflects the tightening in financial conditions we’ve seen over the last week, with Bloomberg’s index of US financial conditions falling to its least accommodative level of 2024 so far.
That said the GDP print did cause some intra-day repricing as markets started more dovishly with 31bps of YE 2024 Fed cuts priced in pre-data. The 2yr yield also traded as low as 4.34% early on, its lowest level since early February, but was ultimately unchanged on the day at 4.43% by the close. The long end of the curve did rally on the day, as the 10yr yield fell -4.3bps to 4.24%, while the 30yr yield was down -5.9bps. So there was a decent curve flattening that took the 2s10s back to -19.2bps, which marked a reversal from earlier in the session when it had got as steep as -11.3bps…
Real GDP rose 2.8% vs. MSe 2.2%, while private domestic demand came in at 2.6% (MSe 2.1%) showing no slowing from 1Q. Headline GDP driven by stronger consumption and business investment. Core PCE prices saw a rise at 2.9% Q/Q (above MSe 2.8%).
RBC: U.S. GDP growth accelerated in Q2 but PCE inflation moderated
…Bottom line: The U.S. economy grew at a faster pace in Q2 2024 supported by solid expenditure details. Still, the PCE inflation data has continued to indicate easing price pressures, echoing slowing in CPI inflation in Q2. Elsewhere, the labour market in the U.S. has shown signs of slowing, evidenced by higher unemployment rates and a gradual decrease in employment and wage growth. Strong economic growth is unlikely to be a concern for the Fed long as inflation is slowing and labour market gradually moves into better balance. Contingent on those trends persisting, we expect the Fed will cut interest rates in September.
Yesterday’s second quarter US GDP release showed the US consumer is alive and well, and spending money. Some of the GDP data reflected a bounce back from the first quarter. Today’s personal income, consumption, and deflator data offers more insight into the direction of travel. It would be unwise to bet against reasonable US consumption, with middle-income households still relatively well supported.
The broad PCE deflator measure is less distorted by the fictional owners’ equivalent rent, and has other technical differences from consumer price inflation (like auto insurance). Disinflation should continue. Goods price deflation was evident last month, and more items are in deflation than at any time since the pandemic. The Federal Reserve is relentlessly (wrongly) raising real rates…
Wells Fargo: Economic Growth Exceeded Expectation in Q2
Summary The economy expanded at a 2.8% annualized rate in the second quarter. While that handily exceeded expectations, we suspect that it may be the fastest GDP growth rate we are apt to see for the foreseeable future.
Wells Fargo: The Sahm Rule Signal: On the Blink or Flashing Red?
Summary Rising unemployment over the past year has sent the clearest signal yet that the labor market is weakening. While the Sahm Rule indicator—which highlights the historical pattern that the unemployment rate has never risen 0.5 points above its prior 12-month low without a recession—has not crossed its recession threshold, the current rise would nonetheless be unique if a downturn in the labor market were to be avoided. Of course, this has been a unique labor market, with the pandemic initially delivering a massive shock to labor supply. Is the recovery in labor supply now interfering with the Sahm Rule signal?
At 0.43, the Sahm Rule indicator has already risen more than at the onset of any recession in the past 50 years. Yet entrants into the labor force, particularly re-entrants, have been an unprecedented driver of the increase. This should assuage some concern over the current rise as it comes in larger part for the “right” reason of more workers entering the jobs market, which ultimately makes it easier for businesses to grow.
Yet the increase in the unemployment rate for the “wrong” reasons is troubling in its own right. Looking at the rise in unemployment due to job loss on the same basis as the traditional Sahm Rule shows an increase similarly reminiscent of periods when the labor market was on the brink of a downturn.
Could this be the cycle where the Sahm Rule breaks? The larger lift from labor force entrants and more gradual ascent compared to the starting point of prior recessions raises the likelihood. That said, the negative feedback loop between rising unemployment and declining spending means that neither the current increase in the traditional Sahm Rule indicator nor the job loser version should be brushed aside. Recession thresholds crossed or not, the increase in both values shows an unequivocal deterioration in the labor market. With momentum in the jobs market difficult to shift, we see the risk of recession remaining unusually high at the moment.
What is r* (pronounced “R-star”)? Why does it matter, and how is it estimated? What are the key factors that drive it? In Part I of this two-part series, we answer these questions and more for this critical economic variable.
Summary
With the first rate cut from the FOMC looking increasingly likely to occur in the next few months, a new debate has gathered momentum: what is r* in today's economy, and where is it headed in the future?
R* (pronounced "R-star"), also known as the natural rate, the neutral rate or the equilibrium rate, is the real (i.e. inflation-adjusted) policy rate that would be expected to prevail over the longer-run with inflation anchored at the central bank's target. In other words, r* is the real short-term interest rate that neither speeds up nor slows down the economy in equilibrium.
Understanding r* is critical to financial markets and policymaking. An accurate estimate of r* can help central bankers craft monetary policy in a way that meets the needs of the economy at a given point in time. An investor considering whether today's 10-year Treasury note is an attractive investment must weigh not just what short-term interest rates will be over the next year or two but what they will be for the entire next decade.
Measuring r* is an inherently tricky task. One of the defining characteristics of the natural rate is that it is not directly observable. Unlike employment growth or inflation for consumer goods, r* is a theoretical construct that cannot be sampled. Economists must rely on a variety of tools and methods to estimate r*, and there is inherent uncertainty around those projections.
Looking across a wide range of measures, including econometric models, financial market instruments, Federal Reserve forecasts as well as private sector economist forecasts, we believe a reasonable range of consensus estimates for r* in the United States at present is ~0.75% on the low side and ~2.50% on the high side, with the median forecast probably closer to the bottom end of that range.
But what determines r* in the first place? At its core, r* is the market clearing rate for the supply of and demand for savings. Firms and governments demand capital to finance new projects, while the supply of capital originates from savers seeking to earn a rate of return in exchange for delaying consumption.
Many factors impact the supply of and demand for savings. Over the past few decades, a few forces have put upward pressure on r*, such as an explosion in public debt. However, other factors such as slower productivity growth, an aging population, new financial regulations and a global savings glut have more than offset the upward pressure on r* from fiscal deterioration. These structural changes explain the steady decline in r* and in U.S. interest rates more generally that began in the 1990s and lasted until a few years ago.
But as we look to the years ahead, will low real rates continue to be the norm? The experiences of the past few years have led to a revisiting of that assumption. Questions abound about the outlook for accelerating labor productivity, rapidly declining birth rates, deglobalization and ballooning public debt. In Part II of this series, we will examine the outlook for these factors and lay out our base case forecast for r*.
The S&P 500 peaked most recently on July 16th and has traded lower ever since. If the pullback in the second half of July feels like déjà vu, it's because the same thing happened last year around this time. When we compared the S&P's year-to-date performance in 2023 to what we've seen so far in 2024, we were surprised how closely things have tracked. Check out the chart below.
While the path the market took in Q1 2023 was different than the path it took in Q1 2024, by the end of March, the S&P was up by a similar amount on a year-to-date basis. From the start of Q2 through mid-July, it's amazing how closely the two years tracked. On July 18th, the S&P 500 was up 18.8% on a year-to-date basis in both 2023 and 2024!
As you can see in the chart, the market peaked and began a multi-month pullback from late July through late October in 2023. This year, the peak and subsequent pullback in July began a few days earlier. Based on the action we saw after the July peak last year, bulls will certainly be hoping these two tracks diverge quickly, because if they don't, the next couple months would be quite painful.
ING: US GDP growth beats expectations, but fails to dent the market's faith in rate cuts
The US economy grew at a faster than expected 2.8% annualised rate in the second quarter and core inflation was also a little hotter than expected. The economy is facing more challenges in the second half of the year and with the Fed sounding more relaxed on the path ahead for inflation, we expect a growing focus on activity to deliver rate cuts from September
…Business surveys are tracker much weaker versus GDP growth
ING: World trade growth improves but conditions remain challenging
Global trade volumes improved slightly in the first half of the year despite all the negative geopolitical issues. Asia and the US have been the main growth drivers, leaving Europe somewhat behind. We're not expecting much change for the rest of the year
WolfST: Economy Re-Accelerates in Q2. Our Drunken Sailors Splurge on Durable Goods, Investment Jumps, Federal Gov Undoes Blip
Our Drunken Sailors are back at it, but in moderation, so to speak, their feathers largely unruffled by interest rates.
ZH: US Services Soar, Manufacturing Slumps In Preliminary July PMIs (soaring and slumping … see whatever you wanna see?)
ZH: Blackstone Mortgage REIT Slashes Dividend By 24% As Distress Piles Up In CRE World (this one from WED strikes me as important and worth watching)
STILL catchin’ up but HOPE to be done and passing along whatever weekly observations may hit inbox … THAT is all for now. Off to the day job…