while WE slept: USTs modestly lower, belly underperforming on LIGHT volumes; May cut has left the building ... leaving 'bonds in gloom'
Good morning … As Global Wall wakes up they are to be greeted by headlines like these over at Bloomberg …
… and these headlines are thanks in part (or in totality) TO Fedspeak which occurred yesterday. Frankly, as I was watching some of the h’lines cross, I honestly thought to myself how it was I’m 100% unfamiliar with some of these folks SO I went TO THIS #FOMC101 (originally mentioned HERE with Bostic highlights)
… Note to self — Summers — last I checked — NOT on the list and for somewhat more FROM Golilocks, continue scrolling below and for now, as global markets continued celebrating “Alphoria” YESTERDAY, we’ve had SOME data to mull over and so …
BondDad: The good news on jobless claims continues
CalculatedRISK: Weekly Initial Unemployment Claims Decrease to 201,000
ZH: Initial Jobless Claims Plunge Near Record Lows... Fed Questions Data's Accuracy
ZH: US Services Sector Slumps In Feb, Manufacturing Hits 17-Month-High (and while all SLUMPS are created equally some are, more EQUAL than others … at least thats MY take from APOLLO HERE — noted just yesterday)
ZH: US Existing Home Sales Disappoint As Price Hits Record High For January
… while data (aka funDUHmentals) are nice, there are a couple things about this very moment in time which would seem to me to make PRICE ACTION (another form of data — as in where buyers and sellers meet and attempt to arm wrestle for the big belt buckle) and with price action in mind, a couple things from the intertubes which struck ME as funTERtaining … more so than a visual of any single UST and so …
at CVPAYNE
The stock market is not the economy.
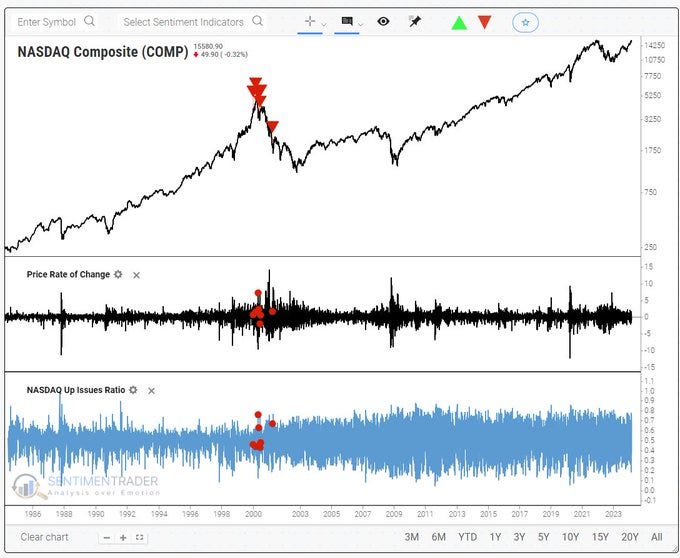
… and then there was this one which — right or wrong — offered reason to pause and think …
at JASONGOEPFERT (SentimenTrader guy)
Unusual situation developing.The Nasdaq Composite is up nearly 3%, with fewer than 55% of issues advancing.
All 5 precedents according to SentimenTrader occurred between 1999-2001.
… I’m sure it’s all nothing at all and someone or some THING with artificial intel will correct for my woke outta touch view of PRICE ACTION and clarify that it all makes 100% perfect COMMON sense.
For now, though RATES are grinding higher / aggressively UNCH and APPROX changes so far on the week …
2yy +9bp
5yy +8bps
10yy +6bps
30yy +3bps
… measured from Friday’s CLOSE to about where we are now (550a). Once again I’m reminded that this year again seeming NOT to be quite the year of the bullish resteepening many / most had planned and budgeted for but it is early …
… perhaps a longer-term look at curve over the weekend, time / weather permitting but for now … here is a snapshot OF USTs as of 715a:
… HERE is what this shop says be behind the price action overnight…
… WHILE YOU SLEPT
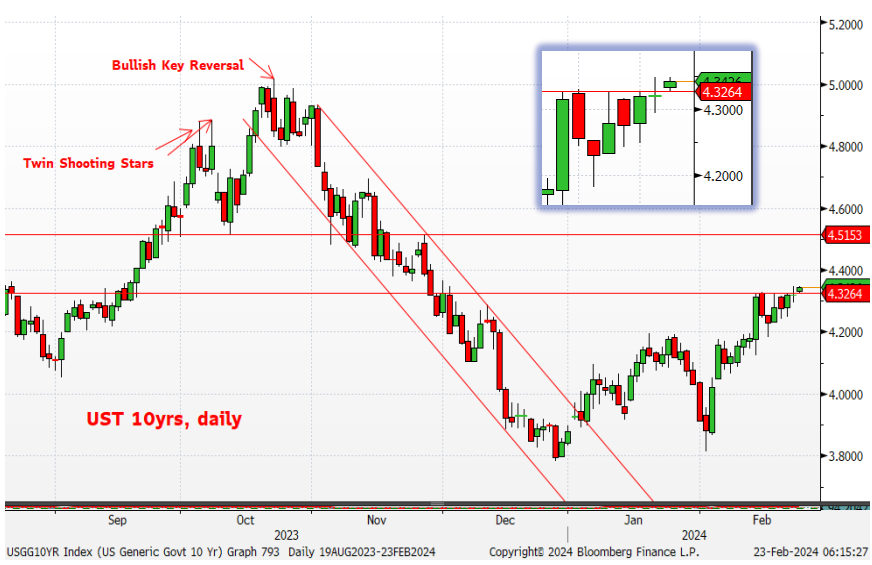
Another brace of generally hawkish/cautious/patient comments from Fed officials last night has Treasuries modestly lower this morning with the belly slightly underperforming on curve. Tokyo trading was shut for holiday and today's essentially bare economic calendar may allow more focus on Monday's back-back Tsy coupon auctions (2's at 11:30, 5's at 1pm) and some set-ups for those. DXY is a hair lower (-0.07%) while front WTI futures are notably lower (-1.65%). Asian stocks were mostly higher after big gains here yesterday, EU and UK share markets are mixed while ES futures are showing UNCHD here at 7am. Our overnight US rates flows saw a lower opening in London with quiet overall flows this morning. Some front-end dip-buying was seen (see attachment of 2's holding support; front-end dip buying a theme in NY this week too) while back-end flows were mixed/muted. Overnight Treasury volume was predictably dampened at ~75% of average.… Our next attachment this morning zeros in on the percolating breakout higher in Treasury 10-year yields which we show in a daily chart. Over the past week or so, the 4.325% level has been a support for 10's. We highlight in the shadow box how the support level may be giving way again this morning. The next support level that the charts hint at is, we'd guess, the 4.515% level should 10's confirm their bearish breakout at today's close. Updating the technical grid before publishing this morning... we took a look at Treasury 2yr yields and how they, unlike 10's, are so far holding support near 4.735% this morning- as drawn in. So there are at least two Treasury benchmarks to watch at the close today!
… there you have ‘em both 2s AND 10s … and for some MORE of the news you can use » The Morning Hark - 24 Jan 2024 and IGMs Press Picks (who CONTINUES to be sportin’ that new, fresh look) in effort to to help weed thru the noise (some of which can be found over here at Finviz).
… and for some MORE of the news you might be able to use…
IGMs Press Picks (February 23 2024)
NEWSQUAWK: US Market Open: Commodities clipped & equities slightly softer, awaiting geopolitical updates … Bonds are softer but Bunds/Gilts yet to test Thursday’s lows, fleeting hawkish move on Ifo/ECB Consumer survey
Reuters Morning Bid: Record world stocks leave bonds in gloom
Finviz (for everything else I might have overlooked …)
Moving from some of the news to some of THE VIEWS you might be able to use… here’s SOME of what Global Wall St is sayin’ …
BARCAP: Existing home sales increase in January, showing effects of declining mortgage rates
Existing home sales increased 3.1% m/m in January to 4.0mn, alongside an upwardly revised estimate for December sales. Single-family sales drove the gains, while multifamily sales remained constant, leading to a decrease in the monthly supply of homes.
BNP Front-end center: Money fund assets and WAM outlook
Money market fund assets under management and weighted average maturities have jumped sharply amid elevated interest rates, increased supply of short-term assets, and the end of the Fed hiking cycle.
Our baseline is for inflows into MMFs to decelerate (though remain positive) over the next six months, while WAMs should gradually fall through the rest of the year as the Fed begins rate cuts in June.
Our bias remains for volatility and upward pressure in funding costs to intensify in H2 2024 as MMFs navigate the realization of the next phase of the rate cycle while the Fed continues to drain cash from the system.… WAM normalization to put pressure on T-bills: The other piece of the puzzle is MMF WAM. Our baseline is consistent with a modest decline to or slightly below 35 days by year-end. The highest WAM had ever reached when looking at Crane data was close to 43 days in February 2021, after net T-bill supply of approximately $2.5trn during the pandemic. WAM should remain elevated above 30 days for some time as rates will still be quite high and cumulative T-bill issuance for CY2024 will remain positive. However, MMFs look to have overextended following the December FOMC meeting to chase the rally in duration. A return of the US exceptionalism narrative and reemerging inflation risks have induced a backtrack from long-end bills, with bid-to-covers starting to fall again and average WAM now stalled at 38 days. Following the T-bill issuance slowdown in Q2, long-end T-bill-OIS spreads should gradually widen (T-bills cheaper) versus 1m-2m bill spreads in H2 2024 as MMFs marginally shorten WAM into an uncertain cutting cycle.
DB: Early Morning Reid - Macro Strategy (beyond NVDA … Fedspeak…)
… With this overall supportive backdrop, Fed speakers continued to urge caution regarding Fed cuts with Vice Chair Jefferson warning of the risk of “easing too much on improving inflation” after the January “CPI highlight(ed) disinflation is likely to be bumpy.” He still said that it is “likely appropriate to cut later this year” but it was a slightly hawkish message from someone around the center of the FOMC. Philadelphia Fed president Harker made some mixed comments, saying he “would caution anyone from looking for (rates easing) right now and right away” but later suggesting that cuts could come within “a couple of meetings”. Later on, we heard a patient tone from Governor Waller, who noted that there was “no great urgency” to ease policy, as well as from Minneapolis Fed President Kashkari, who said “we still have some work to do” on inflation.
Fed funds futures saw expectations of 2024 rate cuts sink to a new 3-month low of 81.5bps (-5.2bps), which is less than half what priced at the peak on January 12. As a result, 2yr Treasury yields rose +4.6bps to 4.71%, their highest since the December Fed meeting. The softer PMI data saw 10yr Treasuries waver between gains and losses, ultimately finishing the day +0.3bps at 4.32%. Yields saw a bit of volatility, but little lasting impact, around a soft 30yr TIPS auction. This saw bonds issued at a 2.20% real yield, 2.5bps above the pre-sale yield and the highest since 2010 (the last 30yr TIPS auction was back in August).
DB: US inflation: being watchful
We have been flagging downside risks for US inflation stemming from rents for some time now, arguing that rent disinflation should be one of the reasons that "no-landing" scenario risks are limited – at least in the next 3-6 months (see here).
The January CPI print caught markets by surprise, as OER picked up (from 0.42% to 0.56% m/m), while primary rents remained on their downward trajectory (from 0.39% to 0.36% m/m) and in line with forward-looking new rents – causing the spread between the two to reach the highest level since 1995 (~20bps). We have recognized the uncertainty around timing and magnitude of the pass-through from asking rents to CPI data, but always from a disinflationary standpoint (i.e. when and by how much it decelerates).
We recognize that the latest OER acceleration could challenge our view if confirmed over the next few months (i.e. not being a single-month anomaly/one-off effect).
Goldilocks: Pushing the First Cut Back to June Following Recent Fed Comments; Now Expecting 4 Cuts in 2024 and 4 in 2025 (this one hit the inbox at 1018p … )
BOTTOM LINE: Comments this week from Fed officials and the minutes to the January FOMC meeting suggest that the first rate cut is unlikely to come as early as our previous forecast of the May meeting. We have therefore dropped our forecast of a May cut and now expect 4 cuts total in 2024 (vs. 5 previously) in June, July, September, and December, followed by 4 more cuts in 2025 (vs. 3 cuts previously), to the same terminal rate of 3.25-3.5%.
In a speech this evening, Governor Waller said that he is “going to need to see at least another couple more months of inflation data before I can judge whether January was a speed bump or a pothole” and that “delaying rate cuts by a few months” is unlikely to hurt the economy. Because there are only two rounds of inflation data and a little over two months until the May FOMC meeting, his comments suggest to us that a rate cut as early as May, which we had previously expected, is unlikely …
Goldilocks: Existing Home Sales Rise; Boosting Q1 GDP Tracking to +2.4%
BOTTOM LINE: Existing home sales increased by 3.1% to a seasonally adjusted annualized rate of 4.00 million units in the January report from an upwardly-revised December level. The median sales price of all existing homes increased 1.1% month-over-month, while the imbalance between housing supply and demand was unchanged. Following today’s data, we boosted our Q1 GDP tracking estimate by 0.1pp to +2.4% (qoq ar) and our Q1 domestic final sales growth forecast by 0.1pp to +2.7% (qoq ar).
MSs Global Macro Commentary: February 22 (a comment at days end…)
AI optimism lifts SPX to record high; USTs twist flatten, curves end at session lows; Fed's Jefferson cautions on consumer spending; European rates twist flatten, ECB Accounts show cuts still "premature"; KRW gains, BoK on hold; MXN weakens post-CPI; DXY at 103.94 (-0.1%); US 10y at 4.321% (+0.2bp).
… In prepared remarks, Fed Vice Chair Jefferson outlined that the weakness in household balance sheets toward the end of 2023 led him to expect slower growth in spending and output in 2024. However, he cautioned continued strength in spending is an “important upside risk” to his forecast. Consumer spending that is more resilient than he currently expects could cause progress on inflation to fall…
… He reiterated the view shared by the Committee: “...if the economy evolves broadly as expected, it will likely be appropriate to begin dialing back policy restraint at some point this year.” He highlighted the “careful easing” in the July 1995 easing cycle allowed the FOMC to assess incoming data and other information to ensure inflation was under control. He pointed out in that cycle, the FOMC left rates unchanged for three meetings as it awaited more information, and then continued to ease…
UBS: Flash PMIs: Manufacturing expands
… Today's report adds to the regional Federal Reserve survey data we have received so far for February — marginally improved, but still weak for an economic expansion …
UBS (Donovan): Reasons to rush rate cuts (apparently he didn’t actually see / hear the Fedspeak yesterday? i don’t even work in the industry any longer and I stumbled on it…ok ok, so he DID see it but he’s one who … disagrees? now that Goldilocks has ushered May OUT, reduced cuts to ‘just’ 4, perhaps he doesn’t realize he’s got cover to change his view and mark it to market?)
Federal Reserve governor Waller suggested there was “no rush” to cut rates. There is no absolute urgency, but there are three counter arguments. Real rates for businesses and consumers have risen significantly since last July. Any lingering US inflation is mainly confined to Texas and Florida, not the whole country. And saying there is “no rush” is unlikely to be appreciated by struggling lower income households…
Wells Fargo: Existing Home Sales Jump in January
Lower Mortgage Rates Help Boost Resales to Start the Year
Summary
Homebuyers Take Advantage of Falling Rates
Existing home sales started 2024 on a positive note, increasing 3.1% as single-family sales accounted for the entire gain. The 4.00 million-unit annual pace of total resales represents a moderate rebound from December's near cycle low and marks the fastest pace since last August. Supporting the headline, sales in the West, South and Midwest posted solid gains while sales in the Northeast were unchanged for the second straight month. Unlike new home sales which are measured at the time of the contract signing, existing home sales are measured at the time of the closing and thus may not reflect the current mortgage rate environment. We have seen significant improvement in mortgage rates over the past few months with the average 30-year fixed mortgage rate standing at 6.8% as of last week, down from nearly 7.8% in late October. As such, the strengthening in existing home sales seen in January is the anticipated catch-up to the contracts that were signed late in the fourth quarter as mortgage rates fell. The pending home sales index, which leads existing home sales by 1-2 months, jumped 8.3% over the month in December. The favorable performance of mortgage rates last month points to another positive monthly gain in January which, in turn, would be supportive of further existing home sales growth in the near-term. While certainly a good start to the year, headwinds for would-be homebuyers persist. Inventory on the market climbed 2% to about one million homes last month, though inventory remains relatively limited. With homebuyers taking advantage of lower mortgage rates, low levels of inventory have kept upward pressure on prices. The combination of relatively higher mortgage rates and higher home prices will continue to make housing less affordable to many potential homebuyers.Yardeni: Higher For Longer (reminds me of the WolfST over shoot commentary but frankly, gotta say i’m NOT a fan of the I TOLD YA SO … )
We've been in the higher-for-longer camp regarding the outlook for the federal funds rate (FFR) since the end of last year. That outlook was confirmed by the release of January's FOMC minutes yesterday and today's speech by Fed Vice Chair Philip Jefferson. The Fed wants to see more progress bringing inflation down and is in no rush to ease given the strength of the economy. Stocks soared despite this bearish news because Nvidia's earnings report was awesome. In addition, initial unemployment claims remained near 200,000, confirming that the labor market is still strong. So it was a great day for our Roaring 2020s scenario. Consider the following:
(1) The two-year Treasury yield tends to reflect the market's expectations for the federal funds rate in a year from now (chart). It fell to 4.14% in mid-January, implying five 25bps cuts in the FFR. Today it was back up to 4.72%, implying three such rate cuts. We are considering the possibility that the second half of the 1990s might be the most likely scenario for the FFR over the rest of the current decade. Back then, stock prices soared. The positive wealth effect boosted economic growth. Inflation was subdued by rapid productivity growth, implying that the 5%-6% FFR was in line with the so-called "neutral" FFR.
… And from Global Wall Street inbox TO the WWW,
Bespoke: 3%+ Gains at New Highs + 5 in a Row for NVIDIA
The Nasdaq 100 rallied 3.01% today and closed at a new all-time high.
The last time the index had a one-day gain of more than 3% to finish at an all-time high was...wait for it...3/22/2000.
March 2000 certainly wasn't a good day to suddenly turn bullish on the Nasdaq, but some context is in order.
While 3/22/2000 was the last time the Nasdaq 100 had a day like today, it actually had 22 similar days during a stretch from June 1998-March 2000, and it happened plenty of times during the index's entire 1990s run starting in 1991.
The green dots in the chart below show all days that the Nasdaq 100 had a 3%+ gain to close at a new all-time high.Bloomberg: Fidelity Manager Dumps Nearly All Treasuries on Growth Optimism (will this guy be the new Hasenstaab?)
US economy shows more signs of re-acceleration: Efstathopoulos
Bulk of 10-year, 30-year Treasuries were sold late last year
A Fidelity International money manager has sold the vast majority of US Treasuries from funds he oversees on expectations the world’s biggest economy still has room to expand.
Singapore-based George Efstathopoulos, who helps manage about $3 billion of income and growth strategies at Fidelity, sold the bulk of his 10-year and 30-year Treasuries holdings in December. He is now turning to assets that typically do well in times of good economic growth to boost returns.
“We don’t expect sort of a recession anymore,” said Efstathopoulos. “The probability of no landing is still small, but it’s been increasing. If that increases much more, potentially we will not be talking about Fed cuts anymore” in 2024.
Efstathopoulos is among those cooling on Treasuries as the US economy’s resilience forces investors to rethink bets on interest-rate cuts. Some are going a step further, speculating the Federal Reserve’s next move may even be a hike, after the recent strong inflation and jobs reports.
Bloomberg’s The Weekly Fix: Fighting the Fed leaves bonds bruised once more
Rate Cuts, Interrupted
The relentless pushback from policymakers against bets on rapid interest-rate cuts continued apace this week, pushing bonds down and sending yields to fresh 2024 peaks. Plenty are willing to wager yields could push higher still. As the Federal Reserve and the European Central Bank continued to preach patience, the markets were forced to further rein in their bets on easing.US traders have just about stopped fighting the Fed. Swaps are essentially pricing for the central bank to meet its guidance for three cuts this year, a huge shift from the start of this month when the market was certain six reductions were coming. Some looked to hedge against the potential that the next Fed move might even be a hike. Bets on ECB easing also came right back in. As well as dialing back global expectations for cuts, traders also started to become more diverse in their projections, rather than expecting most major central banks to move in lockstep.
Cash’s allure remains well-nigh overwhelming, with $6 trillion piling up in money-market funds. There’s even a fast-growing exchange-traded fund built around fancy financial footwork to offer investors the potential to get T-bill earnings without the usual income-tax hit…
Bloomberg: Partying like 1999? An NBubble isn't here (Authers OpED)
The current situation with Nvidia and AI isn’t nearly as extreme as the dot-com era, but the prospect of cheaper money on Fed rate cuts could add fuel.
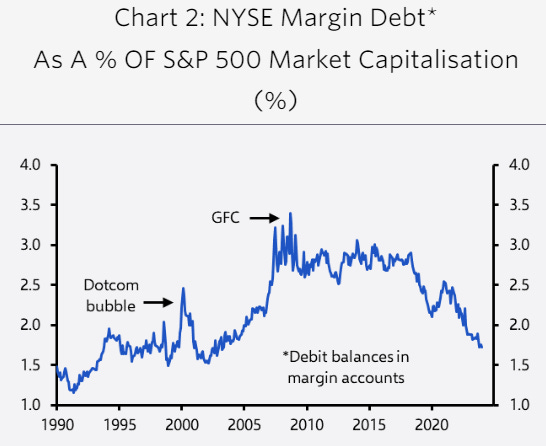
… There’s relatively little evidence of excessive use of leverage within financial markets, even if higher rates aren’t yet slowing down the US economy as had been expected. John Higgins of Capital Economics in London offers this chart showing that margin debt on the New York Stock Exchange has fallen significantly in recent weeks as the market surged:
Higgins makes the following case:
Unlike most bubbles, this one hasn’t been accompanied, at least so far, by obvious signs of high and rising leverage... Margin debt has actually been falling recently. And the ratio of margin debt to the size of the stock market has been doing likewise.
People aren’t as yet behaving as they do in a bubble’s final speculative stage, which is good to know. The possibility of interest rate cuts does, however, suggest that fuel may be on the way…
FirstTrust: Three on Thursday - The Era of Abundant Reserves (…I recall sitting in room with economists from DB, Barclays, BAML and others along with FRBNY staffers all discussing the demand curve for money … they had / HAVE no idea and are constantly trying to figure and fix on the fly as they offer out perception they’ve completely got this … they didn’t THEN and likely don’t now…)
Few people grasp the profound changes our monetary and banking systems underwent when Ben Bernanke was Federal Reserve Chair and Hank Paulson was Treasury Secretary. The 2008 Financial Panic spurred significant transformations, including Quantitative Easing (QE) (which massively expanded both the Federal Reserve’s (Fed) and banks’ balance sheets), the introduction of interest payments on reserves, prolonged periods of exceptionally low interest rates, and stricter banking regulations. This week’s edition of “Three on Thursday” is our attempt to highlight some of these unprecedented actions. Few people discuss it and the press covering the Fed has unfortunately chosen to ignore it, but these changes in policy have had, and will have, profound implications. First, the Fed increased its balance sheet by buying Treasury debt, which allowed government spending to soar. Second, by making reserves abundant, the Fed took complete control of short-term interest rates and held them artificially low, making that increased spending cost less. Finally, the Fed started paying banks interest on reserves in exchange for stress testing them and making them hold more capital and liquidity. At first, this policy didn’t mean much; after all, the Fed only paid banks 0.25% per year on their reserves. But the Fed is paying 5.4% on these abundant reserves, which is more than it earns on its portfolio (to read more about this, see our October 12, 2023 “Three on Thursday”). This change in policy is profound. To further the discussion, please explore, and share, the three charts below.
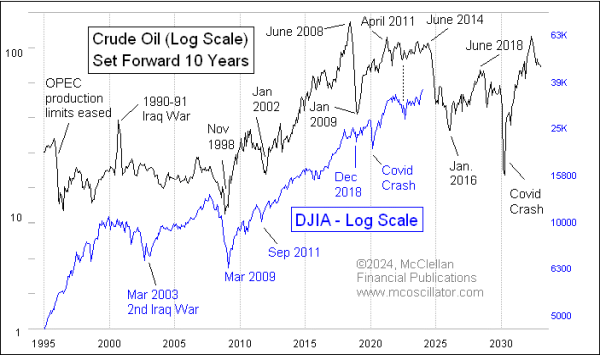
McClellan Financial: Crude Oil Says Stocks Heading for Unpleasant Time
…This relationship between oil prices and stock prices is important all the time, but especially so this year, because of what happened to oil prices 10 years ago. Back in 2014, the fracking boom in the U.S. was underway, and OPEC was trying to cut output to keep prices up in spite of that big new supply. OPEC gave up that fight in the summer of 2014, and oil prices fell hard. Here is another chart of that same relationship shown above, but zoomed in to better see the recent years.
Oil prices fell off a cliff between June 2014 and January 2016. That would mean a big decline for the stock market between June 2024 and January 2026, if the 10-year lag time continues to work as it has worked for more than a century.
What we do not know is what the magnitude of such a move in the stock market might be, because magnitudes do vary. Stock prices in 2018 did echo the big oil price crash that was part of the collapse of the generalized commodities bubble in 2008, but it was a much more quiet down move in stocks during 2018. The December 2018 bottom was almost exactly 10 years after the January 2009 crude oil bottom. Magnitudes can also vary the other way; the enormous bear market of 1929-1932 unfolded on schedule, echoing the collapse of the Texas oil boom which unfolded starting in 1920. But the stock market fell much harder than oil had suggested.
I feel pretty confident, based on this model, in expecting that the period between June 2024 and January 2026 is not going to a great time for the stock market, and also not great for whoever wins in the November 2024 elections. But I do look forward to the big bull market which this model says is coming between 2026 and 2028.
StateStreet Chart Pack Snack: Does market concentration lead to drawdowns?
S&P 500® Top 10 Now Make Up 30% of Index
AND … THAT is all for now — hope to have something out over the weekend but … Off to the day job…








By far, BondBeat is the best daily briefing I read! Thx