Investors back away from expectations that central bank can reduce rates in coming months
… and with all THAT said, actions being far louder than words, the world (ok, that’s a stretch) focused in on a single candle of yesterday’s price action …
2yy DAILY takin’ a peek up and over 5.00% (where it is right now)
… and for a much more sophisticated and techAmental view and levels to watch (2s as well as 10s), kindly see YESTERDAYS NOTE HERE … for now, we’ll forge ahead and ask … so, ‘bout that STAGflationary data print …
ZH: Stagflation Shock: GDP Stuns With Lowest Print In 2 Years, Below Lowest Estimates, As PCE Comes In Red Hot
ZH: 'Stagflationary' GDP Data Sparks Market Turmoil, Rate-Cut Hopes Crushed ZH: Wall Street Reacts To Today's Stagflationary Data Dump
… and PERHAPS today’s edition of the data will shed a bit more / different light BUT, oh, let us not forget the HOPE which springs eternally in / around jobs …
ZH: Initial & Continuing Jobless Claims Continue To Ignore Reality
… these set the table for concession into 7yr auction which one would think a good thing, right …
ZH: Soggy 7Y Auction Prices On The Screws; Foreign Demand Sags Amid Surge In Directs
… AND so it goes … here is a snapshot OF USTs as of 705a:
… HEREis what this shop says be behind the price action overnight…
… WHILE YOU SLEPT Treasuries are a hair higher and the curve is mildly steeper after the Bank of Japan held rates steady, sending the yen to a fresh 34-year low (JPY >156). DXY is higher (+0.1%) and front WTI futures are too (0.6%). Asian stocks were mostly higher, EU and UK share prices are all higher (SX5E +0.75%) while ES futures are showing +0.65% here at 6:55am. Our overnight US rates flows saw limited flows during Asian hours despite above-average screen volumes. During London's AM hours, strength in German bunds lifted Treasury prices a bit with some real$ interest to buy the front-end (mostly 2's-3's), consistent with this week's flow there. Overnight Treasury volume was subdued at ~70% of average overall…
…vthis morning's attachments are somewhat limited to updates of a few of the benchmarks we've been keyed on since the April 10th CPI shock. Our plan is to spend the hours after the 8:30am release to graze the chart pasture, looking for new trend developments. But close Tsy 2yrs at ~4.99% today, and you may have to reel ME off the ledge this afternoon, lol. Anyway, our first picture today looks at Tsy 2yrs and the recent channel that has taken yields back to their 4.98% to 5.00% support band- which they sit within at the open here. Note in the lower panel that daily momentum remains deeply 'oversold,' a reason why we suspect that yesterday's Core PCE price shock may have surprised few positioning-wise.
… and who presented 2yy better (don’t answer, we all know it was THEM!) is up to you and for some MORE of the news you might be able to use…
NEWSQUAWK: Strong Big Tech earnings prop up equities, JPY lower post-BoJ & Dollar flat ahead of US PCE … Bonds are modestly firmer, though very much contained ahead of US PCE … USTs are a touch firmer after yesterday's data induced losses, which sent the Jun'24 UST to a contract low of 107.04. Today's trade has been contained within a 107.04-108.01 range, with all eyes on March's US PCE metrics later.
Finviz (for everything else I might have overlooked …)
Moving from some of the news to some of THE VIEWS you might be able to use… here’s SOME of what Global Wall St is sayin’ … and based on GDP and PCE yesterday, I’m getting the sense we’re going to see another round of UPDATED CALLS coming soon …
BARCAP US Economics: Q1 2024 GDP: Reasonably strong under the hood
The advance estimate shows GDP decelerated from 3.4% to 1.6% q/q saar in Q1, weaker than expectations. The miss relative to our forecasts was driven primarily by consumer spending and inventories. That said, final sales to domestic purchasers rose a solid 2.8%, indicating demand conditions remain strong.
… This report leaves us with some open questions. The first is related to the slowing in real PCE, which was led by a decline in goods consumption (-0.4%), even as real services consumption grew solidly (4.0%). This does not line up with the retail sales data in hand, which has historically served as a good proxy for nominal goods spending. We await the monthly consumer spending data, due in tomorrow's personal income and spending release to gauge implications for Q2 PCE. Second, it struck us as odd that despite the strong growth in imports this quarter (7.2% q/q saar), both consumer spending and inventory investment were weak. This suggests that a good chunk of the imports is likely to have flowed through to fixed investments.
Core PCE prices rose 3.7% q/q saar in Q1, about 0.3pp higher than expectations, and implies an upside risk to our March core PCE inflation estimate…
…The stronger-than-expected core PCE inflation will undoubtedly lower the FOMC’s confidence that inflation is moving sustainably to 2%. This reinforces our conviction that the FOMC will not be able to cut rates more than once this year. We maintain our baseline call that the FOMC will lower rates 25bp this year, as we project core PCE inflation to moderate in coming months and end the year at 2.8% Q4/Q4. We think the Fed could cut rates at the earliest in September, provided that core PCE inflation moderates to around 0.2% m/m in June and thereafter. However, slightly stronger prints could easily push out the timing the first rate cut to December.
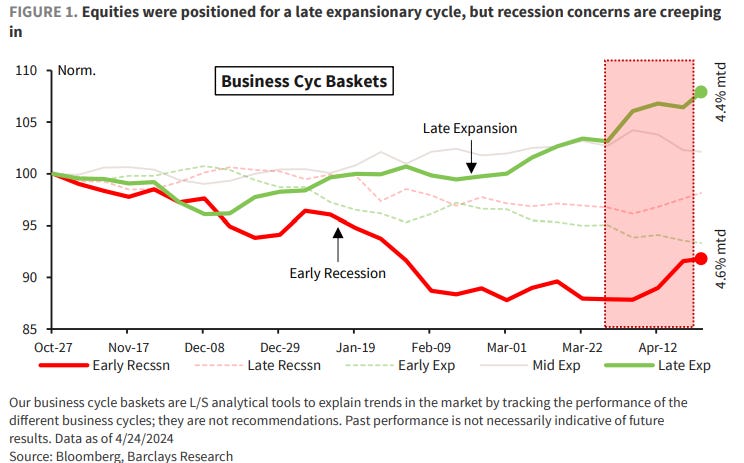
Our business cycle optimized long/short baskets suggest that, since the October 2023 lows, equity investors were geared up for a mid-to-late expansionary cycle. But April volatility reintroduced fears of a recession. Our "Early Recession" basket saw its biggest uptick in months especially given its negative exposure to cyc.
BMO: GDP +1.6%, Core-PCE +3.7%, Claims 207k - TSY cheapen
Q1 real GDP disappointed at 1.6% (lowest since 2Q22) vs. 3.4% prior and 2.5% consensus. Personal Consumption disappointed at 2.5% (lowest since 2Q23) vs. 3.3% last and 3.0% anticipated. Headline inflation was near estimates at 3.1% vs. 3.0% forecasted and 1.6% prior. The real surprise came in the form of the quarterly annualized core-PCE number which surged to 3.7% vs. 2.0% prior and 3.4% expected. The question has quickly become whether this is due to revisions from Jan/Feb or if tomorrow's monthly core-PCE report will reveal a strongerthan-consensus (+0.3%) print…
…Treasuries cheapened on the data; in keeping with the relevance of sticky inflation versus weaker growth. Stagflation chatter will surely pick up in the wake of these figures but we're less concerned with such an outcome as long as the labor market remains so strong (as evidenced by the 207k claims print). From here, we'll be watching the takedown of this afternoon's 7-year auction.
BloombergBNP US Q1 GDP: Strong inflation and demand may augment Fed patience
KEY MESSAGES
Stronger underlying details and signs of faster price inflation in the Q1 GDP report may heighten Fed officials’ caution about an initial rate cut.
Hotter-than-expected core PCE inflation raises upside risks to not only our estimate for March, but also our base case of a return to more benign prints in Q2.
The data also suggest a stall in productivity growth, leaning at least temporarily against the supply-side recovery story as a factor promoting disinflation.
Taken together, that means greater risk of a later start to Fed easing than our current base case of two cuts, in July and December.
Goldilocks: Q1 GDP Growth Slows to 1.6% Despite Solid Domestic Demand; Core PCE Higher Than Expected; Goods Trade Deficit Widens
BOTTOM LINE: Real GDP rose 1.6% annualized in the first quarter, well below consensus and our own forecast. The composition was not as soft, as inventories and foreign trade accounted for -1.1pp of our -1.5pp forecast error, and domestic demand growth proceeded at a strong pace of +2.8% annualized. The goods trade deficit widened in March, driven by a larger decline in exports than imports. Both initial and continuing jobless claims declined.
The recent hot inflation prints leading to a sharp hawkish repricing, together with concerns over rising geopolitical risk, resulted in a spike in implied volatility across assets. Even though the rates sell-off has been one of the main drivers of cross-asset performance, the level of rates volatility compared to that of equity volatility hasn’t reacted as much and has remained close to the YTD lows.
The relative level of rates vs. equity has been shifting lower since Q4 of last year, supported by a shift in macro fundamentals thanks to a moderation in rates and policy uncertainty, but also easier financial conditions. Under our baseline view of a constructive macro backdrop equity volatility should remain anchored with rates volatility resetting lower, but the risk of another rate shock is still lingering.
We are OW equities, N bonds/commodities/cash and UW credit in our asset allocation. After the recent increase in cross-asset implied volatility, we highlight three cross-asset overlay hedges with a focus on reducing cost compared to buying outright downside equity puts: longer-dated collars on S&P 500, selling downside on US bonds to fund equity puts, and equity down/Dollar up hybrids.
… Combining the two models reveals how the peak in rates vs. equity volatility in Q4 roughly coincided with the peak in its macro-implied level (Exhibit 6). Since then, the macro-implied gap has decreased thanks to a moderation in rates and policy uncertainty, but also easier financial conditions, thus supporting the reset in the relative implied volatility of rates and equities. There remains a gap between markets and the macro-implied level which is mainly due to rates volatility. Under our baseline view of slowing but solid US growth, continued disinflation progress and an eventual start of cutting cycles across DMs, equity volatility should remain anchored with rates volatility resetting lower (even though equity vol might reset faster in the near term).
Real GDP rose 1.6% vs. MSe 2.7%, while private domestic demand came in at 3.1% (MSe 3.2%). Headline GDP driven by slower consumption as well as big drag from trade and inventories. Private demand ticked down to 3.1% vs 3.3% prior. Core PCE prices saw a rise at 3.7% Q/Q.
… Strong growth and upward revisions to core PCE inflation in 1Q24 raises the risk of a more patient Fed. Core PCE inflation surprised to the upside for 1Q24, but upward revisions could come for any of the months. We continue to focus on the incoming data between now and the July meeting, where we expect core PCE inflation monthly prints at 0.2%.
… Longer term, our concerns about the US fiscal situation are rising. While the current strength of the economy has helped tax revenues, the fact is our expectations for any long-term improvement in the deficit are low. In addition, after the elections, the 2025 expiration of the Tax Cuts and Jobs Act of 2017 looms. In the near term, clearly the path of the Fed's QT will impact (we look at two scenarios), but over the long term the risks for more substantial increases of coupon issuance are rising…
RBC: U.S. GDP growth decelerated in Q1, but price growth ticked higher
… Bottom line: The U.S. economy grew at a slower pace at the beginning of 2024 than in the second half of 2023. But price growth continues to show worrying signs of reacceleration – particularly in the service sector where consumer demand remains exceptionally strong despite high interest rates. Recent labour market data indicated solid employment gains, and the unemployment rate remained low. However, there has been a slowdown in job openings and wage growth, signaling a shift toward a more balanced labour market. We continue to expect the economic growth to slow, but the Fed needs to see further evidence that inflation is sustainably slowing to the 2% objective before considering to a rate cut. As of now, our base case assumptions have the first rate cut to arrive in December this year.
Markets exhibited a naïve belief in the accuracy of economic data yesterday. US first quarter GDP will probably be revised stronger, and hinted at future consumer strength. The data does put more focus on today’s personal spending figures—and in particular the personal consumer expenditure deflators.
Yesterday’s GDP price measured showed non-durable goods price levels lower than they were at the end of last year. Durable goods price levels are lower than at any time in either 2023 or 2022. Inflation is purely a service sector issue. Financial services prices helped push up inflation. In part this is commissions, related to rising markets. US statisticians’ peculiar addiction to annualizing everything means the inflation headlines assume markets will continue rising at the same rate as in the first quarter. If they do not, this aspect of inflation will moderate…
Wells Fargo: Wolf in Sheep's Clothing: Soft GDP Hides Surging Spending
Summary Real GDP grew at only a 1.6% annualized pace in Q1, held back by trade and inventories. Consumer spending in the service sector is not slowing, in fact, it is ramping up at a rate seldom seen in the past 20 years. That is problematic as core PCE prices are picking up again in defiance of higher rates.
… The core PCE deflator rose at a 3.7% annualized rate in Q1, a notable acceleration after a sharp slowing the prior two quarters (chart). This data implies a strong 0.4% increase in March core PCE, set to be released tomorrow. Services excluding energy and housing rose at a 5.1% annualized rate in Q1, the fastest in a year…
…Check out the Treasury Inflation-Protected Securities ETF $TIP vs. the nominal US Treasury Bond ETF $IEF ratio zoomed out twenty years:
Monster base. But I don’t think of this ratio in those terms. Instead, I use it to gauge investors’ desire for inflation protection.
The perceived need to take action against inflation is heading back toward the upper bounds of a 15-year range, marked by the 2022 high and the end of the prior commodity supercycle in 2011.
Investors bracing for higher inflation makes sense as global yields rise and commodities climb.
Yet over the trailing three weeks, crude oil – the procyclical heavyweight – is turning lower while interest rates surge:
Three weeks is a bit tight for intermarket relationships. Nevertheless, there is a clear divergence.
A similar decoupling occurred last fall, with crude peaking ahead of the 10-year yield by roughly three weeks. (Both fell over the following two months.)
10 year Treasury moving to 4.75%. Why own bonds? T bills yield 5.25%
That post from former bond king Bill Gross speaks to the annoying reality for bond managers tasked with competing with cash: Why bother with the back half of the yield curve when Treasury bills have higher yields and no duration risk?
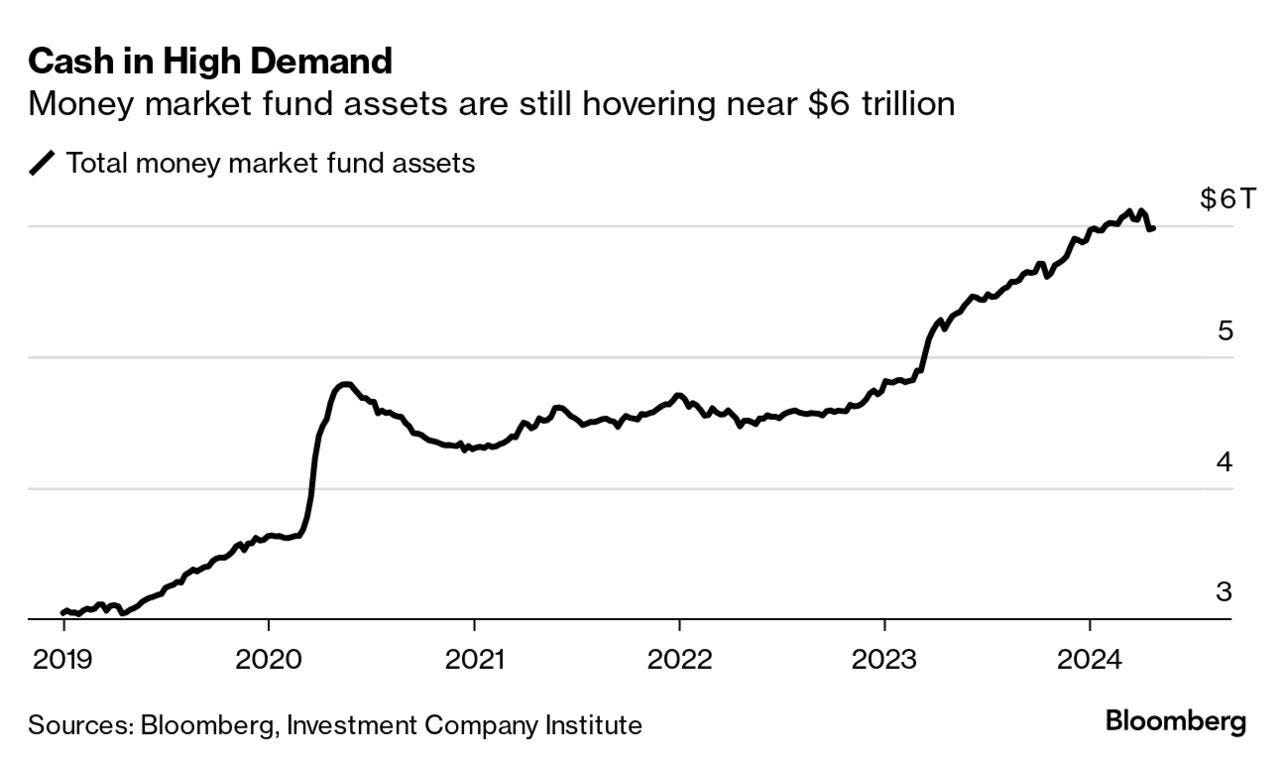
The kneejerk response would be to say something about reinvestment risk, but so far that’s held little water with investors. Money market fund assets are still hovering near $6 trillion, while ultra-short duration fixed income exchange traded funds have absorbed nearly $6 billion this month — the biggest haul since October.
BlackRock Inc. chief investment officer of global fixed income Rick Rieder seems to agree with Gross’s logic. He’s cut interest-rate exposure in the $2.9 billion BlackRock Flexible Income ETF, which invests in a mixture of corporate, mortgage and government debt.
Speaking on Bloomberg Television on Monday, Rieder said that the Federal Reserve will likely still be able to lower rates this year and make the long-end more appealing. But with services inflation still high, there’s no hurry to rush out the yield curve.
“Once you get visibility on a couple of good inflation reports — wages, employment staying contained — then you can start to extend your duration. The thing that’s key today is, why mess with it? Just keep your income high, your income exposure down,” Rieder told me on Bloomberg Television’s ETF IQ. “In the interim, just clip coupons and life is good. “
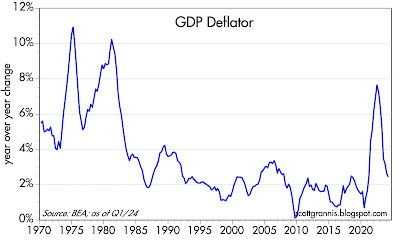
Chart #2 shows the year over year change in the GDP deflator, the broadest measure of inflation that exists. On a quarterly basis, the deflator grew at a 3.7% annualized rate, which was a bit higher than the market's 3.4% expectation. Does this qualify as "hot"? Hardly. On a year over year basis the deflator rose only 2.4% and there is every reason to think that it will continue to moderate over the course of this year, for the same reasons I have argued that CPI inflation will moderate.
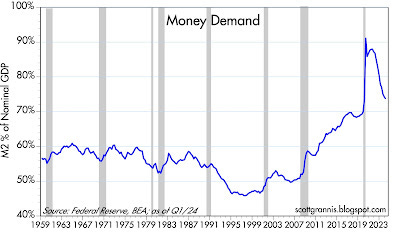
Chart #3 is my definition of money demand: M2 divided by nominal GDP. This is best thought of as the percentage of total income (GDP) that the public chooses to hold in the form of readily spendable cash (M2). Here we see that money demand—after surging in the wake of the Covid panic—is rapidly returning to what might be termed normal.
Chart #4
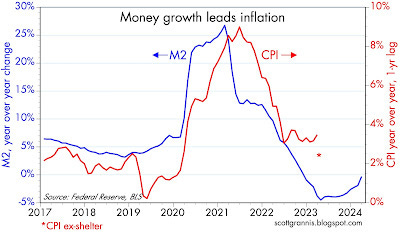
Chart #4 compares the year over year growth of M2 with the year over year change in the CPI, which has been shifted to the left by one year to suggest that there is a one-year lag between changes in M2 and changes in inflation. The red asterisk at the Mar. '24 mark is the rate of CPI inflation ex-shelter (seethis postfor a more detailed explanation). It would appear that the lag has lengthened a bit to perhaps a year and a half. That further suggests that given the decline in M2 we are likely to see further declines in inflation over the balance of this year.
… THAT is all for now. HOPE to have something out over the weekend before Sunday evening futures open … Off to the day job…


Defending the Republic
Good News Friday.....
https://substack.com/app-link/post?publication_id=726749&post_id=144034184&utm_source=post-email-title&utm_campaign=email-post-title&isFreemail=true&r=1ecjk0&token=eyJ1c2VyX2lkIjo4NDU2NjAxNiwicG9zdF9pZCI6MTQ0MDM0MTg0LCJpYXQiOjE3MTQxMzIxMjYsImV4cCI6MTcxNjcyNDEyNiwiaXNzIjoicHViLTcyNjc0OSIsInN1YiI6InBvc3QtcmVhY3Rpb24ifQ.3DsZ3CMemg5nJBA-w7bSs8KoHRIhjD0Tn66P3HKtaHc
Gallup Poll: Biden Worst President in Polling History
Not Surprising...............
https://www.newsmax.com/politics/joe-biden-poll-disapproval/2024/04/28/id/1162691/