while WE slept: USTs lower/steeper on light vol; NYCBs cut to JUNK (Moody's) on CRE concerns (which weren't of concern TO JPOW, Yellen); {GVLQUSD <index> GO}
Good morning … There is plenty of news which you will use but before we jump in … and ahead of this afternoons liquidity event (10yr auction), a visual …
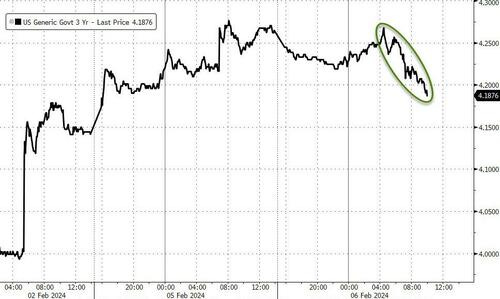
#Got10s … ?
… Yields have moved swiftly from overBOUGHT to overSOLD in nearly a click or two and — thankfully (?) — have done su just ahead of this weeks liquidity events!
Will anyone care / pay attention later on to CBO update which I’ve heard will detail how it is that we’re not barely covering interest payments on our nations debt … with our nations debt? I’m sure I’m misinterpreting the data and talking heads on TV but lets have a look at whatever it is the CBO releases later on today and see what, if any, similarities or things NOT of any concerns TO JPOW and Yellen…
I will say there are those out there concerned and one of my friends from my former work life sent me a visual just outta the blue.
No message of explanation just a BBG visual hitting my inbox at 155p … I’ve attempted to ‘enhance’ it so as to clarify but the message, which seems clear to ME …
subj: US Govt Securities Liquidity Index
Meanwhile, back at the ranch, any chance we could arrange another (or keep this) bank blowup FEAR going so as to get another good response (F2Q) bid for 10yy auction later today?
ZH: Bank Blow-Up 'Butterflies' Spark Bid For Bonds, Bullion, & Bitcoin
… Answer: maybe … Enter Moody’s Investor Services…
Moody’s Investor Services RATINGS ACTION: Moody's downgrades New York Community Bancorp's long-term issuer rating to Ba2; most ratings remain on review for further downgrade (thanks … thanks for this, guys)
NewYork,February 06, 2024 -- Moody's Investors Service (Moody's)today has downgraded all long-term and some short-term ratings and assessments of NewYork Community Bancorp, Inc.(NYCB, long-term issuer rating toBa2 from Baa3), and its lead bank,FlagstarBank, NA,(long-term deposits toBaa2 fromA3)including the baseline credit assessment to ba1 from baa2.Allratings, except short-term counterparty risk ratings, and assessments remain on review for further downgrade…
… In terms of financial strategy, the bank is seeking to build its capital but just took an unanticipated loss on commercial real estate (CRE) which is a significant concentration for the bank…
… NYCB is highly concentrated in rent regulated multi-family properties, a segment which has historically performed well forthem. However, this cycle may be different.While vacancy rates are low for this CREsegment, properties may face different challenges this cycle due to higher interest expense when refinanced and already higher maintenance costs due to inflationary pressures.These higher costs may prove more challenging for owners of rent regulated properties to pass along through rent increases to tenants.Beyond rent-regulated, the bank has a significant concentration of low fixed-rate multifamily loans.This type of loan portfolio faces refinancing risk
… AND then there’s this reCAPathon / snarky response …
ZH: New York Community Bancorp Cut To 'Junk' By Moody's: 33% Of Deposits Uninsured
… Never FEAR, JPOW and now YELLEN (if it’s Yellen you must be SELLIN’) are here
Bloomberg: Yellen Says Commercial Property Is a Worry, But Regulators Are on It CNN: Janet Yellen: Some banks may be ‘quite stressed’ by empty office building trouble
… Guessing Moody’s recently got long bonds (perhaps following along recommendations of couple from Global Wall (noted over past couple / few days and weeks)?
Lets HOPE (not a strategy) 10s go as well as 3yy and can / will do so without further KBW assistance …
The results from the week's first refunding auction are out and they were solid, with the Treasury selling $54BN in 3Y paper at a high yield of 4.169%, up about 6bps from last month's 4.105% but stopping 0.8bps through the 4.177% When Issued…
… The internals were on the strong side, with Indirects awarded 66.0%, up from last month's 65.3% and the highest since August, and with Directs taking 18.3% (up from 16.84% last month but below the recent average of 19.56%) Dealers were left holding 15.7%, the lowest also since August.
… The market welcomed the auction results, which were neither too cold nor too hot, and with yields sliding all session, the auction merely cemented the trend lower, at least until fears of more tightening and the endless supply coming down the pipe reverses the trend.
#Got10s?
… here is a snapshot OF USTs as of 705a:
… HEREis what this shop says be behind the price action overnight…
… WHILE YOU SLEPT Treasuries are modestly lower with the curve a hair steeper ahead of today's record 10-year Treasury auction and CBO's latest budget outlook. DXY is lower (-0.17%) while front WTI futures are higher (+0.95%). Asian stocks were mostly higher with China pacing the gainers, EU and UK share markets are modestly lower while ES futures are UNCHD here at 6:45am. Our overnight US rates flows saw better real$ buying in the front-end out to intermediates during Asian hours despite an afternoon fade in prices off their early, bank credit inspired gains. In London's AM hours it was a quiet session with another day of real$ accounts using orderly dips to buy and extend duration. Most of the demand we've seen is concentrated in the belly according to the desk. Overnight Treasury volume was ~85% of average- at least during London hours.
… and for some MORE of the news you can use » The Morning Hark - 7 Feb 2024 and NEWSQUAWK’s US Market Open (Equites tilt lower, Dollar flat and crude firmer; Fed speak and earnings from PYPL and UBER due … Bonds are divergent, though the overall trend is bearish ahead of US supply …) in effort to to help weed thru the noise (some of which can be found over here at Finviz).
Moving from some of the news to some of THE VIEWS you might be able to use… here’s SOME of what Global Wall St is sayin’ … from recently walked back CUT expectations (DB) to profitable shorts BOOKED (BNP) to this mornings cognescenti …
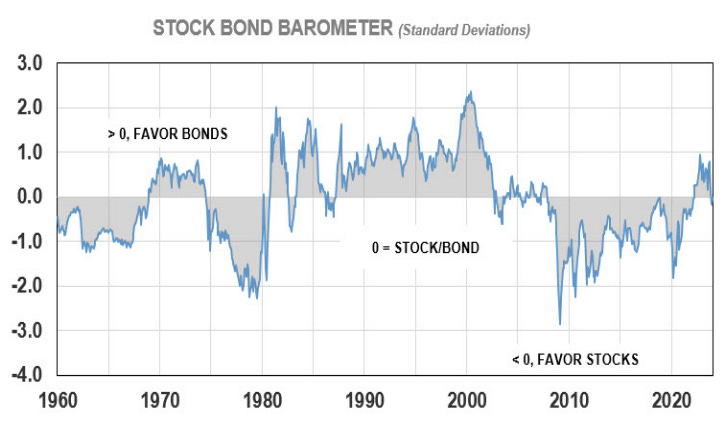
Argus: Stock, Bond Model Near Equilibrium (pick ‘em?)
Our stock/bond asset-allocation model, which we call the Stock Bond Barometer, is now indicating that stocks are the asset class offering the most value at the current market juncture. But not by much. The model takes into account current levels and forecasts of short-term and long-term government and corporate fixed-income yields, inflation, stock prices, GDP, and corporate earnings, among other factors. The output is expressed in terms of standard deviations to the mean, or sigma. The mean reading, going back to 1960, is a modest premium for stocks, of 0.16 sigma, with a standard deviation of 0.98. The current valuation level is a 0.04 sigma discount for stocks, which is now below fair value and down sharply from a 0.85 sigma premium at the end of 3Q. Other valuation measures also show reasonable multiples for stocks. The current forward P/E ratio for the S&P 500 is approximately 18, which is within the normal range of 10-21 and down from 23 at the end of 2021. The current S&P 500 dividend yield of 1.4%, while below the historical average of 2.9%, is up from an ultralow 1.2% also in 2021. And that current S&P 500 dividend yield is 35% of the 10-year Treasury yield, compared to the long-run average of 39% and the all-time low of 18% during 1999. We expect the results from our stock-bond valuation model to continue to improve, as interest rates head lower in 2024 and EPS growth picks up. Based in part on the output from our Stock Bond Barometer, our recommended asset allocation model for moderate accounts is 70% growth assets, including 68% equities and 2% alternatives; and 30% fixed income, with a focus on core and opportunistic segments of the bond market. On duration, we recommend focusing on the short end of the curve …
BNP US rates: Front-end longs amid above-trend growth
The strength of underlying US economic growth argues for some caution in trying to fade the recent reset in US yields, but we think there are some sensible formats for a long exposure at the front end of the curve.
The market discounts ~63bp of cumulative Fed rate cuts by July; we don’t see this as all that compelling an outright receive but think pairing SFRM4 longs with selling an out of the money call offers good risk/reward.
We think real rates are a better format for outright front-end longs than nominals: outcomes where the Fed cuts by less than is priced are likely to correspond to higher-than-priced realized inflation.
Trade idea: Buy SFRM4 at 95.165 vs sell SFRM4C 95.375 at 0.15. Target: +20bp return. Stop: -8bp return. Carry: -10bp/1mth. Allocation: 50k/bp.
We expect US headline and core CPI to rise by 0.2% m/m and 0.3%, respectively, in January (placing them in y/y terms at 2.9% and 3.8%). Goods prices are likely to decline for an eighth consecutive month, while services inflation should stay more resilient.
Updated seasonal and weighting factors – to be released this coming Friday – will likely translate into a slightly stronger inflation profile this year than would have prevailed otherwise.
While we see inflation remaining above target this year, we think the next three CPI and PCE prints will largely mirror the prior six, paving the way for the Fed to cut rates in May.
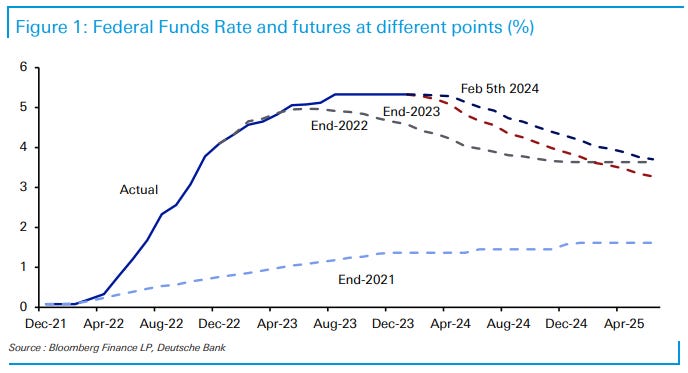
DB Mapping Markets: 5 Hawkish Risks to the Outlook
The last week has brought a lot of hawkish developments, leading markets to push back the timing of rate cuts from central banks. But there’s a risk that this process still has further to go. After all, this current cycle has seen investors consistently price in outcomes that were too dovish. And in 2024 so far, we have seen a pattern of upside surprises on growth, along with easier financial conditions, which will make it more difficult for central banks to ease policy. In light of this, we run through the factors that could mean a dovish pivot is delayed once again…
5 Hawkish Risks to the Outlook 1. Investors have consistently priced in dovish outcomes too soon in this cycle.
2. Financial conditions have become increasingly accommodative in 2024 so far, which will help to boost growth prospects. 3. Growth indicators have continued to surprise on the upside in 2024 so far. If that continues, it will likely reduce the need for rate cuts 4. Inflation is still above target across the major developed economies, with several indicators pointing to ongoing price pressures.
5. Central bankers want to avoid a cycle of rate cuts that is soon reversed, like what happened in the 1970s. So they’ll want to be sure that inflation is durably under control before pivoting towards cuts…
… US Treasury Secretary Yellen commented on commercial real estate and the financial system. Changing working patterns and consumption habits, along with new environmental standards, have turned some real estate into stranded assets. Yellen was cheerleading the financial sector, inevitably, but this is a long-term adjustment for many economies…
Wells Fargo: Should We Worry About American Debt?: Time to Reconsider? - Part II (hint: yes)
Summary
We focus on the household sector in the second installment in our five-part series on total U.S. debt. Household debt stands more than $5 trillion higher today than it did at the commencement of the global financial crisis. However, growth in household income has significantly outpaced growth in debt over that period. Consequently, the household sector is less leveraged today than it was in 2008.
Mortgages account for 70% of total household debt, and the vast majority of mortgage debt was originated at fixed rates. Underwriting standards for mortgages are considerably tighter today than they were during the housing bubble. Nearly 70% of the mortgages that have been originated in recent years have been to homeowners with FICO scores that are "very good" or "exceptional."
The amount of student loan debt has ballooned in recent years, but more than half of borrowers have less than $20K worth of student loan debt. The delinquency rate on student loans, which had been depressed because of the moratorium on payments that Congress approved during the pandemic, undoubtedly will move considerably higher later this year now that the moratorium has ended.
Auto loans have also grown considerably in recent years. The delinquency rate on auto loans has trended higher, although it remains below rates that prevailed prior to the financial crisis. The outstanding amount of revolving credit has also grown significantly over the past decade or so.
Deleveraging since 2008 and the trend decline in mortgage rates that occurred until 2021 has led to a significant decline in the debt service ratio for the household sector. The amount of amortization and interest payments that the household sector must make, as a percent of its disposable income, essentially sits at the lowest ratio in at least 40 years.
The financial position of the household sector, in aggregate, appears to be generally solid at present, although younger and less affluent households may be starting to experience some financial stress.
… So, just like I feel comfortable stocks are setting up for a BIG MOVE down (now or soon’ish) I feel pretty good that the low we made was the end of a 5 count move. If not, then we finsihed a 3 down around 84 and we have another move down below 84. Who knows …
But, given that I am “correct” I have put realistic target up there because, in this current environment, the TLT could go all the way up to 180 and STILL be against the “trend” which – I believe started w/ the high back a couple years ago.
And that, for me, is the key … that was a huge thumping and, the ‘look and feel’, tells me this isn’t going to be ‘easy’ or ‘cut and dry’ – can you President Biden enjoying the FED “raising rates” during and election year? Or, certainly would love for him to “cut rates” and how in the world , seriously, is he going to do that …?
So, this was a GREAT run down in TLT -in which I played LONG TBT and still long and hold a position – but from a “time” perspective I just think we need more TIME so I’m looking to BUY TLT after I see what happens at 91.18…
Bespoke: Do It for the Gipper (Reagan and TLT? what could possibly be better?)
“Government is like a baby: an alimentary canal with a big appetite at one end and no sense of responsibility at the other.” – Ronald Reagan
…Today would have marked the 113th birthday of former president Ronald Reagan, and besides being the leader of the free world for eight years, Reagan’s acting career was highlighted by his role in Knute Rockne – All American, where he played the lead role of Knute Rockne, coach of football at Notre Dame. Knute Rockne was famous for his ”Win One for the Gipper" speech, which he gave at halftime in a game against Army at Yankee Stadium in 1928. The team was having a terrible season, and living up to their Fighting Irish nickname they were not. Inspired by the pep talk, Notre Dame came out and scored two second-half touchdowns to stun Army by a score of 12-6. If there’s any part of the market that could use a Rockne boost right about now, it’s small caps.
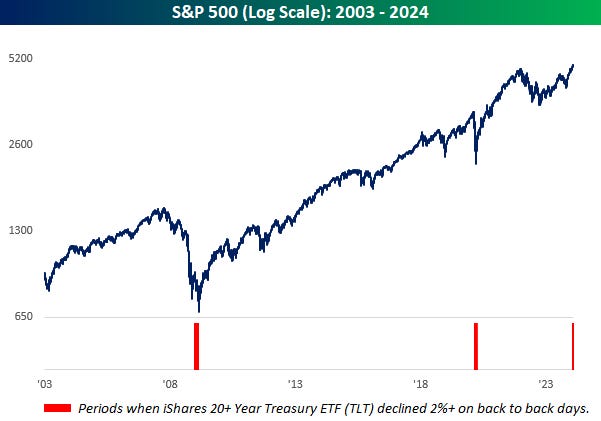
Well maybe not just small caps. Just when you thought it was safe to get back in the 60/40 pool, long-term US treasuries have found themselves getting bombarded in 2024. Year to date, the iShares 20+ Year US Treasury ETF (TLT) is already down over 4%. Long-term treasuries sold off throughout just about all of January, and while they rallied in the last days of January and to kick off February to get back to even, the two trading days since last Friday’s employment report have been painful. TLT has experienced back-to-back declines of over 2%, taking it back below both its 50 and 200-day moving averages and perilously close to breaking the loose uptrend that emerged from the October lows.
Consecutive declines of over 2% hurt no matter what the asset class, but the sting of two declines of that magnitude for treasuries hits hard. Since TLT started trading in late 2002, there have only been two other periods where the ETF experienced back-to-back 2% declines, and they occurred at the two most volatile periods of trading in the last two decades – late in the Financial Crisis (January 2009) and within days of the Covid lows. As everyone remembers, those two prior periods both ended up being massive buying opportunities for the equity market, but they also occurred after very large declines in stocks. Right now, the S&P 500 is within half of one percent of an all-time high. Extreme volatility in the treasury market with the VIX under 14? You don’t see that often, but then again, there’s a lot that has happened in the last four years that wouldn’t get filed in the normal folder.
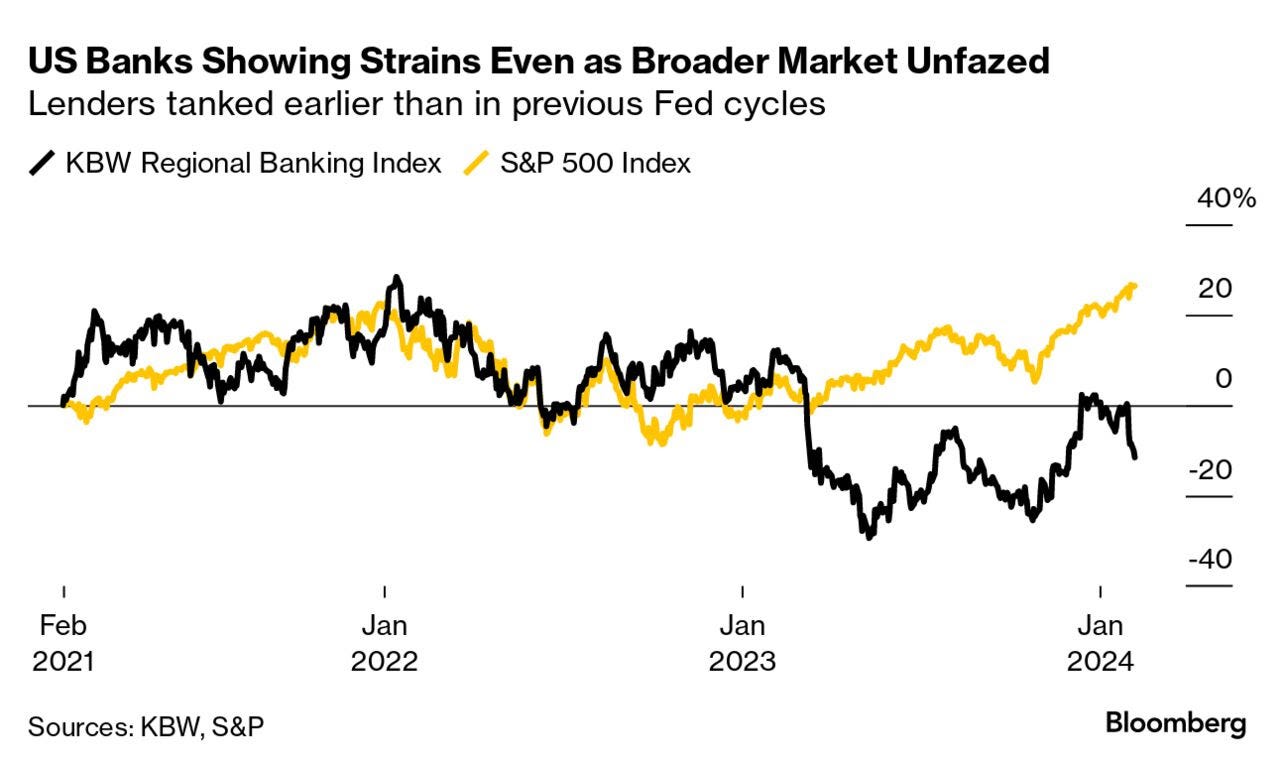
Bloomberg’s 5 Things You Need to Know to Start Your Day: Asia (banks showing strains…)
… New York Community Bancorp sank further Tuesday, helping to drag down the KBW Banking index. The financial sector continues to show signs of strain amid the Federal Reserve’s most severe tightening cycle in a generation. The broader market, meantime, continues to shrug off any concerns that the lenders’ woes might have any wider impact.
Banking stocks have tended to underperform as Fed cycles peak, acting as something of a canary in the market coal mine. This time around, however, the sector broke downward well before the US central bank stopped hiking interest rates. That’s partly perhaps because the Fed raised rates so rapidly this time around. It also could owe something to the long, long inversion of the yield curve. Banks borrow short to lend long, so it’s not a great look when shorter-dated costs remain above longer-term income rates.
The Fed also managed last year to isolate the banking sector’s woes by increasing liquidity and instituting a stopgap measure that meant lenders could avoid booking losses on government bonds they had to hold — bonds that had dropped in price as the central bank hiked rates. That measure will expire next month, but the broader US market’s willingness to look past the current woes afflicting banking shares makes it appear that investors are confident the Fed will do whatever it takes to avoid contagion.
Bloomberg(via ZH): Option Traders Might Be Making It Easier To Get A Bank Loan (oh, ok thats good at least we’ve got THAT going for us …)
… One way is by encouraging banks to ease credit. As the chart below shows, there is a close relationship between net percent of banks tightening commercial and industrial (C&I) loan standards and credit spreads. The first is quarterly data, but credit spreads are real-time. Banks are likely influenced on how easy they want to make it to get a loan by looking at credit markets.
In markets, greed typically ensures trades blow up rather than fading noiselessly from view.
Perhaps the easing of bank credit will mean a credit crisis is ultimately averted.
But it’s hard to be confident of that call when vol-selling could go belly up, as it has several occasions before.
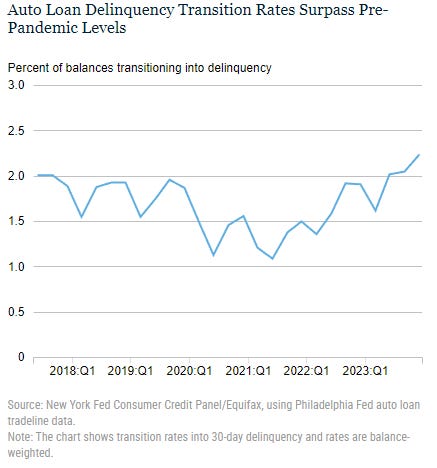
… Household debt delinquencies reached historic lows during the pandemic period, thanks to forbearances on mortgages and federal student loans and stimulus payments. But as forbearances ended and the savings from stimulus payments were exhausted for many households, delinquency rates have been rising again, for all types of debt. The chart below shows the percentage of auto balances newly transitioning to delinquency. Both auto loans and credit cards have seen particular worsening of new delinquencies, with transition rates now above pre-pandemic levels. [Note that the subsequent analysis uses a loan-level data set drawn from the Consumer Credit Panel by the Philadelphia Fed. While similar to the individual-level data used for the Quarterly Report, this alternative loan-level data permits finer analysis by vintage and loan origination amount. Due to some different inclusion criteria, aggregates from tradeline data may differ slightly from those in the Quarterly Report.]
ZH: New York Community Bancorp Collapse Nears 27-Year-Lows After 'Talks With Regulator' Revealed
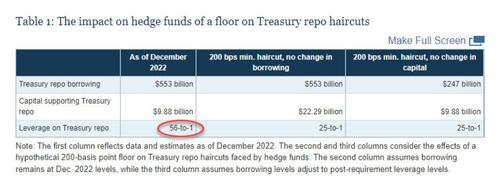
ZH: SEC Cracks Down On Basis Trades, Will Force Top Hedge Funds To Register As Dealers, Resulting In Collapsing Treasury Market Liquidity
… The new rules would apply to many trading firms that earn revenue from capturing bid-ask spreads, or those that express interest at or near the best available prices on both sides of the market for the same security. Those that manage $50 million or less in assets would be exempt, according to the commission. Of course, those firms are irrelevant, and the ones that do matter are the multistrat hedge funds which have allocated hundreds of billions in regulatory asset (really leverage) to arbing the Treasury cash-futures basis - hedge funds are long the underlying cash TSY and short the TSY future in one giant basis trade hence the name - and capitalizing on tiny mispricings.
Some of the hedge funds that are the most aggressive in basis trading are the who's who of multi-strat and "pod" names such as Millennium, Citadel, Balyasny, Point73 and Exodus Point. As shown in the chart below, the top 5 names collectively sport over $1 trillion in regulatory assets, which represents 6.3x regulatory leverage on their underlying net assets!
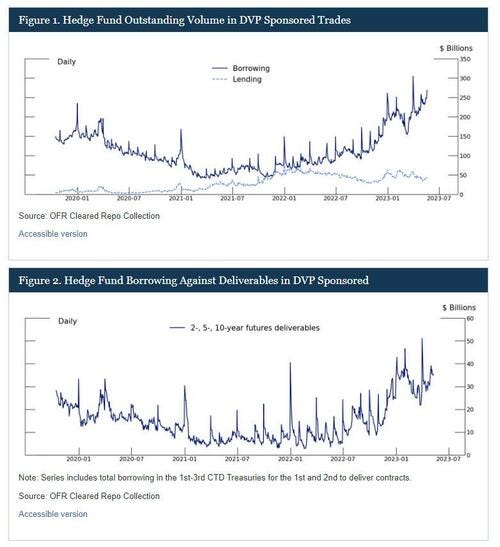
… According to the TBAC, recent research from the Fed suggests that the basis trade has grown in size lately, similar to levels seen in 2018-2019. They cite the futures data, but also show some evidence from the sponsored repo market and collateral posting data, shown below:
Another piece of research released in September of 2023 quantifies the basis trade at $550BN. The authors used data from form PF, and the size seems fairly consistent with size of futures exposure at the time.
Bottom line, the TBAC writes, "estimating size of relative-value AUM is hard especially as a large portion of capital pursuing these strategies may be embedded in multimanager hedge-funds, where little public data on sub-strategy allocations is available."
… For its part, the SEC has maintained that registering is necessary because firms that make up such a large amount of Treasuries trading volume Bloomberg reports. The regulator said the plan will ensure that firms engaged in similar activities are regulated in a similar way as many firms active in the market are already labeled as dealers.
The rule, which was adopted after a close 3-2 vote, will go into effect 60 days after publication in the Federal Register. Companies would have to comply with the registration requirements one year after that date. At that time, liquidity in the bond market may disappear.
The full must-read TBAC basis trade presentation is below (pdf link).
My mind always feels sharper, I always feel more intelligent after reading your daily, thanks! At times there's items that leave a sour taste (YELLEN!), thus it's now Coffee Time!


My mind always feels sharper, I always feel more intelligent after reading your daily, thanks! At times there's items that leave a sour taste (YELLEN!), thus it's now Coffee Time!