(Good = bad?) morning … Geopolitical turn of events pushing ‘Earl prices HIGHER combined WITH data out yesterday certainly making it tougher for the Fed … Note any / all sourced articles about strike against Iranian consulate in Syria o/n …
CNN: Iran vows revenge as it accuses Israel of deadly airstrike on Syria consulate in deepening Middle East crisis
… and it’s consequence ON ‘Earl as well as rest of global macro and you get sense of importance.
Next consider if you will, that NAPM (um, sorry, dating myself … I meant ISM) …
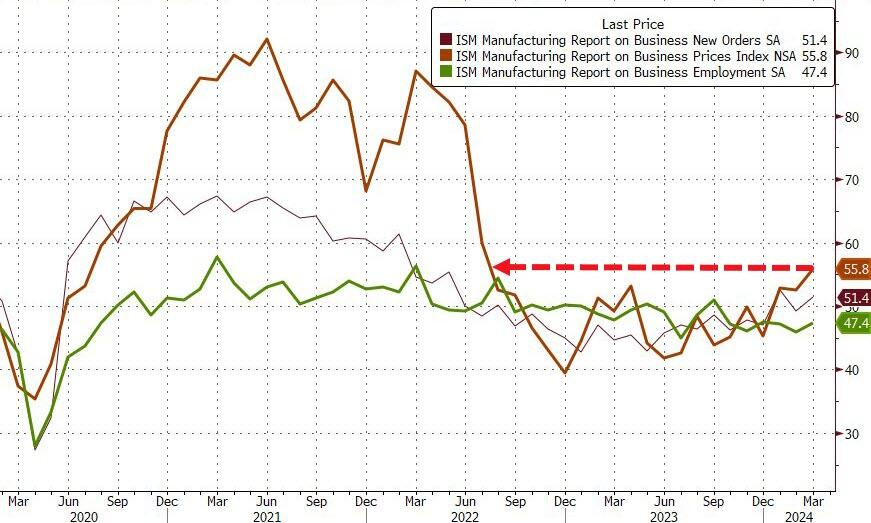
ZH: Disinflation Narrative Dies As Manufacturing PMIs Show Prices Soaring Most In 20 Months
…However, a common theme from both surveys was that of soaring prices!!
S&P Global noted that higher oil and raw material costs, plus increased transportation rates, reportedly added to cost burdens at the end of the first quarter... and the impact of rising labor costs was mentioned as a factor pushing up selling prices at a number of manufacturers.
Employment remains in contraction for the sixth straight month and Prices Paid surged to its highest since July 2022...
Ok SO yesterday in a couple / few words: GOOD = bad, TLINES lives matter.
That’s all. You should really stop reading as what follows isn’t really necessary and will most likely add absolutely NOTHING to the debate.
Some fancy words from Global Wall might be offered. Victory laps and recaps.
But at the end of the day, in this space yesterday before the NAPM data, I noted 2yy as overbought and this was on heels of JPOW reiterated … the Fed doesn’t need to be in a hurry to CUT rates.
Really? Really. Then … NAPM ISM made the point. Somewhat more …
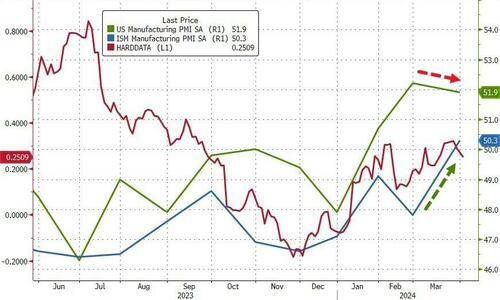
ZH: Manufacturing PMIs Mixed On Growth But Both See Prices Soaring (see whatever you wanna see but…try not to miss this?)
… there is normally something for everyone in this data as last month saw ISM's data tumble while S&P Global's soared. Both were expected to improve marginally in March final data today.
ISM's Manufacturing PMI surprised to the upside, rising from 47.8 to 50.3, better than the 48.4 expected (breaking a 15-month streak below 50).
But, S&P Global's US Manufacturing PMI disappointed, falling from its 'flash' print of 52.5 to 51.9 - also down from the final print of 52.2 in February (with prices .
Source: Bloomberg
However, a common theme from both surveys was that of soaring prices!!
… and so it goes from ONE TLINES / extreme / test to another (see HERE for yesterday’s visual of 2yy for more Meanwhile …
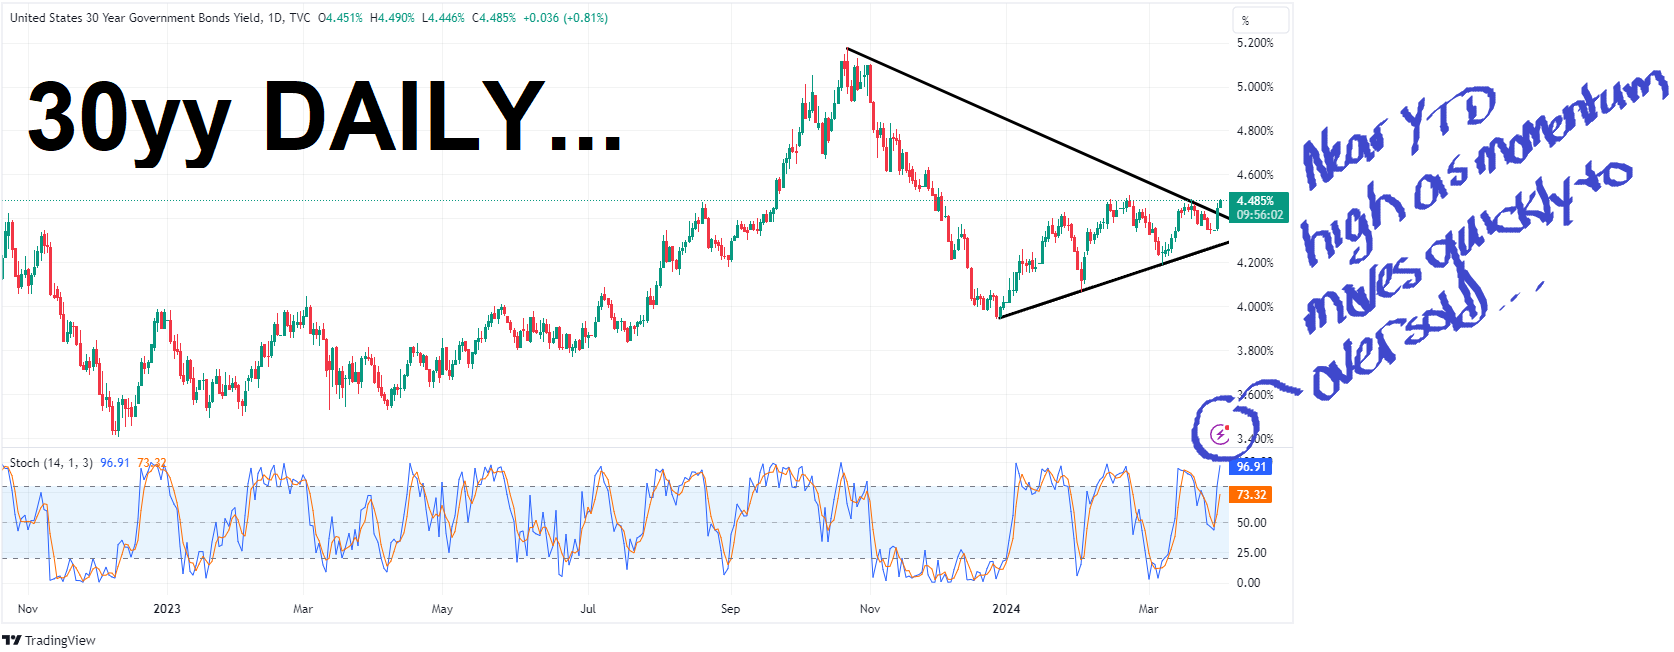
30yy: nearing in on YTD highs …
… here is a snapshot OF USTs as of 702a:
… HEREis what this shop says be behind the price action overnight…
… WHILE YOU SLEPT Treasuries are lower with the curve steeper as key range support levels in 5's through bonds are being tested/taken out this morning (full discussion about this below). DXY is a hair lower (-0.06%) while front WTI futures are higher (+2%, see attachment). Asian stocks were mixed, EU and UK share markets are also mixed this morning while ES futures are showing -0.18% here at 6:30am. Our overnight US rates flows saw Treasury prices little changed during Asian hours with real$ buying in intermediates noted. Prices were little changed into the London crossover when we saw good demand from a variety of real$ accounts in intermediates out to the long-end. Once the buying subsided, yields spiked higher and through key range support levels in 5's through bonds. Overnight Treasury volume was very strong at ~2x average with Europe and the UK back from holiday.
… The price set-ups in Treasuries look locally bearish to us. Some months ago we dared to get into a discussion in these pages about Ascending Triangles. We did so because they're typically reliable [bearish] indications of where the underlying pressures lie for bond prices. As we told a client yesterday, the trick is to flag the technical warnings emanating from such price action without losing readers' attention. But hear us out. The textbook definition of a so-called Ascending Triangle is here: Investopedia In the links' text, the authors describe the Ascending Triangle construct this way: "The upper trendline must be horizontal, indicating nearly identical highs, which form a resistance level. The lower trendline is rising diagonally, indicating higher lows as buyers patiently step up their bids." The Investopedia people wrote this with prices in mind, not yields, so the ramifications are the opposite of the description when using yield charts. Anyway, what the Ascending Triangle in a rates chart represents is two things: 1) The incumbent bear trendline marked by successively higher yield lows is the dominant trend and 2) There is a 'barrier of demand' evident at the flat top- such as the 4.34% range support level observed in Tsy 5's and 10's lately (~4.47% in 30yrs too). We're at these supports as we write. The whole idea is that each test and re-test of support (like 4.34% 5's and 10's) chips away at that barrier of demand. Once the buyers at the level are sated, the ceiling/support gives way, the bear trend re-asserts its dominance and yields rise to seek out the next support level. Our near-term concern for bonds is based on this exact set-up; one evident across a host of US duration benchmarks.
Our first two attachments this morning show textbook quality Ascending Triangles. We've used black lines to sketch out the ascending triangle in Treasury 5yrs along with our guess as to where the next support for 5yrs (~4.53%) might be found- if or when the 4.34% support line is breached…
… and for some MORE of the news you might be able to use…
NEWSQUAWK: US Market Open: Equities mixed, DXY around 105 and Crude bid following US/Chinese PMIs & geopols; US JOLTS & Fed speak due … Bonds are mixed, USTs are flat and hold near post-ISM lows, whilst Bunds play catch up; a modest dovish reaction was seen following German state CPIs
Finviz (for everything else I might have overlooked …)
Moving from some of the news to some of THE VIEWS you might be able to use… here’s SOME of what Global Wall St is sayin’ … in more formal terms than GOOD = bad, which I noted above …
Argus Market Watch: Daily Spotlight - Monday, April 1, 2024 (2nd best mo comin’…)
April is Often Good for Stocks
Historically, April is the second-best month of the year for stocks. The average gain for the S&P 500 in the month of April since 1980 is 1.70%. We note that market returns in April have exceeded 5% on eight occasions since 1980, including a 9.4% gain in 2009 (as the market was beginning to recover from the financial crisis of 2007-2009), a 12.7% surge in 2020 (as the market started to recover from the onset of the COVID-19 pandemic), and a 5.1% gain in 2021 (as COVID-19 vaccines were rolled out). There also have been some clunkers, including 2002 (-6.1%), 2000 (-3.1%), and 1981 (-2.3%). Last year, stock prices in April increased 0.9%. April is a busy month on Wall Street, as companies report first-quarter results. This year, 1Q earnings are expected to grow for the third consecutive quarter, as the economy continues to expand. Investors will focus on the income statements of the Technology companies, which have led the rally. Interest rates will be an important topic well, as markets process the latest readings related to inflation and also prepare for the Federal Reserve's next meeting at the end of the month. As long as interest rates remain under control, stock investors may be able to build off their 1Q gains.
The ISM manufacturing PMI bounced into expansionary territory in March, the latest sign that weak readings for some economic indicators at the turn of the year were idiosyncratic. Renewed strength in new orders and production was accompanied by firmed input prices, consistent with the leveling trajectory of goods prices…
…The prices paid index moved further into inflationary territory, once again suggesting that deflationary pressures for goods are largely behind us…
BARCAP Cross Asset Research: Does the RRP Matter for Risk Assets? (this note worth the price of admission … agree or NOT with conclusion, things are far better NOW than they were in 2018 …)
We argue that while there is concern about an empty RRP and shrinking reserves, history suggests movements in equity prices and corporate bond spreads are independent from the level of bank reserves. Moreover, we do not expect reserves to become scarce this year.
… The direction of rates is more important than reserve scarcity for equities. Similar to what we found for credit, there is no correlation between equity returns and changes in bank reserves once reserves become scarce. Valuations were stable through the 2019 funding shock as well. While the early part of our test period captured the large 4Q18 selloff in US equity markets, we would argue that this was more attributable to hawkish Fed surprise that predated the onset of peak reserve scarcity – a fairly remote concern with regards to the current policy outlook.
In summary, RRP depletion is unlikely to be a headwind for risk assets. In our view, reserves rolling off the peak matters less for risk assets than the Fed's accidentally discovering the minimum level of liquidity to keep markets functional, which we believe it has no interest in doing. Should funding market barometers such as the FF-IORB spread, domestic bank borrowing in the fed funds market, or peak daylight overdrafts begin to show signs of stress, we would expect the Fed to act quickly in response…
… Similar to what our credit colleagues pointed out, there was a meaningful equity market sell-off in 4Q18, when bank reserves were beginning to become scarce, according to our FF-IORB spread metric. However, we would argue that this was more a product of hawkish Fed rhetoric than of burgeoning scarcity of bank reserves, strictly speaking. The S&P 500 fell from what was then an all-time high in September 2018 into a technical bear market within the span of two months, as the Fed seemed determined to continue to tighten into slowing growth and a worsening US-China trade war.
Yet the index turned around to deliver a ~29% rally the following year, despite fairly lackluster earnings, after the central bank abruptly halted rate hikes and QT early in 2019, turning to cuts before 3Q19 was out. The 2019 rally was largely unimpeded by the September funding shock, which was perhaps the most acute example of market disruption arising from tighter financing markets, making us incrementally confident that reserve scarcity is not the biggest factor for equities in this equation…
We estimate a noticeable slowdown in the pace of US job creation in March, albeit to a still-solid 180k. We see the unemployment rate edging down to 3.8%.
Significant downward revisions to past payroll growth and recent labor market flows suggest that finding a job is becoming harder, meaning that recent hot prints may have overstated the underlying pace of job gains.
With working hours normalizing from winter’s weather-related swing, average hourly earnings growth will likely return to the 0.3% pace that prevailed in 2023. This would result in y/y growth declining to a new post-pandemic low – an important signal to Fed policymakers of scope for continued disinflation.
CitiFX Techs - US Treasuries: Holding the range (after yesterday, which was quite a day, respecting TLINES and disrespecting other TLINES …)
US treasuries are testing strong technical levels at which we have seen dip-buying interest in both February and March. Barring strong prints across all three labour prints (JOLTS, ADP, NFP), we think the recent range is more likely to stay intact.
US 2y yields: Resistance at 4.74%-4.77% is exceptionally strong, consisting of February and March 2024 highs, December 2024 high, well as the 200d MA which we have tested twice this year.
Our base case is for a bounce off the 4.74-4.77% resistance level and a retracement towards support at 4.52% (55d MA).
In our risk case, IF we see a break higher on a weekly basis, it would open the door to a move towards 4.98% (November 27 high, 76.4% Fibonacci retracement).
…US 30y yields 30y yields have bounced higher from the 55d MA, setting up a morning star formation. However, we think a further rise could be limited given that we are testing the February and March 2024 highs at 4.49%-4.50%.
Subsequent resistance is at 4.63% (November 27), while support is at 4.36% (55d MA).
DBDaily - Bonds sell off after solid beat on US ISM (a visual relationship between ISM and GDP and why we all care …)
…Chart of the day
DB: Early Morning Reid (on rate CUT pricing moves…)
… Fed funds pricing of a June cut neared fifty-fifty intra-day yesterday after the ISM print before closing at 62%. That’s down from just over 70% this time yesterday and 77% last Wednesday, prior to hawkish comments from Fed Governor Waller.The amount of Fed cuts priced by year-end fell to 67bps, its lowest since the end of October, pricing out half of a 25 bps cut since last Wednesday…
DB: March and Q1 2024 Performance Review (on bonds loss in Q1…)
… Whilst risk assets performed well, it was a much weaker quarter for sovereign bonds. That was mainly down to upside surprises on inflation, with US core CPI at +0.4% in both January and February. Moreover, oil prices continued to rise, with Brent crude up +13.6% over Q1 to $87.48/bbl. And, there were signs that investors were raising their inflation expectations as well, with US 2yr inflation swaps up by +37bps to 2.42%, marking their biggest quarterly increase in two years…
… Which assets saw the biggest losses in Q1? Sovereign Bonds : With more signs of inflation persistence and central banks pushing out the timing of rate cuts, sovereign bonds mostly struggled. That included US Treasuries (-1.0%), Euro Sovereigns (-0.7%) and UK Gilts (-1.8%)…
Goldilocks: ISM Manufacturing Rises Into Expansionary Territory; Construction Spending Decreases; Lowering Q1 GDP Tracking to +2.0% (wait, what? so good news was actually bad? data OUT meant lowered GDP?)
BOTTOM LINE: The ISM manufacturing index increased back into expansionary territory in March, above expectations. The composition of the report was strong, with increases in the new orders, production, and employment components. Construction spending decreased in February, against expectations for an increase, and growth was unrevised in January and revised down in December. We lowered our Q1 GDP tracking estimate by 0.1pp to +2.0% (qoq ar). Our Q1 domestic final sales forecast stands at +2.6% (qoq ar).
NatWEST: US Manufacturing ISM Index (March … a better than avg longer-term visual)
The March ISM manufacturing index was better than expected, with the headline composite index back into positive territory for the first time since August 2022. The composite headline index rose to 50.3 versus our forecast of 48.0 (consensus 48.4). The details (discussed below) within the report indicate some renewal in manufacturing sector momentum towards the end of Q1(24). The survey report also noted that "The past relationship between the Manufacturing PMI® and the overall economy indicates that the March reading (50.3 percent) corresponds to a change of plus 2.2 percent in real gross domestic product (GDP) on an annualized basis." (Note: Our Q1 real GDP growth estimate is still a 2.5%q/q, annualized rate. The Atlanta Fed raised their Q1 tracking estimate to 2.8% from an earlier 2.3% pace.) The anecdotal portion of the report was also generally upbeat, with most sectors expecting firmer orders heading into Q2(24). (See select respondent comments below.) Still, we're reluctant to say the manufacturing sector is fully out of the woods yet, as the Fed's earlier tightening cycle could still weigh on activity.
The UK British Retail Consortium’s shop price index exhibited more disinflation than had been expected, with prices rising 1.3% y/y. This measure does include the discounting applied to loyalty card holders in the two-tier pricing system (consumer price inflation excludes this), and retailers have been keen to shore up customer loyalty with selective discounts as resentment about profit-led inflation has increased…
… US February factory orders are expected to show an improvement. Unusually, these figures are quite often revised lower (the tendency is to revise economic data stronger over time). The JOLTS data on job openings are also due. Job openings should continue to decline as people get over their mid-life crises and stay with their employers. However, new recruitment methods may mean job opening levels are structurally higher.
Wells Fargo: ISM Manufacturing Index Breaks Higher
Summary The ISM manufacturing index broke above 50 for the first time in sixteen months as manufacturers grow more optimistic. Activity is finding firmer footing with current production and new orders higher. But the tick higher in manufacturers' prices paid highlights the increased importance of a slowdown in services inflation for the Fed.
Wells Fargo: Wedge Issue (no, not a note about lettuce …)
What's Driving the Gap Between CPI and PCE Inflation?
Summary Progress in reining in inflation is further along by some measures relative to others. The gap between the two most prominent measures of U.S. inflation—the Consumer Price Index (CPI) and PCE deflator—is unusually wide at present. At 3.8%, the year-over-year rate of core CPI sits a full percentage point higher than core PCE inflation compared to a historical gap of 0.3 points. In this report, we discuss key differences in the construction and use of CPI and PCE indices, the drivers of the current wedge and what it could mean for the path of interest rates ahead.
The CPI may be a more familiar measure of inflation than the PCE index given its long history and frequent use in price contracts. However, the FOMC benchmarks its 2% inflation target to the PCE deflator, making it more relevant for the path of monetary policy.
The CPI and PCE index move closely together over time but can temporarily diverge due to differences in construction. The CPI focuses on consumers' direct expenditures paid for out-of-pocket. That makes it narrower in scope than the PCE index, which includes the cost of items purchased on behalf of households and purchases furnished without payment. The wider scope of the PCE leads to different category weightings, most notably for healthcare and housing. Different formulas and sources also contribute to the variation in reported price growth.
On a categorical basis, housing has been by far the largest source of the inflation wedge the past year. While primary shelter inflation is up a little less than 6% by both the CPI and PCE index, it carries 2.5x the weight in the core CPI. As a result, primary shelter has contributed 1.5 percentage points more to the year-over-year rate of core CPI than core PCE. Motor vehicle insurance is also providing an unusually large boost to core CPI. In contrast, strength in services categories more heavily weighted in the core PCE index, such as healthcare, or out of scope of the core CPI, such as food services or nonprofit institutions, have helped to narrow the chasm between core CPI and core PCE the past year.
We anticipate the gap between core CPI and core PCE when measured on a year-ago basis to remain uncharacteristically wide through the first half of 2025. Bringing the gap back down to its historical realm of 0.3 points will hinge heavily on shelter inflation returning near its pre-pandemic pace, which we estimate will occur around next spring. Slower growth in the CPI measure of motor vehicle insurance now that premiums have increased more than vehicles and repair service costs should also help to bring core CPI down closer in line with core PCE.
We do not believe the inflation wedge is an issue for the FOMC. Fed officials continue to espouse optimism that shelter inflation, the most significant contributor at present, will ease further in the coming months. And although large, the current wedge between core CPI and core PCE is not unprecedented. A similarly sized wedge opened up in the late 1990s and in 2001 and 2009. As the pricing environment cools from its extreme state, the gap should diminish as well.
… The more marked improvement in PCE inflation over the past year relative to CPI has led to an unusually wide gap between the two most prominent measures of U.S. inflation (Figure 1). Since 2000, the core CPI deflator has run an average of 0.3 percentage points higher than the core PCE deflator, but the gap currently stands at 1.0 percentage point—near the top end of its range in recent decades. What's driving the wedge, and what could it mean for the path of interest rates and broader economy ahead?
… And from Global Wall Street inbox TO the WWW for still MORE on how GOOD is bad …
The GDPNow model estimate for real GDP growth (seasonally adjusted annual rate) in the first quarter of 2024 is 2.8 percent on April 1, up from 2.3 percent on March 29. After this morning’s releases from the US Census Bureau and the Institute for Supply Management, the nowcasts of first-quarter real personal consumption expenditures growth and first-quarter real gross private domestic growth increased from 2.6 percent and 3.1 percent, respectively, to 3.2 percent and 3.9 percent.
Bespoke: Q1 Performance + "Investing & Politics" Report (April … thought it was 2nd best according TO Argus — been around far longer than this shop — oh well. Aprils not the best …?)
Stat of the Day April Flowers. April has been the strongest month of the year for the Dow Jones Industrial Average with the index averaging a gain of 2.2% during the month over the last 50 years. That’s much stronger than the Dow’s average gain of 0.73% for any month over the last 50 years. (Source: Bespoke)
Bloomberg: 5 Things You Need to Know to Start Your Day (Asia edition cuz of the visual comparing NAPM with the yield curve …)
…The US economy is looking far too robust for those, including many bond investors, who were expecting it to roll over toward a recession this year. ISM’s manufacturing PMI became the latest piece of data to blow the lights out, jumping above the 50 line to signal expansion for the first time since 2022. The increase was five times larger than economists expected, with the prices and new orders sub-indexes also surging.
Little wonder traders immediately started betting the Federal Reserve may only reduce interest rates twice this year, instead of the three penciled in by the central bank’s dot plot projections. It’s also looking like bets that rate cuts start in June may join prior favorites on the scrap heap. We started the year with investors certain that it would be March, then that got pushed back to May and then June.
The Treasuries yield curve is the more stubborn part of the bond-market positioning picture. While the premium offered by two-year notes over 10-year peers did narrow, it is still at a hefty 40 basis points. That inverted setting — longer-dated Treasuries normally offer the higher yields to compensate for the greater risks involved — is proving very persistent. Still, if manufacturing continues to thrive to further undermine recession bets, there’s a decent chance that the longest-ever curve inversion is living on borrowed time.
Bloomberg: June Fed Rate-Cut Odds Dip Below 50% After Strong ISM Data (right. got it…)
Bond traders price in less cumulative Fed easing in 2024 too
First day of quarter brings robust corporate bond slate
… The selloff was already under way before the ISM data release as traders reassessed the outlook for monetary policy based on economic figures and cautious comments by Fed Chair Jerome Powell on Friday, when US markets were closed.
The ISM report “feeds into the narrative coming out of last week,” whereby the economy’s resilience enables the Fed “to be patient,” said Gregory Faranello, head of US rates trading and strategy for AmeriVet Securities. For the bond market, that means rates stay “higher for longer.”
Personal income and spending data for February released Friday showing that consumption remains strong while progress toward lower inflation has stalled. Subsequently, Powell reiterated that the Fed wants to be more confident in the inflation trend before cutting rates, and that strong labor-market conditions mean there’s no urgency.
Based on those developments traders had already begun to price in less easing than indicated by the central bank’s March 20 forecasts. Earlier last week, Fed Governor Christopher Waller went further, saying recent economic data warrants delaying or reducing the number of cuts seen this year.
Bloomberg: A Higher-for-Longer Good Friday From the Fed (Authers OpED for the visuals …)
Powell makes it clear he’s in no rush to cut rates, markets believe him, and that’s not bad with an economy this strong
… On Good Friday, Fed Chair Jerome Powell spoke at a forum organized by the San Francisco Fed. He made clear that the strengthening economy left him in no rush to cut rates, while the decline of inflation was still ambiguous. He was speaking just after the Fed’s favored inflation measure, the personal consumption expenditure index, had come in more or less exactly in line with expectations for February. Taking the statistical purists’ preferred “trimmed mean” — excluding outliers and averaging the rest — the Dallas Fed shows that inflation did indeed diminish ever so slightly on a year-on-year basis, while the monthly glitch in January begins to look like a fluke. That said, progress toward the target of 2% looks to be too slow:
… If we look at the implicit pricing of the future fed funds rate derived by the Bloomberg World Interest Rate Probabilities function, we find that the odds of one 25-basis-point cut by the June meeting of the Federal Open Market Committee are now down to about 50/50. Two months ago, three cuts were being priced as a virtual certainty. Further, for the first time since October, a little doubt is creeping in to the chances that the Fed will even have made a cut by its July meeting:
… In principle, then, there’s no reason to get out of stocks just because the fed funds rate is high. That is a headwind to valuation, and makes it harder for companies to grow, but usually rates are only that high because corporate conditions are good. Meanwhile, higher rates are by definition bad for bonds. It therefore makes sense for stocks to outperform bonds when rates are rising. What’s startling is that stocks have been outperforming bonds even when the yields on Treasuries are moving sideways. The benchmark 10-year Treasury yield hit 4.25% for the first time since the GFC in October 2022. In Monday’s trading, it oscillated between 4.2% and 4.3%, but essentially yields have been trading in a range for 18 months. So bond prices have been stable — yet stocks have beaten them by almost 33% over that period, if we use a simple yardstick comparing the most popular exchange-traded funds for the S&P 500 and Bloomberg’s index of 20-year or longer Treasuries. The ratio hit a new high after the ISM data:
For asset allocators, it seems impossible to move beyond holding stocks rather than bonds. The risk is that protracted high rates eventually create a financial accident. This doesn’t have to be a full-blown repeat of 2008; another US banking crisis like the one that hit last spring could be very damaging. And the longer rates stay higher, the greater the risk that companies have to refinance — on much worse terms — the very generous loans they were able to fix in 2020 and 2021.
ING: The return of US manufacturing growth lifts optimism
The ISM manufacturing index surprised everyone by moving into growth territory for the first time since late 2022 with production jumping, new orders rising and inflation pressures increasing. Markets interpreted that as reducing the chances of meaningful Fed rate cuts, but construction was much weaker and there are a lot of jobs numbers still to come.
US ISM surprises repeats the surprise strength seen in China The February reading of the ISM manufacturing index has unexpectedly risen above the break-even 50 level – the first time it has happened since September 2022. By moving into expansion territory the survey offers hope that the manufacturing sector is finally stabilising after nearly 18 months of contraction and follows on from an upside surprise in Chinese manufacturing PMIs over the weekend. This may well be the key reason why the ISM performed so well since, as the chart below shows, the regional surveys we got beforehand fell. However, there are no regional surveys covering the US west of the Rocky mountains and that is presumably where the strength was focused, replicating the performance of Asian surveys.
ISM outperformed the regional surveys
… Finally, those thinking nearly 7 rate CUTS coming in to this year are apparently still waiting for a few more ‘past due’ notices like this guy …
I don't allow Gold's dollar-price moves to affect me much now; I've seen enough $50+ up days reverse in the course of a day to learn something. However gold's price action the last wk have me concerned. As Jim Rickards has said, sure you want the gold when it hits $10K, but that means the world's in a real bad spot :( Nothing against BTC but I trust in the Barbarous Metal :)
PS: TLines Lives matter LOL!!! It's been really hard not asking people if they celebrated Easter OR Trans Visibility Day [as if they go unseen :) ] ok I'm OUT!