while WE slept: bonds 'modestly softer'; BONDs still NOT dead, 'bottom line ... 60/40 at an all-time high" -BBG visual; SP500 biggest YTD advance of the 21st century -DB and...
Good morning …
Overnight summary in a couple clickbaitable h’lines …
Newsquawk: Nikkei suffered after Friday’s LDP elections while China rose on stimulus
Reuters: Nikkei retreats, China rallies
… Some further context …
Bloomberg 5 things to start your day: Europe
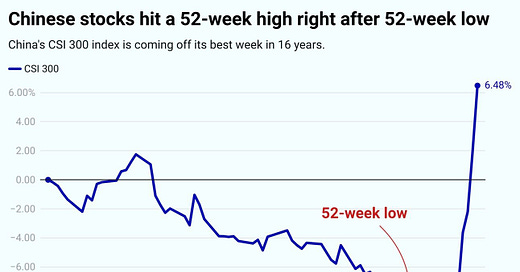
… Chinese stocks extended one of their most remarkable turnarounds in history. The CSI 300 Index — which lost more than 45% of its value from a 2021 high through mid-September — jumped as much as 6.5% on Monday, the most since 2015. It’s set for a technical bull market as traders rushed to buy shares in the last session before a week-long holiday…
Finally …
… Opening Bell — source of this visual — linked just below and now you know. Chinese officials and the PPT really know how to end trading there for a week or so, on a high note, eh??
This weekends note … little bit later than normal this past weekend … offered up a visual of long bonds which appear to be a decent rental opportunity, based on my use of a thick crayon and back of the envelop techAmentals…
… here is a snapshot OF USTs as of 647a:
… and for some MORE of the news you might be able to use…
NEWSQUAWK: European autos hit hard after guidance cuts, geopolitical … Bonds are modestly softer to varying degrees; Bunds were not too reactive after the German Regional CPI metrics painted a picture of cooling Y/Y inflation ahead of the Nationwide figure at 13:00 BST / 08:00 EDT.tensions remain high … USTs are currently scaling back some of the post-PCE upside seen on Friday with not a great deal of fresh US drivers over the weekend. NFP will likely be the highlight for the week given the Fed's increased focus on the employment side of its mandate. As it stands, markets currently see the November meeting as a near-enough coinflip between a 25 or 50bps reduction. Dec'24 USTs are currently contained within Friday's 114.08-25 range.
Reuters Morning Bid: Powell to close out Q3, China stocks boom 8%
Opening Bell Daily: China's stock record … China's stock market just had its best week since 2008 … Beijing's stimulus package pushed China's stock market to a 52-week high right after it hit a 52-week low.
Finviz (for everything else I might have overlooked …)
Moving from some of the news to some of THE VIEWS you might be able to use… here’s SOME of what Global Wall St is sayin’ … in addition TO what was noted over the weekend when I asked if one #GotBONDS?
A few words on CHINA data …
BARCAP China: PMI contraction calls for more policy stimulus
Manufacturing PMI stays below 50 and services PMI contracted. Weaker export orders and Caixin's PMI point to slowing external demand. Recent support measures and wealth effects from stock market rally may cushion consumption and investment, while more easing needed to reverse deflationary expectations and economic downturn.
September NBS manufacturing PMI: 49.8
Bloomberg consensus forecast (Barclays): 49.4 (49.5)
August NBS manufacturing PMI: 49.1
Everyone’s fav stratEgerist with daily update brought forward for a few words on Japan and China markets overnight …
DB: Early Morning Reid
… This morning, Asian equity markets have seen some big early moves. The Nikkei has dropped by -4.64% following Friday's surprise selection of Shigeru Ishiba as the next prime minister, who has previously criticised the Bank of Japan’s loose policies. In contrast, stocks in mainland China are notching up a ninth day of gains ahead of a week long holiday tomorrow. The CSI is up by +5.84%, initially surging as much as +6.5%, the largest jump since 2015. The Shanghai Composite is also up by +5.28% with the Hang Seng +2.91% in early trading. Elsewhere the KOSPI is down by 0.88% and US futures are pretty flat.
Coming back to China, official factory activity slightly improved in September but stayed below 50 for a fifth consecutive month in September. This will be seen as backward looking now but for completeness, the manufacturing PMI came in at 49.8 in September (v/s 49.4 expected), up from 49.1 in August with the services PMI at 50.0 (v/s 50.4 expected), down from a level of 50.3 in the previous month. However, China’s Caixin PMI was 49.3 in September (v/s 50.5 expected), experiencing its sharpest contraction in 14 months. It followed a reading of 50.4 in August. The services Caixin PMI at 50.3 in September, was down from 51.6 in August …
… Elsewhere, Japan's industrial output in August fell -3.3% m/m, as significant miss compared to market expectations of a -0.5% decline and against an increase of +3.1% in July. On a brighter note, retail sales increased by +2.8% y/y in August, surpassing market forecasts of +2.6% y/y following an upwardly revised gain of +2.7% in July …
Same great shop (and team) with a question and some answers as we are ready to put Q3 behind us and look ahead to the beginning of the end … of the year ….
DB: Mapping Markets: Why Q3 was so strong, and how this can continue
As we near the end of Q3, markets have continued to rally across multiple asset classes. In fact by Friday, the S&P 500 had posted its biggest YTD advance of the 21st century at this point in the year. And it’s been a great quarter for bonds too, with Bloomberg’s global aggregate on track for its 4th best quarter of the 21st century.
That’s a significant turnaround from earlier in Q3, when there was major turmoil as US recession fears grew and the yen carry trade began to unwind. But ultimately, risk assets recovered thanks to a dovish central bank pivot, stronger economic data, and fresh stimulus out of China. And looking ahead, there remains much to be optimistic about, particularly since investors are still pricing in downside risks. So if the soft landing does materialise, the historical precedents are very positive.
1. As it stood on Friday, after 271 days of the year, the S&P 500 has seen its biggest YTD advance of the 21st century so far.
2. The S&P 500 has now seen 34/48 weekly gains, a joint record since 2004.
3. Global bonds have also done incredibly well, and Bloomberg’s global bond aggregate is currently on track for its 4th best quarterly performance of the 21st century so far.
…What now?
…there are still clear signs that investors are pricing in a higher-than-usual chance of more negative outcomes like a recession.For instance, futures are still pricing in over 170bps of rate cuts from the Fed by the June 2025 meeting, on top of the 50bps we've already had. If that were realised, that would be the sort of pace we only normally see in a recession, with over 220bps of cuts in under 10 months. Moreover, looking at the Bloomberg consensus of economists' forecasts, they still see a US recession as a 30% probability in the next 12 months, which is well above the recent frequency of recessions.
From a market perspective, that suggests that investors could still price in even more good news over the months ahead if economic growth does hold up. Indeed, there have normally been decent gains for the S&P 500 when the Fed is easing into a soft landing. And although some have questioned what would happen if those rapid rate cuts being priced didn't materialise, if the reason is due to stronger-thanexpected growth, then that doesn't necessarily mean it would be bad for risk assets, as we saw in Q1 of this year. Back then the S&P 500 kept advancing, even though rate cuts were being priced out, because growth was holding up and recession risks were falling back. So if a soft landing can be achieved, the historical precedents from here are very positive for markets.
Given political spin right now and how it would seem almost everyone lining up against former Pres Trump …
MS: The Weekly Worldview: Tariffs, revisited
Tariff proposals by former President Trump, if fully implemented, would entail significant increases in tariff rates across goods and industries. We expect that these would lead to significant downside risks to growth and a near-term rise in inflation in the US.
… The inflationary effect happens more quickly, judging from history. In that scenario, we model a level shift higher in the price level, implying headline PCE inflation rising 0.9pp over 4 quarters, factoring in the pass through of higher import prices and intermediate costs with some offsets from the dollar appreciation and weaker growth. The monetary policy response would be complicated, because the inflation boost would be evident first, and might slow the pace of rate cuts, but as the sharply slower growth becomes apparent, we think easing would resume and quicken…
… next up Dr (Bond Vigilante) Yardeni setting out a week ahead economic calendar …
Yardeni: The Economic Week Ahead
The week ahead is jampacked with employment indicators. The Fed started a new monetary easing cycle on September 18, cutting the federal funds rate by 50bps. The question now is how hard will it press on the gas pedal? Given last week's cooler-than-expected inflation print, the Fed will most likely retain its bias for easier monetary policy unless the labor market data are surprisingly strong. The consensus currently is for another rate cut following the November 5-6 FOMC meeting. The only question is will it be 25bps or 50bps? We are in the first camp.
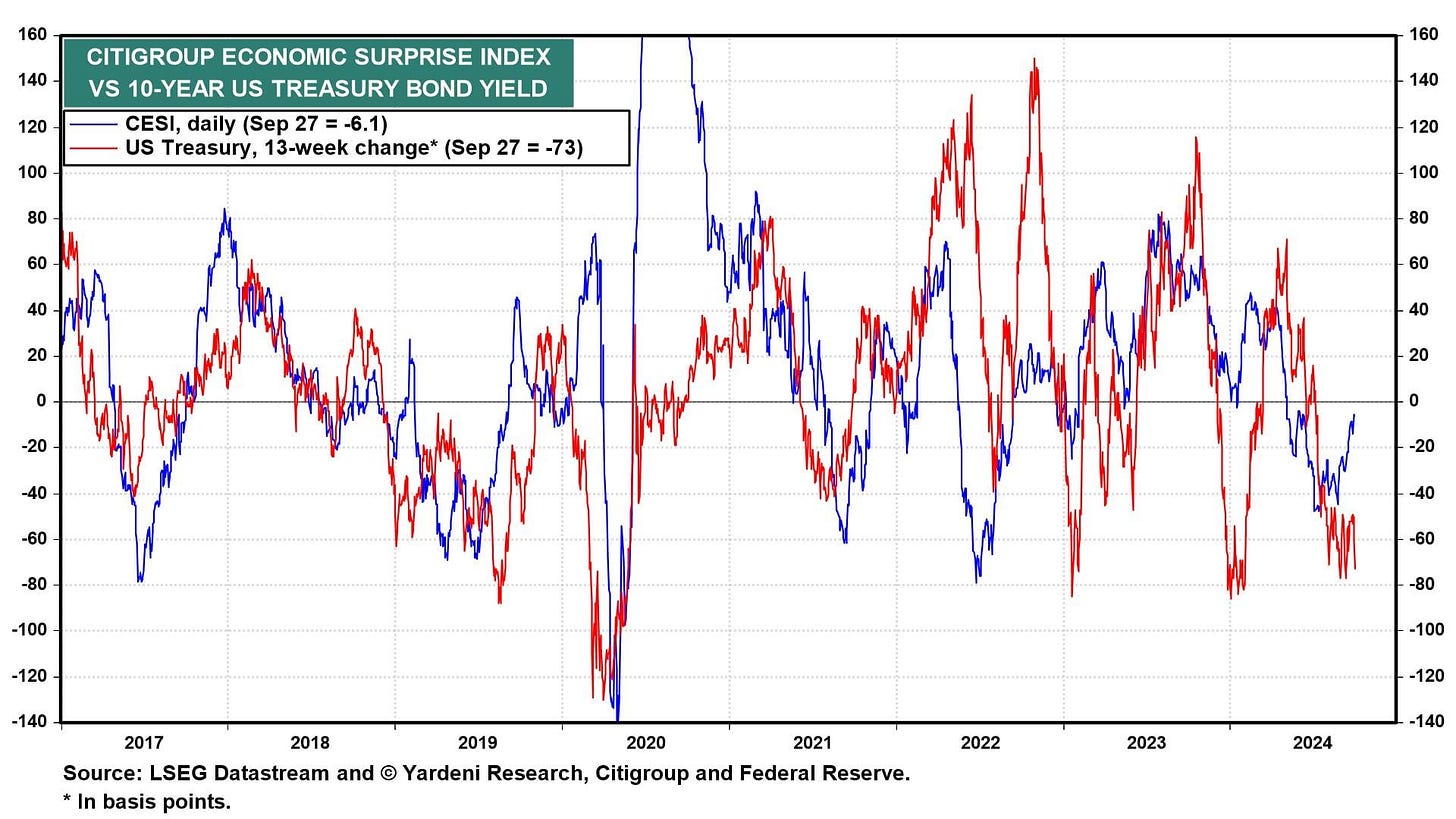
A continued cooling of the labor market would set the Fed up for even more aggressive interest-rate cuts, boosting bond prices and interest-sensitive stock prices too. If instead, the labor market indicators and other economic ones surprise to the upside, as we expect, bond yields would probably rise and so would cyclical stock prices (chart). Let's review what's in store this week:
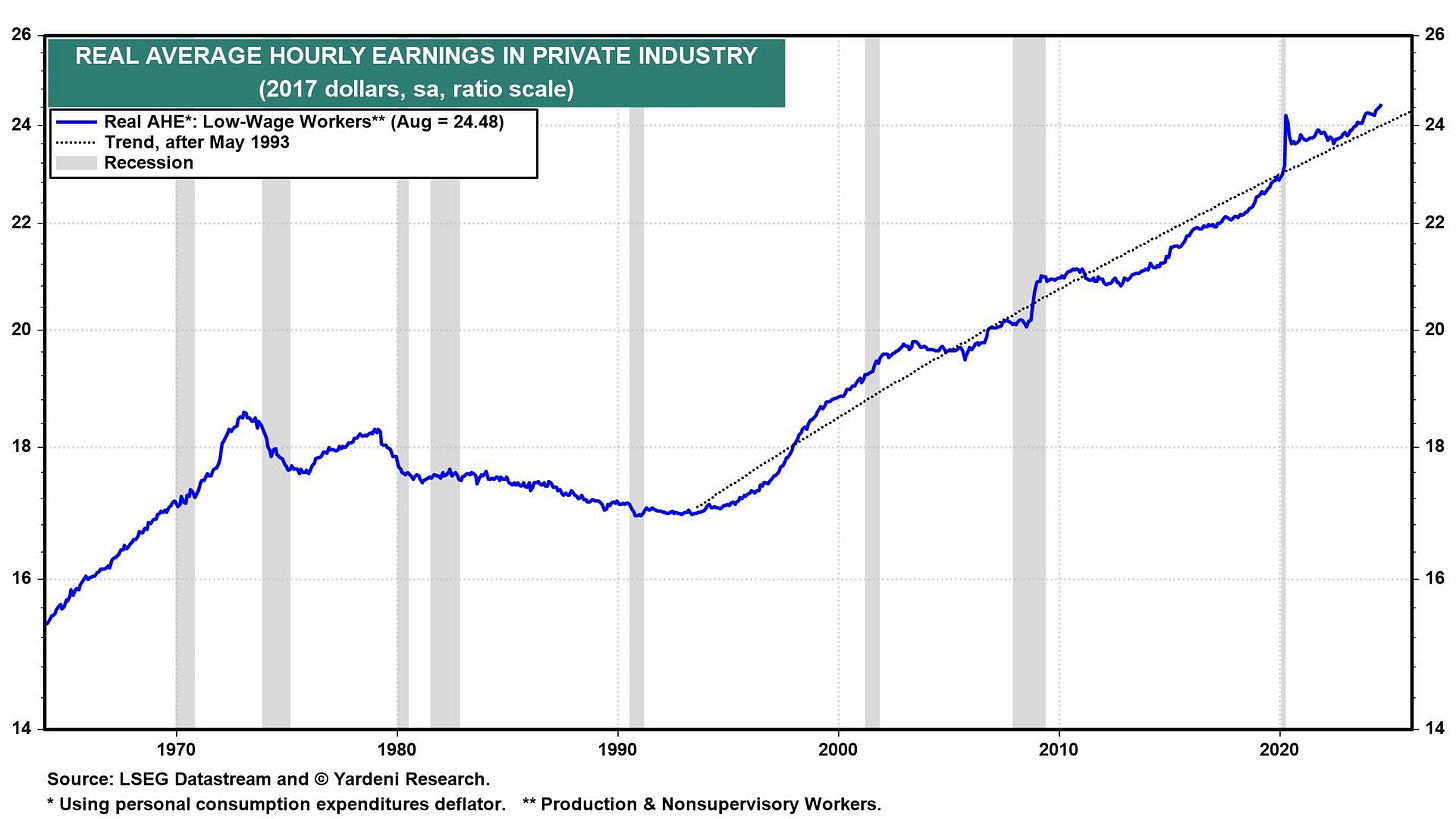
(1) Employment. September's employment report (Fri) should show that payrolls and real average hourly earnings rose to record highs. Even as monthly payroll growth has moderated to 116,000 over the past three months, the purchasing power of production and nonsupervisory workers (who make up about 80% of private industry payrolls) continues to increase as wages rise faster than prices (chart). In the aggregate, Americans' real incomes are rising thanks to productivity-driven real wage gains rather than brisk employment growth.
… And from Global Wall Street inbox TO the WWW,
Authers’ SAYS … bonds and the 60/40 REMAINS alive and well! In other words, BONDS are STILL NOT DEAD YET …
Bloomberg: How data could start this month off with a thud again
Could jobs numbers this week provoke another market spasm like those that opened August and September?
…First, the bottom line is that asset markets continue to thrive. Taking Bloomberg’s global 60:40 index (with the classic 60% allocation to stocks and 40% to bonds) as a benchmark, we find that it’s now at an all-time high; 60:40 hasn’t died yet:
… August and September both had bad starts due to disappointing macro data. At the beginning of this month, inflation appeared a little too sticky, and unemployment a little too low, to justify the Federal Reserve cutting by more than 25 basis points. It did anyway. In August, the data that regularly arrive at the beginning of the month (ISM surveys and unemployment numbers) appeared to portend genuine hard-landing risks for the economy. The latest numbers generally tend to assuage those fears. Friday brought Personal Consumption Expenditure (PCE) inflation data for August. This is the Fed’s preferred measure, and it showed continued progress:
Whether gauged by excluding food and fuel, or by using the trimmed mean calculated by the Dallas Fed (stripping out outliers and taking the average of the rest), PCE inflation is very close to the 2% target and in a clear, steady marked declining trend. This is great for the Fed, and presents no obstacle to their cutting by another 50 basis points at their next meeting, due the week of the Nov. 5 election.
However, the main reason for cutting would be the employment market. The latest data on claims for jobless insurance, as close to a good real-time indicator as we have, suggests the labor market is recovering, with layoffs reducing, and continuing claims aren’t showing any great rise. While inflation may give no reason not to make another jumbo cut, then, the claims data give no reason to do so either:
As it stands, there’s little or nothing not to like. Inflation is licked and the employment market remains serene. Goldilocks is safe for now. But the week ahead brings a welter of unemployment data, with the JOLTS figures on layoffs and vacancies due before the non-farm payrolls on Friday. Could they trigger another market spasm like those that opened August and September? With markets surfing on good feeling, they certainly could…
…And as we bid adieu to September, a couple reminders …
Recall I offered a reminder HERE — some thoughts on month-end UST mkt dynamics …
Liberty Street Economics: End‑of‑Month Liquidity in the Treasury Market
…Implications
Based on this post’s findings only, one might conclude that the last trading day of the month is an especially good time to trade because of the day’s higher trading volume and lower transaction costs. However, the evidence of periodicity in returns from other studies suggests that advantageous times to trade vary for other reasons and differ between buyers and sellers. These monthly patterns also change over time, as shown in this post, warranting close watching of these patterns going forward.
… note HERE is a link back to some work i did on topic in my former life …
… A REMINDER from back in ‘the day’ where 4pm is now the new 3pm when positions are marked and books are closed. Liquidity is what it is and when it needs to be. Supply creating it’s own demand. Liquidity … For somewhat MORE, click HERE and click through to MY VIEWS of that day …
… AND … with JPOW up later today from Nashvill …
… THAT is all for now. Off to the day job…


