weekly observations (11/13); Moodys sets the mood, KJP reacts, global markets await Sunday evening's open; Veteran's Day
Good morning / afternoon / evening - please choose whichever one which best describes when ever it may be that YOU are stumbling across this weekends note…
First UP, the GOOD news is there were no FDIC bank failure notices in the inbox (unless I missed?) and the less good (ok, bad) news is, well THIS …
… we got THAT going for us, which is nice.
And while the WH might like to SPIN this as Rs having ‘blood on their hands’ here (my words not theirs but you can tell KJP has fiery rhetoric in her heart), I’ll trust one and all can read for themselves and see that nowhere in THE NOTE do the lay blame squarely on one side or another.
Read THE NOTE for yerself and please let me know what YOU think and how markets (different now vs 2011?) will open up Sunday night.
Bloomberg: US Credit-Rating Outlook Changed to Negative by Moody’s
ZH: Moody's Cuts USA's Aaa Rating Outlook To 'Negative'; Treasury Dept "Disagrees"
AND … we shall see. Whether or not this is 2011 all over again (doubtful because, you know <GULP> it’s different this time) remains to be seen.
WE COULD lean on a DAILY visual of 10yy (HERE yest) and note how 50dMA (4.599%) continues to attract like a moth TO a flame but truth be known, I’d rather focus on how / where we are in relationship TO a longer term (10s since 1790 average 4.75% noted HERE on Thurs)
All this kinda makes inflation data seem Fri seem, well, unimportant. Specifically thinking, well, how’s bout that UoMISSagain ‘flation statistic …
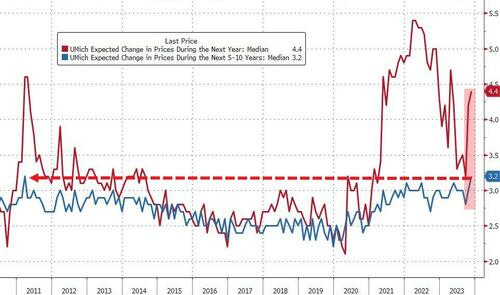
ZH: UMich Inflation Expectations Unexpectedly Soared Again In November, Sentiment Slumped
… 12-month inflation expectations shot higher still from 4.2% to 4.4% (exp 4.0%) and 5-10 year inflation exp rose to 3.2% (hotter than the 3.0% prior and expected)....
Source: Bloomberg
That is the highest medium-term inflation expectation since 2011…
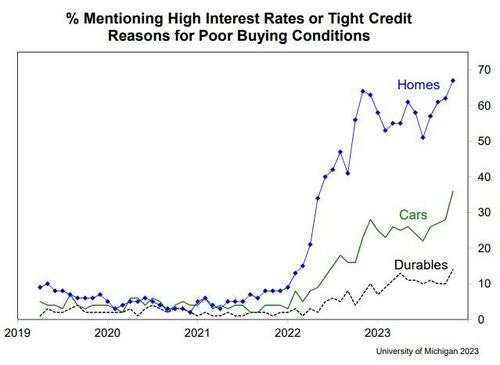
… About 36% of consumers spontaneously blamed high interest rates or tight credit for poor buying conditions for vehicles; this is the highest share on record. Similarly, the share of consumers blaming similar factors for poor home and durables buying conditions are both at their highest since 1982.
As Hsu conclude: " The combination of expectations for persistently high prices, high borrowing costs, and labor market weakness does not bode well for the prospect of continued strength in consumer spending and economic growth. "
… what the … ?
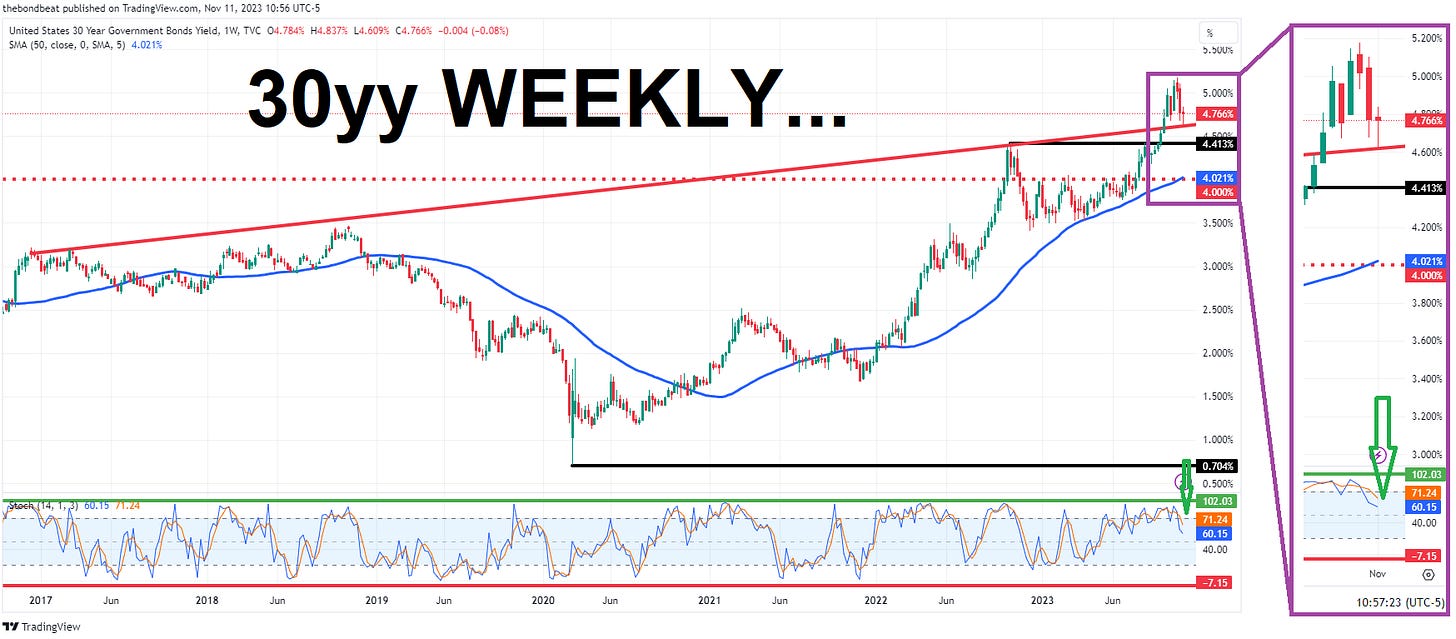
Ahead of the week which will be (CPI, ReSale Tales), a look at how long bonds ended
… Momentum seems to be bullish (ie lower yields) on a WEEKLY basis and we’ll ALL be watching in wake of this past weeks larger than life TAIL.
Alrighty then. Lets move on AND right TO the reason many / most are here … some UPDATED WEEKLY NARRATIVES … where THIS WEEKEND I’d note a couple / few things which stood out to ME this weekend …
BAML rates weekly, “Bond fairy tails” (i get the idea BUT read what ARGUS saying and most of the free world, truthfully, in wake of QRA and where increases in issuance likely … still, ‘going long’ catches the eye…)
US: We go long the 5Y point due to softening data and a cautious Fed …
… If data has turned & last hike delivered, we expect outperformance of UST 5Y vs wings, driven by: (1) belly forwards falling towards neutral as the market shifts baseline from no-landing to soft-landing; (2) the potential for neutral rate expectations to reprice lower from current 3.75% levels to 3-3.25% more similar to our US econ team & Fed views, (3) supply indigestion risks which may weigh more at the back end of the curve
Barclays rates weekly, “Not out of the woods” (stay short front end (SFRZ4) and remain of the belief that 10yy closer to LOWS of new range…)
… we believe 10y yields are also likely to move somewhat higher as the embedded term premium looks a touch too low …
BMO Weekly “Cautious Consolidation”
… We covered the short we entered last week in the 2-year sector at 4.81% as Thursday's selloff brought 2s to our target at 5% … enter a 2s/10s flattener …as we look to the potential curve-flattening impulses in the week ahead via CPI and Retail Sales …
Citi 2024 outlook (ask a question and give a diff answer - FED or WE … semantics but it is how Global Wall Street operates … ‘enough about ME what do YOU think of ME …)
“Where does the Fed want 10y yields?
… We think 10y yields should be 4.25% to 4.5%, judged by Dec24 Fed expectationsDB on EQUITY positions “Aggregate equity positioning jumped back up to neutral”
GS on 2024 (global MARKETS … ‘parking the plane’ … decent read esp for those in the SOFT LANDING camp)
Macro Outlook 2024: The Hard Part Is Over
Global Markets Outlook 2024: Towards a Better BalanceJPM top takeaways — great chart of “The U.S. economy has continued to grow regardless of who is in the White House” (speaks volumes TO what MOODYS noted above AND to how wrong JKP really is …)
UBS weekly, “The end of higher for longer”
… The lull in fear about Treasury supply caused by the Treasury Refunding announcement was brought to an end by a large tail in the 30yr auction. Supply fear is likely to remain intense until at least one cycle of long end supply is absorbed smoothly. That means long end rallies are likely to be limited at least until the bond auction on Dec 12th.
Meanwhile the front end was hurt by Powell's relatively hawkish comments. We think there is much more scope for that to reverse quickly, particularly if the cheapening of the long end intensifies the "market is doing the Fed's work for it" sentiment.
Accordingly, steepeners seems like the obvious but appropriate position to carry through the upcoming data…
UBS 2024/5 outlook (passed along earlier in the week but SPOOs to 4500 and 2s ‘the key trade’)
Wells 2024 outlook, “Weathering the Storm”
… We believe it would be premature to claim that the economic storm has passed, because the battle against inflation has not yet been decisively won…
…… Rates to Remain Higher for Longer
Moving along and away FROM highly sought after and often paywalled and Global Wall Street narratives TO a few other things widely available and maybe as useful from the WWW
AllStarCharts: No One Wants To Buy Bonds
What a wild broad-market reversal yesterday!
Powell supposedly stated the obvious or blurted out what was on everyone’s mind. I don’t know. I haven’t watched the video or reviewed yesterday’s treasury auction.
And I won’t.
I’m more interested in the “what,” not the “why,” as the former has proven far more valuable for navigating markets.
Nevertheless, the message is clear: no one wants to buy bonds.
It makes sense to me…
Check out 30-year T-Bond futures:
Long-duration bonds are in a clear downtrend, stair-stepping lower.
Last week’s rally in US Treasuries was impressive. But based on the chart, it appears to be a standard retest of the 2022 lows – nothing more.
As far as I’m concerned, bonds continue to trade in a “sell the rip” environment until price proves otherwise…
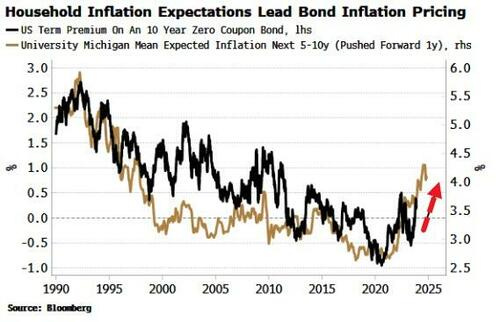
Bloomberg: Rising Inflation Expectations Heap More Risks To Treasury Market
… Rising consumer inflation expectations compound the issue as the household sector has become the marginal buyer of USTs as other sectors retreat.
Household’s rising inflation expectations therefore point to higher term premium (chart above), i.e. the US government will likely have to accept a bigger discount on its issuance to compensate for the household sector’s inflation outlook.
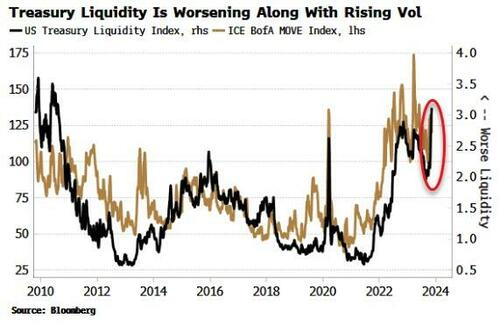
Bloomberg: ICBC Hack 'Blamed' For Poor Treasury Liquidity; Higher Vol Will Keep Rallies Short-Lived
… As the chart below shows, high fixed-income vol goes hand in hand with worsening liquidity in the Treasury market. Bloomberg’s US Treasury Liquidity Index compares yields to a fitted curve; the greater the gap between actual versus fitted values, the worse liquidity is likely to be.
Worsening liquidity increases the possibility of future weak auctions – one of the reasons investors like Treasuries is that they are “safe,” and stable. As their volatility rises and liquidity falls, they will become less attractive. Moreover, their utility to multi-asset investors as a portfolio and a recession hedge when the stock-bond correlation is positive will wane, reducing demand further…
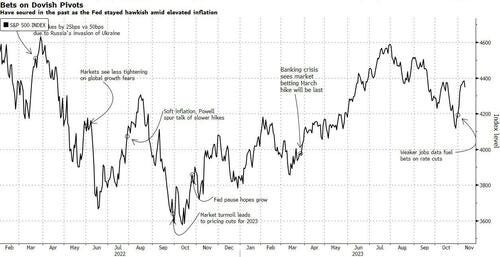
Bloomberg: Traders Make Same Bet That's Burned Them Before (if at first you don’t succeed …?)
… Let’s revisit the previous times when markets reacted in similar fashion. Deutsche Bank counted at least six other times in this hiking cycle that markets have positioned for a Fed pivot, only to see their hopes dashed later. The so-called ‘pivot’ has evolved from what was first described as a smaller amount of tightening, then slower hikes, later to betting on a pause and now outright cuts.
Of course, it’s hard to break out the individual drivers of the stock market, as fundamentals and sentiment play a big role. But if one just looks at the equity moves around the rallies resting on the hopes of the dovish pivot that Deutsche Bank described, the S&P 500 went on to fall about 9%, on average, in the weeks that followed (if you take highs and the lows around those rallies).
Rebounding stocks, which have been taking their cues from bonds recently, have also helped loosen financial conditions, which is self-defeating as the Fed might have to tighten again, as various policymakers have suggested.
Talk about rate cuts is premature, said a chorus of central bankers over the past week. Fed speakers acknowledged the softness in the labor market but as Chicago Fed President Austan Goolsbee noted that “is what you would want — is what you would expect.”
… There’s some evidence for investors to hang their hat on as the jobs market softens: “For the doves, they have all the ammunition they need to basically put the hawks in a casket,” Renaissance Macro’s Neil Dutta said on Bloomberg Television.
Nonetheless, the Fed’s own projections imply markets should prepare for more slack in the labor market as well as the economy — and for the Fed to take it in stride until their inflation goal is within reach.
WolfST: Could it Be the Fed’s Mega-QE Created so Much Liquidity that Tightening Doesn’t Work until this Excess Gets Burned Up?
Financial Conditions loosen further: credit markets blow off the Fed to make sure “higher for longer” gets entrenched? That would be funny.
…The long-term chart below of the NFCI shows what happens when financial conditions tighten so much that they strangle the economy, as they did during the Financial Crisis. The March-2020 spike barely registers in comparison.
The St. Louis Fed’s Financial Stress Index takes a similar approach and measures financial stress in the credit markets. The zero line denotes average financial stress. Negative values denote less than average financial stress. In the current week, it dropped to -0.56. The green line shows this current value across time and denotes that credit markets are still in la-la-land.
… Could it be, with so much liquidity still out there, that it might take a lot more and a lot longer to tighten financial conditions enough to where they have even a chance of removing the fuel from inflation?
And that’s kind of funny because if financial conditions don’t tighten enough to slow the economy and remove inflationary fuel, and if it then turns out that this dip in year-over-year inflation rates was just a “head fake,” to then resurge again, as Powell said he suspects it might, the Fed will go at it with more rate hikes. Powell made that clear. With credit markets still blowing off the Fed, are they trying to make sure that “higher for longer” gets entrenched? That would be funny.
… AND for any / all (still)interested in trying to plan your trades and trade your plans in / around FUNduhMENTALs, here are a couple economic calendars and LINKS I used when I was closer to and IN ‘the game’.
First, this from the best in the strategy biz is a LINK thru TO this calendar,
Wells FARGOs version, if you prefer …
… and lets NOT forget EconOday links (among the best available and most useful IMO), GLOBALLY HERE and as far as US domestically (only) HERE …
Finally before hitting send on this Veteran’s Day … a look back as we all REMEMBER,
picture SHOULD be clickable thru TO Reagan’s 1985 speech AND …
THAT is all for now. Enjoy whatever is left of YOUR weekend …






As an Austrian-wannabe economist I'd argue that the presidential chart of GDP growth is actually nothing but Monetary Growth, or better yet Currency Growth, i.e. INFLATION. Nothing more. Note the charts turn during Nixon....and the demonetization of gold. The Ultimate Sin!
Great article !!!
Remembering the Sacrifice of Veterans.....Excellent !!!
Yes, Freedom isn't Free...
Quote of the week: by J.Powell..."Shut the F....ing door !!!" LMAO !!!
Have a nice weekend......