(USTs modestly cheaper / steeper on above avg volumes)while WE slept; bonds TAIL, JPOW bails and SPOOS streak ('Haley's Comet') fails
Good morning … Had I still been in my institutional FI seat, yesterday would have been a most uncomfortable one …
Bloomberg: World’s Biggest Bank Forced to Trade Via USB Stick After Hack
… Our trades cleared through ICBC … and while we used to take some amount of ironic pride in that fact (the worlds LARGEST bank, you know ) … well we see how much good THAT does. Besides the fact that clearing of UST trades by a Chinese operation … what could possibly go wrong?
Not to worry, I’m certain they were handing out SECURED USB STICKS
(I spared you the THUMB DRIVE pun…your welcome)
In any case, it would appear there was more TO yesterday than a hack slowing some UST clearing operations and yesterday’s long bond auction TAIL was horrible, it was followed by JPOWs commentary, “Monetary Policy Challenges in a Global Economy” where you’ll find on p2 into 3,
… The Federal Open Market Committee (FOMC) is committed to achieving a stance of monetary policy that is sufficiently restrictive to bring inflation down to 2 percent over time; we are not confident that we have achieved such a stance. We know that ongoing progress toward our 2 percent goal is not assured: Inflation has given us a few head fakes. If it becomes appropriate to tighten policy further, we will not hesitate to do so. We will continue to move carefully, however, allowing us to address both the risk of being misled by a few good months of data, and the risk of overtightening …
See what you want BUT a bit more HAWK than dove IMO … at least some rebalancing of the risks (and markets pricing …) and it appears media got the message.
Bloomberg: Stocks Retreat on Powell Interest Rate Warning: Markets Wrap
… Powell said officials would move carefully but won’t hesitate to tighten policy further if needed to contain inflation. A weak auction of 30-year notes also fueled the drop in Treasuries, rekindling concerns investors will struggle to soak up the swelling supply of new debt.
“Powell’s statement moved the trading consensus that the US 10-year yield has peaked for the year. Hence risk-assets that rallied in the last few weeks are re-assessing ‘what if’ the US 10-year yield is back to 5%,” said Manish Kabra, a strategist at Societe Generale SA in London.
AND
Bloomberg: Powell Says Fed to Be Careful, Won’t Hesitate to Hike If Needed
‘Not confident’ policy tight enough for 2% inflation: Powell
Fed chief says policymakers will continue to ‘move carefully’
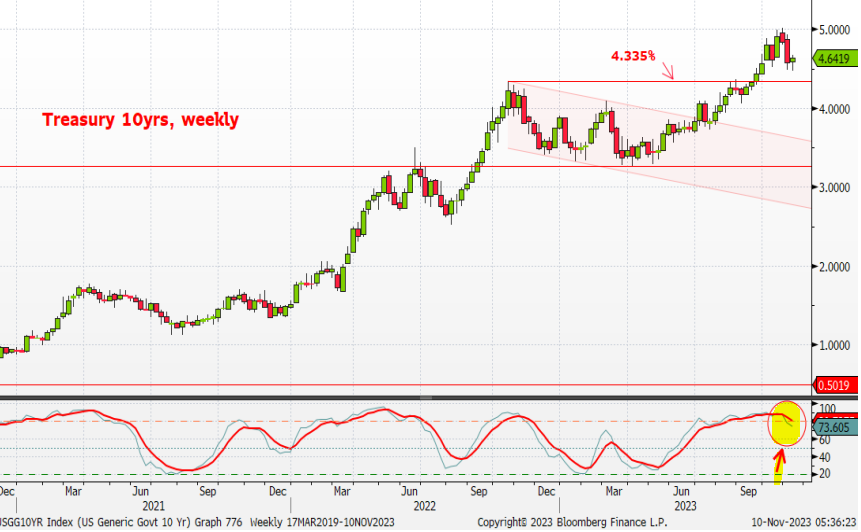
AND … that was THEN and this is now … I will ‘begin’ with a look at 10yy (noted HERE before 10yr auction) because it illustrates how it just so happens, TLINES drawn in continue to come back around and prove their relevance …
10yy vs 4.60% (TLINE dating back to just prior to SVB in March) along with 4.95% and 4.50% all seem important … along with momentum (stochastics, bottom panel) indicators. I’ll continue to watch these on a variety of timeframes in search of the meaning of life (and direction of rates) and find them to be useful as one part of an overall approach.
RangeZilla lives …
AND just like THAT we’re no longer #WINNING … Long bond auction came and went, left a big dent in its wake and yet, we’ll all STILL be watchin’ 50dMA (10s about 4.59 and 30s about 4.71) and while rates popped I’d continue to note / watch really long term average (10s “Average since 1790 = 4.75%” noted HERE) SO …
Streaks broken, shorter-term MAs respected and important until they aren’t AND momentum indicators saying this or that … whats it all mean?
NOTHING … except job security for those on Global Wall who are in the business of selling clarity (for more on this concept, see El-Erian / BBG OpED below).
For now, I’m taking some consolation in the FACT that shorter-term ‘signals’ (stochastics) WORK and rates were overBOUGHT (likely to find similar in stonks if I looked) and just when you start celebrating streaks … they end.
Magazine cover indicator or whatever … focus on the BIG picture (10s vs 4.75 for example) and less on hot / WINNING streaks (see Haley’s Comet commentary below).
But for now,
ZH: There's A "Crisis Brewing": Powell & Piss-Poor Auction Spark Chaos In Credit Markets, Crypto Soars
AND for somewhat more on that p!ss poor auction sparking chaos,
ZH: Stocks Tumble, Yield Surge After Catastrophic 30Y Auction Stops With Biggest Tail On Record As Foreign Demand Craters
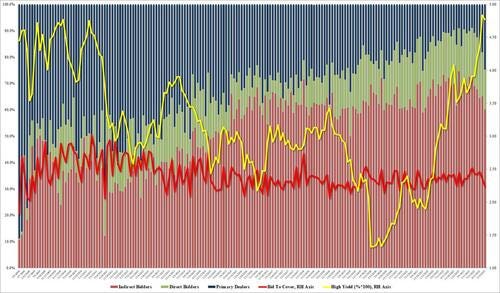
… The bond priced at a high yield of 4.769%, which was below last month's 4.837%, and just shy of the April 2010 high. But more importantly, it tailed the When Issued by a whopping 5.3bps, which was... well... terrible, because as shown in the chart below, this was the biggest tail on record (going back to 2016).
… The internals were even worse as foreign bidders (Indirects) tumbled from 65.1% to 60.1%, the lowest since Nov 2021, and with Directs taking down only 15.2%, banks (Dealers) were forced to step up and take the balance, or a whopping 24.7%, double the recent average of 12.7%, and the highest since Nov 2021.
This is a big warning flag because every time we have seen a surge in Dealer takedowns, some sort of Fed intervention - QE or otherwise - has usually followed and we doubt this time will be different.
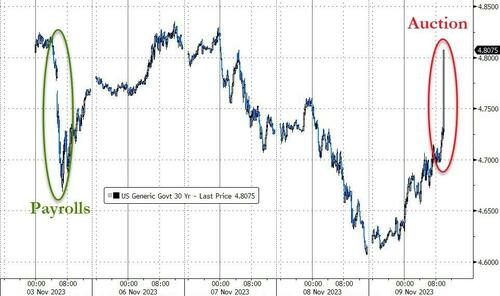
… Treasury yields - as you would expect - exploded higher, with 30Y Yields back up to pre-payrolls levels...
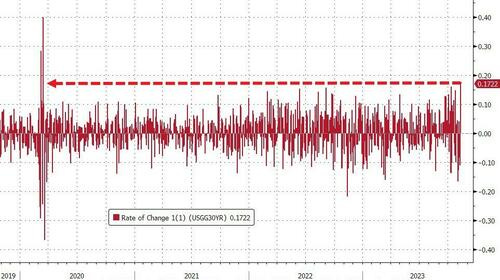
That is the biggest spike in 30Y yields since March 2020...
… here is a snapshot OF USTs as of 714a:
… HERE is what this shop says be behind the price action overnight…
… WHILE YOU SLEPT
Treasuries are modestly lower with the curve a hair steeper as UK and German bond markets bear-steepen to catch-up (?) with yesterday afternoon's action here. DXY is little changed while front WTI futures are higher (+1%). Asian stocks were mixed-lower, EU and UK share markets are lower (SX5E -1%) while ES futures are showing -0.1% here at 6:45am. Our overnight US rates flows saw a modest rebound in Treasuries during Asian hours with better buying a theme there (mostly intermediates). Overnight Treasury volume was ~110% of average.… next attachment zooms out to the medium-term, weekly chart of Tsy 10yrs where medium-term momentum (lower panel) maintains the bull signal initiated and confirmed last week. We've learned over the decades that when presented with signal conflict like this, always defer to the longer-term signal. Thus, the "Yes" above... We'll have to see how things evolve but the good news is that markets have a 10-day holiday from new coupon supply (20's next) with rising supply, and the supply-demand balance, remaining a foremost and predictable macro concern here. We don't think supply will be a top concern for markets if/when the trajectory of the economy turns south. But supply concerns should remain top-of-mind if, say, labor markets remain tight. We doubt that's controversial after yesterday's foot fault in the 30yr auction.
AND for MORE a deep dive and longer-term context, check out ODs QUARTERLY chart of 5yy … Moving along and for some MORE of the news you can use » The Morning Hark - 10 Nov 2023 and IGMs Press Picks (who CONTINUES to be sportin’ that new, fresh look) in effort to to help weed thru the noise (some of which can be found over here at Finviz).
AND from some of the news to some of THE VIEWS you might be able to use… here’s SOME of what Global Wall St is sayin’ …
Barclays - October Atlanta Fed wage tracker stabilizes alongside easing underlying growth
The unsmoothed October Atlanta Fed wage tracker print increased, while the weighted 3mma measure showed no change from September. Our state-space model, which draws signals about the underlying pace of wage growth from available measures, shows a slight deceleration after incorporating this data.
BNP - Duration demand: Rotation from longer into shorter maturities
The unprecedented rise in interest rates, combined with a significant inversion of the curve, have prompted important behavioural shifts in the EUR rates market in 2023.
Households have been moving away from sight deposits to better-remunerated term deposits offered by banks and MMFs. Term deposits owned by non-financial corporations have also surged to record highs.
More importantly, households’ preference is skewed towards short-term sovereign bills and bonds offering greater returns than bank deposits and life insurance products.
This rotation away from institutional products has important repercussions: less demand for long-term sovereign bonds from the likes of banks and insurers, while the retail sector continues to support the front end of the sovereign curve.
With another record sovereign bond supply pencilled in for next year, the demand backdrop is looking increasingly challenging at the long end, even more so as this time, EGBs will have to compete with record supply in other regions, and no buying from the ECB (see Global rates: More duration to digest in 2024, 9 November 2023).
This is an update of EGB: QT, what kind of drop?, where we highlighted the risk skewed to steeper curves as a result of this rotation in demand.
BNP - US rates: Closing 3s10s steepener after raising stop (profits. book em, Dano)
We entered a 3s10s UST steepener at -19bp on 13 October and subsequently raised the stop to -13bp on 19 October.
We continue to see scope for the curve to steepen in either direction for the broad levels of rates – bull steepening in the event the US economy continues to slow in Q4 2023 and into H1 2024 (as we forecast), or bear steepening if the US economy again proves more resilient while the Fed remains more patient before considering re-engaging in rate hikes.
However, elevated rate and curve volatility led us to tighten the stop on the trade after good performance following initiation. This volatility has persisted and the curve has materially bull flattened over the past week. The trade reached our -13bp stop and we have closed the position at a 3.5bp profit including carry (USD175,000).
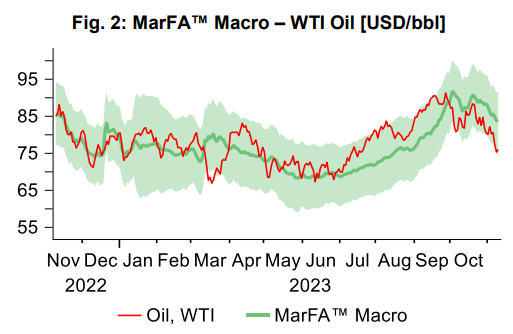
BNP - QTOW: Initiating long WTI position
KEY MESSAGES
We are initiating a long WTI oil trade idea. Our MarFA™ valuation and market risk premia signals are aligned and suggest fading the recent decline of WTI.
Our models points to a further recovery of the risk backdrop in the weeks ahead, as we flagged in Quant Trades of the Week and BNP Paribas Markets 360 Call - The prospects of a further risk recovery.
Commodities are an outlier, with our Risk Premium Index having breached high-risk premium territory. From a quantitative perspective, this means that risk aversion in commodity markets appears extreme and should be faded…
CitiFX Techs - Muddy waters for yields (stick with bull-steepening view for now BUT if 2yy close > week high of 5.0873 which would be > 55dMA, THEN reevaluate)
US 10y yields posted a bullish outside day, at similar levels to the bullish outside day on October 12.
Why it matters: The bullish outside day hints at potential short term upside to 10 year yields. This emphasizes we are in choppy waters.
However, this does not change our view on medium term bull-steepening for now, with our focus on bearish weekly indicators…
… Short-term upside, but medium term picture unchanged (for now)
DB - What a difference a week makes for the Fed's FCI
Back in June, researchers at the Fed developed a financial conditions index, which they termed FCI-G, that was able to map both contemporaneous and lagged changes in financial variables into their impact on growth. In this piece, we utilize their methodology to produce a version of the FCI-G at a daily frequency.
Our daily index gives a near real-time look into how financial conditions evolve over time and can capture specific catalysts with respect to tightening (or loosening) in financial conditions. Recent examples of tightening catalysts for financial conditions appear to be the August 2nd Treasury refunding statement, the September 20th FOMC meeting, and the stronger-than-expected September retail sales data on October 17th , after all of which our index takes a marked leg up.
Another benefit of our daily approach is that the data can speak on its own with respect to the persistence of moves in financial conditions. Indeed, in the wake of the November 1st FOMC meeting, which the market took dovishly, we have seen a roughly 20% unwind of the tightening seen since the beginning of October and about 10% of the tightening since August. The easing is even more prominent in the one-year lookback version, in which the recent moves have unwound all of the October tightening and are actually easier than they were in August.
DB CoTD: Halley's Comet (putting equity winning streak into context and in effort to make SOMETHING of an early start on creation OF narratives …)
… a 9-day run has happened 31 times in the last 95 years it actually hasn’t happened since 2004. So that’s one to watch today. If we end the week with 2 more up days, the 10-day run will be the first since 1995, even though they’ve happened every 6.3 years on average over the last 95 years.
In the last 95 years:
An 8-day winning streak has happened 63 times (average c. every 1.5 years)
A 9-day streak has happened 31 times (average c. every 3.1 years)
A 10-day streak has happened 15 times (average c. every 6.3 years)
An 11-day streak has happened 8 times (average c. every 11.9 years)
A 12-day streak has happened 5 times (average c. every 19 years)
A 13-day streak has happened 1 time (average c. every 95 years)
A 14-day streak has happened 1 time (average c. every 95 years)These are cumulative so it’s how many times we’ve passed these points. So the current run is something that happens around every 18 months on average. However for every day this run continues the rarity values roughly doubles until we get beyond day 12, a point where there’s only been one longer run, a 14-day winning streak in 1971…
… If it continues going up though, then next week could see an event rarer than Halley’s Comet.
UBS - Continuing claims climb. Trade balance expands. Credit card debt spikes.
…FRB of New York's Household Debt and Credit report, released on Tuesday, found that as of Q3, Americans collectively owe just over $1 trillion in credit card debt. On a quarterly basis, credit card borrowing levels rose by $48 billion (4.7%), and over the past year these types of outstanding balances have recorded a $154 billion increase. That's the largest increase since FRB of New York began tracking the data in 1999. Balances on mortgages, student loans, and auto loans all posted increases as well, bringing the total level of household debt to $17.3 trillion. A blog post from FRB of New York's Liberty Street Economics also noted rising credit card delinquency rates across all birth generation cohorts, surpassing pre-pandemic norms. The trend is particularly acute amongst those younger than age 39. See the figure below.
Yardeni - Powell Is Still Calling The Shots (mostly behind paywall BUT … idea that JPOW callin’ shots — what I think you need to know … )
The bid-to-cover ratio is the dollar value of bids compared with the dollar value of debt offered. Falling bid-to-cover ratios indicate less robust interest from investors. Yields climbed today after a weak auction of $24 billion in 30-year Treasuries with demand for the debt at 2.24 times the bonds on sale (chart).
That helped to push stock prices lower today, snapping the longest winning streaks for the Nasdaq and S&P 500 in two years. Both indexes are running into some profit taking right around their 50-day moving averages …
… And from Global Wall Street inbox TO the WWW,
Bloomberg: Five Things You Need to Know to Start Your Day (Asia — chart of long end via TLT and options)
… Treasuries tumbled to undo part of this week’s sharp rally, and once more the longer end of the curve was a key pain point. Fed Chair Jerome Powell’s pushback against the idea that rate hikes are done undoubtedly played a role. The spike in yields was the largest for 20- and 30-year notes. That was more about fresh concerns that investors will struggle to absorb the swelling supply of US government securities.
The result was another day of outsize yield moves, as Treasuries defy traders’ expectations for a calmer market now that the Fed is at the very least close to the end of its tightening cycle. Just take a look at the widening gap between actual and implied volatility for the iShares 20+ Year Treasury Bond ETF. Actual 30-day price swings for the $42 billion fund keep climbing to fresh post-pandemic highs, despite the drop in expected volatility to the lowest in September.
Bloomberg: Memo to Powell and Ueda — Markets Don’t Do Nuance (AUCTION tail greeted by some commentary by JPOW … and ‘bout that streak…)
… A few hours later, Jerome Powell spoke on a panel organized by the International Monetary Fund and started by reiterating almost exactly what he had said only last week after the latest meeting of the Federal Open Market Committee. As he has said before, if it were to become appropriate to tighten policy further, “we will not hesitate to do so.” What grabbed attention was a slight change of wording in his introductory remarks, in which he warned of “the risk of being misled by a few good months of data” and complained that there had been low-inflationary “head-fakes” in the past.
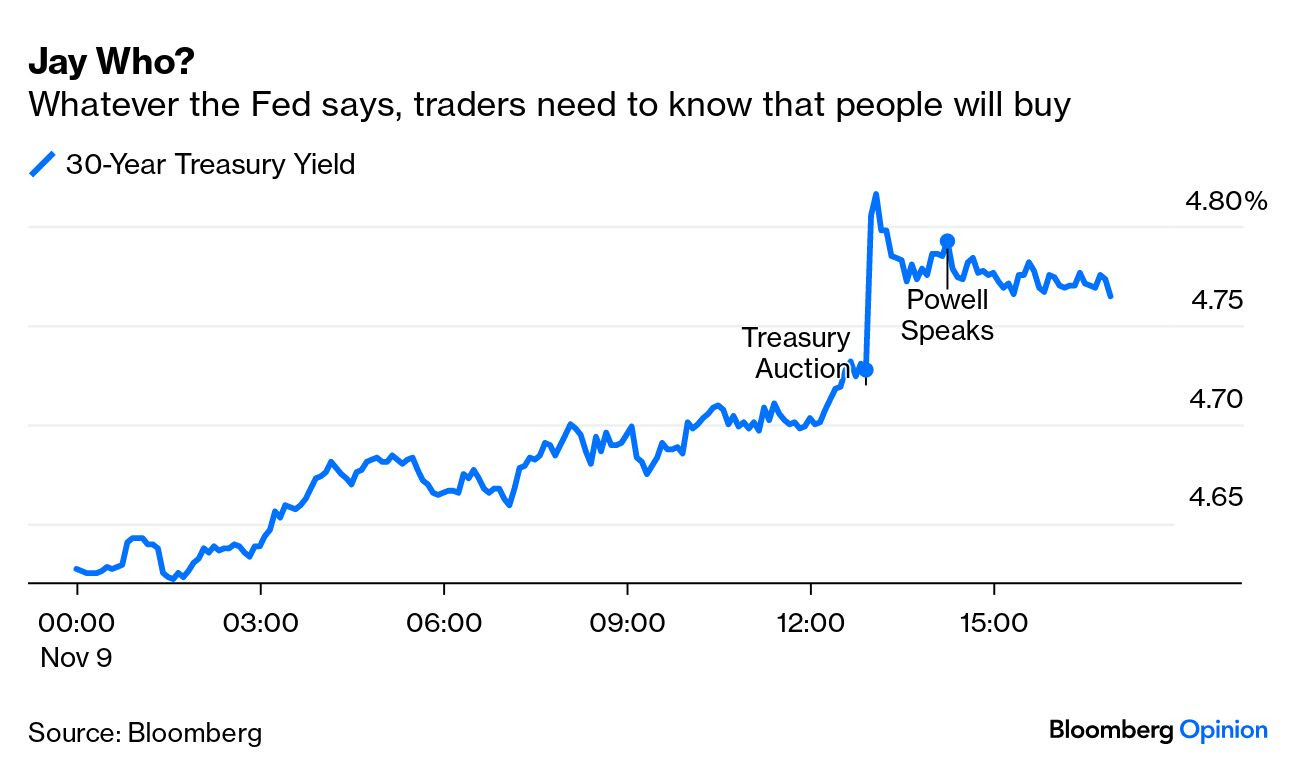
That was enough to scare the bond markets. Powell was trying to correct the impression from last week that the Fed thought it was done hiking rates. But not for the first time recently, what Powell said seemed secondary to news of the actual demand for bonds at auction. He spoke an hour after the Treasury had held an auction of 30-year bonds, which had attracted disappointingly little interest. A chart of the 30-year yield accurately captures which made the greater impact on the market:
If it really looks like the Treasury is going to have problems funding Uncle Sam’s copious debt, that’s scary. Meanwhile, Powell did little more than offer some clarification. Former colleague Krishna Guha, of Evercore ISI, said that Powell’s words shouldn’t be seen as a “substantive shift in policy signaling” so much as a “tone-correction.” He added that it did not appear to be a serious attempt to convince investors that a hike in December was back “in play.” That’s about right.
Intriguingly, Powell also seems to have achieved a “tone correction” of the S&P 500, which fell for the day. The US stock index had been on an eight-day streak of up days. A ninth would have made it the longest in almost 20 years. But throughout that streak, it appears that the bond market held the whip hand. With yields having risen arguably too far and fast, it didn’t take much to spark a rebound in the stock market, and the two markets seemed intimately connected last week. The streak ended, not at all coincidentally, when yields registered another sharp rise:
Streaks have a great hold over the human imagination. but their importance is overrated. For an example, from an embittered Red Sox fan: The Yankees’ Joe DiMaggio had a streak of 56 games with a hit in 1941, but he batted .357 for the season, while Boston’s Ted Williams batted a far superior .406. In the 82 seasons since then, nobody has come close to replicating either feat. Does anyone seriously think that DiMaggio’s clearly inferior season was better because his hits were bunched in a particular way? Long streaks are improbable, thanks to randomness. But also, thanks to randomness, they do happen every so often. In baseball, as in markets in the last two weeks, we can be fooled by randomness (as someone once said).
For a better take on this, and the way that the bond market and worries about whether there will be enough buyers for all the debt coming through the pipes now dominate stocks, read this great column by Jonathan Levin. But the bottom line is that the stock market has been busily overreacting to the overreactions going on in bonds. It’s not that surprising, and we can expect the bond market to maintain its primacy for a while yet.
Bloomberg: Griffin Says Peace Dividend Over, High Inflation to Last Decades (HE’s a billionaire and not yet on substack SO maybe worth a click??)
… “The peace dividend is clearly at the end of the road,” Griffin said at the Bloomberg New Economy Forum on Thursday in Singapore, referencing the Russia-Ukraine and Israel-Hamas wars. “We are likely to see higher real rates and we’re likely to see higher nominal rates.”..
Bloomberg: Yield Uncertainty Will Persist Even If the Fed Is Done Raising Rates (we know how Global Wall St — El-Erian WAS a card carrying member, don’t forget — LOVES uncertainty as perceived uncertainty = JOB SECURITY for narrative creators … just sayin’)
A hard-to-read economy and expanding government bond issuance will keep investors on their toes.
Bloomberg: Bond Sales Are Becoming a Bigger Deal for Stocks Than US Jobs Data (should likely recycle this one in the weeks and months of supply ahead)
Days of debt sales are new event risk for equities: Citigroup
Stocks’ sensitivity to rates puts focus on investor demand
US Treasury auctions are exerting a growing sway over stocks, underscoring how the path of interest rates is gripping markets of late.
That’s the take from Citigroup Inc. data showing that the S&P 500 Index has moved about 1% in either direction on auction days since the start of 2022, eclipsing the prior decade’s average.
Of the 22 sales analyzed, all of 30-year bonds, subsequent moves in stocks were bigger than for monthly payrolls data – which traders typically sweat over to assess the health of the economy and Federal Reserve policy. Ten-year auctions produced a similar result, according to the study, led by Stuart Kaiser, Citigroup’s head of US equity trading strategy.
Their analysis leaves equity traders on high alert for Thursday’s $24 billion sale of 30-year auctions in a busy week for US government borrowing. A 10-year auction Wednesday drew slightly weaker demand than expected.
… “A lot of the long-duration assets out there within equities have been doing really well as of late because the thinking is the Fed is done and they’re going to wait and see and then start cutting,” said David Neuhauser, founder and chief investment officer of hedge fund Livermore Partners.
A lousy auction, he said, “could really throw water on that thesis going forward if there is going to be a much higher yield for the longer-duration bond as the government tries to raise capital.” …
… Stepping Back
And while auction sizes have jumped, some traditional buyers aren’t participating, says Althea Spinozzi, a fixed-income strategist at Saxo Bank A/S. The result is that some auctions have tailed, meaning they’ve required higher yields to entice buyers.“We have seen that whenever an auction tailed in the past few weeks, the market followed, selling US Treasuries,” she said. Depending on how much yields rise in such cases, “the impact in the stock market can be more considerable.”
It’s not to say higher yields are a lock after a soft auction. Wednesday’s 10-year sale produced a tail and yields still fell, in part as traders focused on slumping oil prices.
…“But if we see some stream of softer growth data, market focus will return to Fed policy cuts, which is positive for US Treasuries,” she said. “Yields, in theory, impact funding rates for the private sector.”Bloomberg: Financial Assets Are Running Out Of Steam For Now
The impressive rally in stocks and bonds over the last week or two is likely to take a breather, with both assets now overbought in the short term.
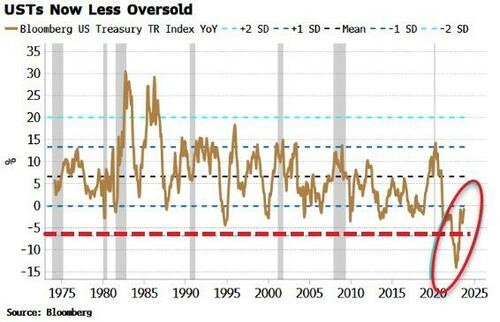
Bonds have been deeply oversold since last year, but the latest rally to ~4.5% in the 10-year has taken Treasuries to only one standard deviation below their long-term mean growth level (back towards the range they normally inhabited before the extremes of the pandemic).
The stock rally in recent months has taken the S&P back to near its long-term average growth level of 10% on an annual basis…
… Overall this leaves the stock-bond ratio a little overbought, so it may come off a little more.
Bloomberg: As Recession Noise Grows, Recession Signal Is Fading
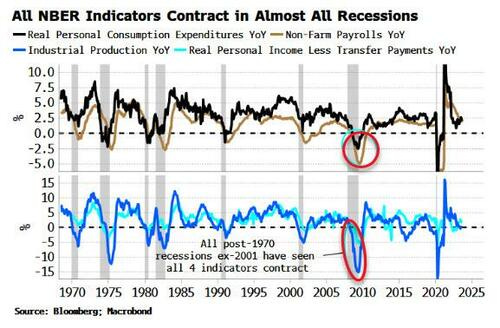
… Let’s start there. In the chart below we can see the four series over the last 50+ years. All of them contracted on an annual basis at some point during each NBER recession since 1970, apart from the one in 2001, where real PCE didn’t contract (recessions are vertical gray bars in the chart below).
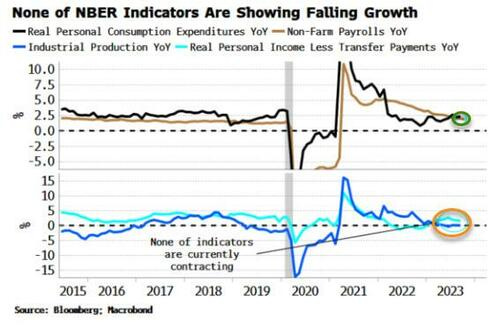
Zooming in to the present in the next chart, we can see that none of the four indicators are currently contracting. Industrial production is flat-lining around zero, payrolls growth is turning lower from a high level, while real PCE and real personal income are positive and have been rising.
Not only is the NBER very unlikely to call a recession based on the current state of play, leading data shows that is unlikely to change in the next 6-9 months.
All four indicators are coincident-to-lagging, and most of them are released with a delay.
That’s why we must turn to leading data series to pre-empt the NBER. It is increasingly pointing in the direction that the current slowdown won’t last quite long enough (have the duration) or fall hard enough (have the depth) to trigger an NBER recession…
FirstTrust: Three on Thursday - M2 and Inflation
… M2 Money Supply vs. CPI
As Friedman observed, there is a lag in the impact of money on inflation and the surge in the money supply took about a year to noticeably affect prices. Recently, the M2 money supply has started to decline. The level of M2 remains comfortably above the long-term trend, which alleviates deflation concerns, but if this trend persists, the growth rate of inflation should continue to come down.
LPL: The Winning Streak Continues (funny that it was written and sent as the streak came to an end? perhaps they are talkin’ about some other ‘streak’)
Key Takeaways:
The S&P 500 and Nasdaq Composite are riding respective eight- and nine-day winning streaks into Thursday. Oversold conditions, solid earnings, and a sharp pullback in interest rates have been the primary drivers of the rebound.
How long will the streaks last? History implies roughly 50% odds the indexes will extend their winning streaks in today’s session.
And while all winning streaks eventually end, the degree of consistent buying pressure in U.S. equity markets suggests investor confidence is improving and momentum is building.
Furthermore, winning streaks of this magnitude are not only rare, but they are also associated with solid forward returns over the next 12 months.
… From a technical perspective, the S&P 500 has climbed back above its 50- and 200-day moving averages, closing on Wednesday just below key resistance at 4,400. A breakout above this level would reverse the S&P 500’s current downtrend and check the box for a higher high, raising the probability that the correction lows were set last month. A similar technical story has developed on the Nasdaq Composite, which needs to clear 13,660 to break its October highs.
The S&P 500 & Nasdaq Composite have Rebounded Back to Inflection Points
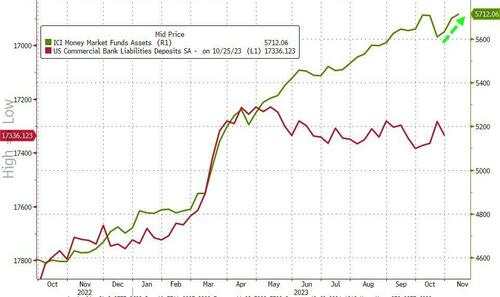
ZH: Fed's Emergency Bank Funding Facility Explodes Higher, QT Stalls As Money-Market Funds Hit Record High
… The resurgence in money-market fund inflows is diverging from bank deposits (which are gently rising on a seasonally-adjusted basis)...
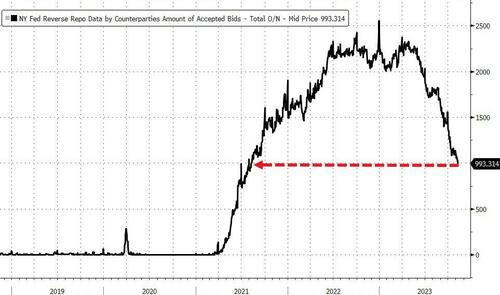
Meanwhile, as we detailed earlier, the amount of money that investors are parking at The Fed's reverse repo facility dropped below $1 trillion for the first time in more than two years.
It marks a steep decline from a record $2.554 trillion stashed on Dec. 30 and is the smallest sum since August 2021.
“It’s a big number,” said Deutsche Bank strategist Steven Zeng, referring to the decline past $1 trillion.
“I can see it falling further with dealers owning so much of the new bond.”
Demand for the facility, however, has been fading this year as the Treasury ramped up fresh bill issuance, offering an alternative for short-term investors.
But as Bloomberg notes, as usage of the Fed’s facility fades, Wall Street strategists are weighing whether there will be further impact on the central bank’s policy decisions. If demand falls toward zero, strategists say, the Fed will have to halt its quantitative tightening program because excess liquidity will have been completely drained and bank reserves will have reached a point of scarcity.
AND
… THAT is all for now. Off to the day job…


