(USTs lower, bear steepening on above avg volumes)while WE slept... ; "More disinflation is in store over the next year"; AND more 2024 darts thrown (Wells, Goldilocks)
Good morning … Overnight we recieved some ‘flation data from the Far East (China October CPI fell 0.2% yoy vs f/c -0.1%, PPI fell 2.6% yoy vs f/c -2.7%.) …
Reuters: China's consumer prices back in decline as recovery wobbles
… and Global Wall St has much more on this below. I’d only add that this is certainly adding a(nother) ray of HOPE (not a strategy) the Fed (and Bidenomics?) are to be #Winning the war against ‘flation …
… Lacy Hunt — latest quarterly HERE as well as on / in BBG noted YEST (and other bond bulls) are watching, perhaps even HOPING this dis/DEflation is China’s next great export ‘round the world.
Stock jockeys are watching TOO as S&Ps try to log 9th UP day in a row and if that happens, would be first time since something like 2004?
Whats it mean? NOT MUCH (IMO) but still will be a great weekend narrative talking point … See this mornings comic for more …
Be careful what you wish for (or at least the source of whatever it may be)?
Attempting to get back on track and stay IN my ‘lane’ of rates / macro observerations, I’ll say how impressed I am BY the bond markets move of late. The BID into and through yesterday’s DURATION SUPPLY impressive and so, ahead of this afternoons liquidity event … (aka 30yr auction) …
STILL watchin’ 50dMA (4.71%) along with free world and STILL hesitant with what momentum (stochastics, bottom panel) are showing … that said, time at a price can / will resolve and with EARL doing what ITS doing and China ‘flation … well, perhaps we’re just at beginning of the move … AND in case yesterday’s 10yr was to be any sort of guide …
ZH: Yields Remains At Session Lows After Medicore, Tailing 10Y Auction Which Sees Jump In Foreign Demand
… here is a snapshot OF USTs as of 711a:
… HERE is what this shop says be behind the price action overnight…
… WHILE YOU SLEPT
Treasuries are lower with the curve bear-steepening, following German and UK curves in doing the same this morning. DXY is little-changed while front WTI futures are modestly higher (+0.6%). Asian stocks were mostly higher (NKY +1.5%), EU and UK share markets are modestly higher while ES futures are showing +0.1% here at 6:30am. Our overnight US rates flows saw the bear-steepener begin during Asian hours but with little evidence of selling on our Tokyo desk. Instead, the featured flow during their hours was better real$ buying in the front-end. Overnight Treasury volume was quite solid at ~165% of average…… our second attachment, the weekly chart of Tsy 10yrs, illustrates why we suspect that 10yr yields are chipping away at the ~4.51% supply barrier-- eventually to break lower. In the lower panel you can see how medium-term (weekly) momentum aims clearly lower still with the idea being that if/when 10's take out 4.51% resistance, then the next stop might be the former range highs near 4.34%, as drawn in.
… and for some MORE of the news you can use » The Morning Hark - 9 Nov 2023 and IGMs Press Picks (who CONTINUES to be sportin’ that new, fresh look) in effort to to help weed thru the noise (some of which can be found over here at Finviz).
Moving from some of the news to some of THE VIEWS you might be able to use… here’s SOME of what Global Wall St is sayin’ …
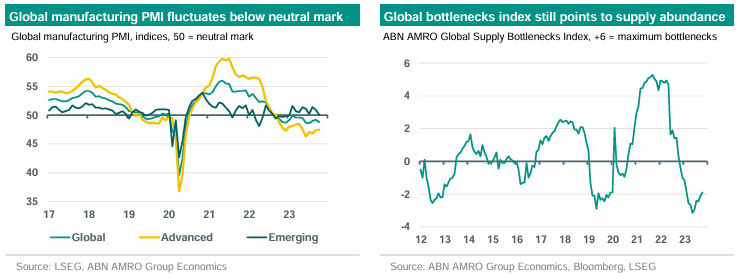
ABNAmro - Global manufacturing: Still downbeat | Insights newsletter (think GLOBALLY act locally?)
Global manufacturing PMI drops back in October, remaining in contraction mode. Supply conditions still stronger than demand conditions. Composite PMI a less reliable indicator than in the past.
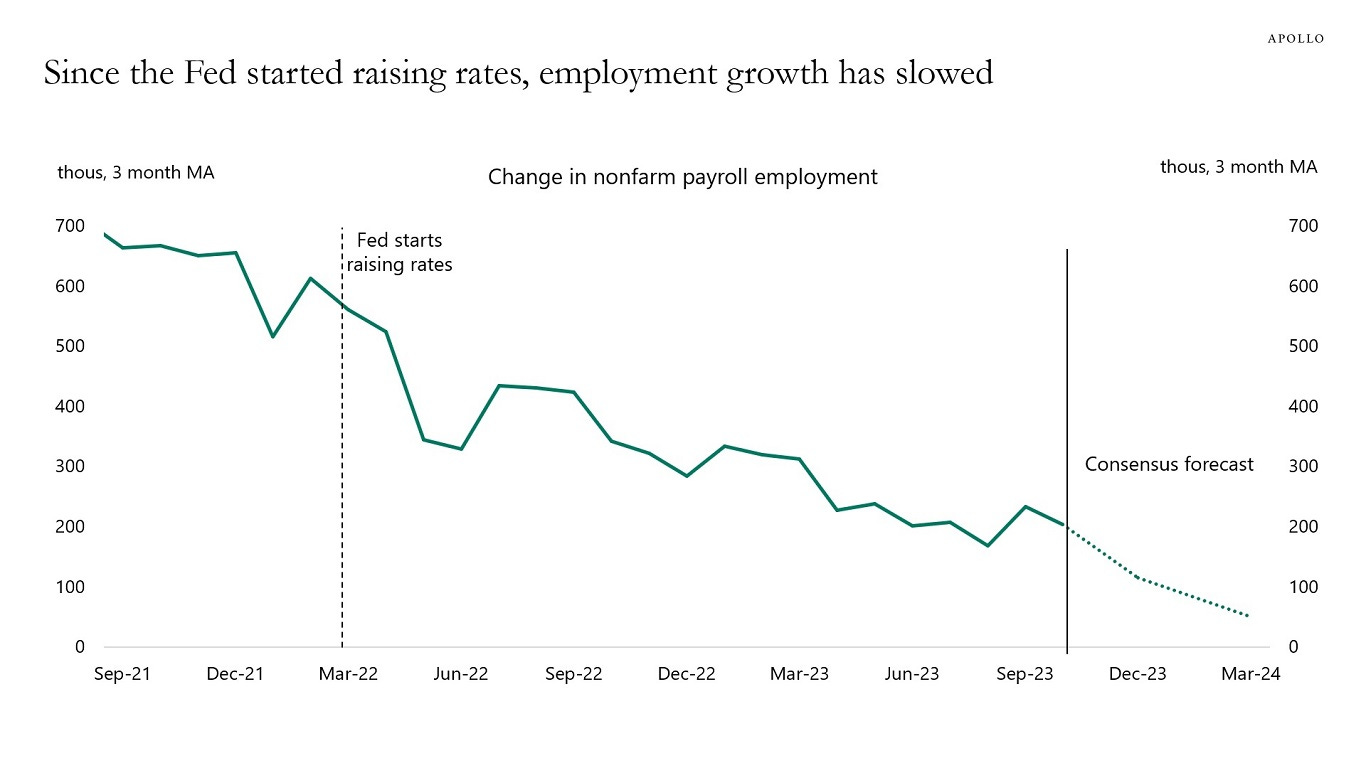
Apollo - Soft Landing in Both Parts of the Fed’s Dual Mandate (#Winning!!)
… In short, everyone who is bullish on equities and lower-rated credit should ask themselves where they think the labor market will be in three months, with the Fed on hold and not showing any signs of cutting anytime soon.
Barclays - China: Struggle against deflation (may be some hope they export this ‘round the world and so, Fed can continue #Winning … Lacy Hunt and other bond bulls, too)
Outright CPI and PPI deflation confirms the weakness of domestic demand and subdued sentiment among consumers and firms. We lower our annual CPI inflation forecasts to 0.3% (from 0.5%) and 1.2% (from 1.6%) for 2023 and 2024. We expect PPI deflation to continue through to mid-2024 despite low base effects.
Barclays - US CPI Inflation Preview (October 2023 CPI): Similar strength, more uncertainty
We forecast headline CPI growth of 0.1% m/m sa, bringing the annual rate lower to 3.3% y/y, and the NSA to print at 307.864. We estimate that core inflation pressures accelerated slightly, to 0.36% m/m, as firm core services inflation is likely to be only partly offset by a more modest deflation in goods prices.
BAML - The Longest Pictures (as a visual learner this one helps with tremendous context and will have to keep digging through this one for more BUT in addition TO what was noted yesterday … banks and stocks vs bond yields … and how some others out there just focus on STOCKS > WWW, “A very long-term chart of U.S. stock prices usually going up” Sam Ro TKer … I digress, here’s a(nother) reason mmkt mutual funds have gathered assets … the very front end of the curve now offering an alternative … and from 3mo we are ALSO offered a look out the curve … 10yy)
… US 3-month Treasury Bill since 1920
The US 3-month Treasury Bill yielded 5.5% in Oct 2023, a 23-year high. It fell to a record low of -25bps in Mar 2020.
Rates were close to zero for 15 years during the 1930s and early-1940s, thereafter rising in the next 3 decades to an all-time high of 17.1% in Dec 1980.
The Fed rate hike in Dec 2015 marked the end of the longest period (113 months) without a rate rise in Federal Reserve history.
US short-term rates were essentially zero from Nov 2008 to mid-‘17, a longer period at zero than even during the 1930s.
US 10-year Treasury yields since 1790
2020 marked the secular low for inflation & yields…the 3rd great bond bear market is now underway.
The prior great bond bear markets were 1899 to 1920 and 1946 to 1981.
The 10-year rolling return from US government bonds has fallen sharply to 0.6% from 16.3% in Sep 1991; over the same period, the 10-year rolling return from US corporate bonds has fallen to 3.0% from 15.9%…
DB - Early Morning Reid (on bonds, yesterday…)
… The bond rally continued over the last 24 hours, with long-end yields falling to their lowest level in weeks as investors grew more confident that inflation was set to fall back and that central banks were now finished with their rate hikes. In part, that was driven by another round of oil price declines, with Brent crude closing beneath $80/bbl for the first time since July, whilst WTI closed beneath $76/bbl. And even though risk assets lost some of their recent momentum given the concerns about economic demand, the S&P 500 (+0.10%) still managed to post an 8th consecutive gain for the first time since late-2021. In fact, if we manage to get a 9th consecutive advance today, that would make it the longest run of gains since 2004, although futures for the S&P 500 are slightly negative overnight, with a -0.03% decline.
For Treasuries, there was a sizeable rally at the long-end of the curve, with yields falling to their lowest levels in some time. Most notably, the 10yr yield fell back -7.4bps to a 6-week low of 4.49%, marking the first time it’s closed below 4.5% since the Friday after the September FOMC meeting. That rally had been underway early in the session, but there was a further advance thanks to a mixed $40bn 10yr auction, with a positive reaction to the market’s ability to digest increased issuance volumes. The 30yr yield was down by a larger -11.1bps to 4.61% ahead of the 30yr auction today. That’s a sizeable decline from their recent levels, as it was only on Tuesday of last week that the 30yr yield closed at 5.09%.
Those moves come as there are already signs that this decline is filtering through to the real economy, with data from the Mortgage Bankers Association showing that the average 30yr fixed mortgage rate was down -25bps to 7.61% over the week ending November 3. That’s the biggest weekly decline since July 2022, as well as the third-biggest weekly decline since the GFC. And in turn, it helped the index of mortgage applications for home purchase rise from its lowest level since 1995 the previous week.
Goldilocks - China: Headline CPI inflation turned negative again on further food price deflation
Bottom line: China's CPI inflation turned negative again (year-over-year) in October mainly on widened pork price deflation, slightly missing consensus expectations. PPI deflation widened slightly in October in year-over-year terms due to lower prices of crude oil and nonferrous metals. Looking ahead, in year-over-year terms, we expect PPI deflation to narrow further. Headline CPI inflation should rise gradually in the coming months, although persistent pork prices deflation is likely to slow the pace.
Goldilocks - Macro Outlook 2024: The Hard Part Is Over (2024 dart throwing exercise now well underway …)
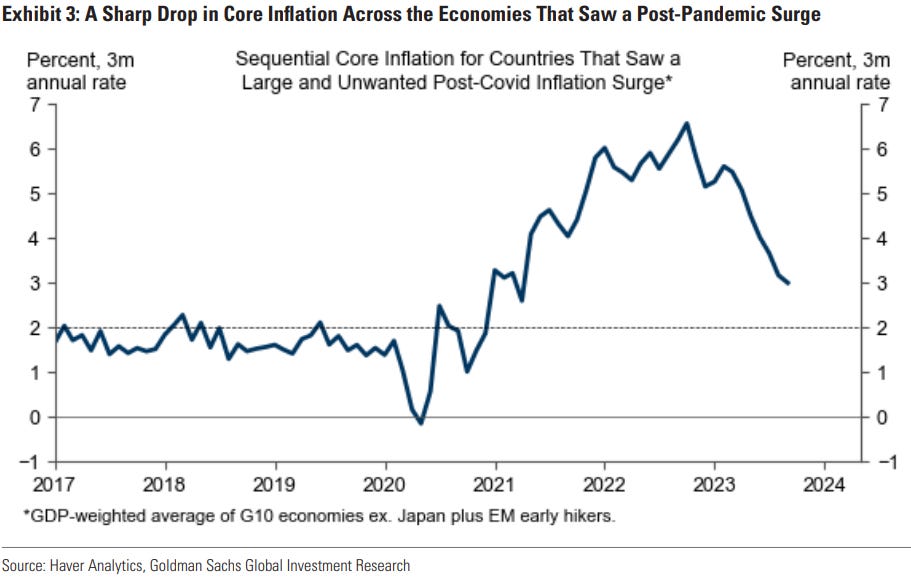
■ The global economy has outperformed even our optimistic expectations in 2023. GDP growth is on track to beat consensus forecasts from a year ago by 1pp globally and 2pp in the US, while core inflation is down from 6% in 2022 to 3% sequentially across economies that saw a post-covid price surge.
■ More disinflation is in store over the next year. Although the normalization in product and labor markets is now well advanced, its full disinflationary effect is still playing out, and core inflation should fall back to 2-2½% by end-2024.
■ We continue to see only limited recession risk and reaffirm our 15% US recession probability. We expect several tailwinds to global growth in 2024, including strong real household income growth, a smaller drag from monetary and fiscal tightening, a recovery in manufacturing activity, and an increased willingness of central banks to deliver insurance cuts if growth slows.
■ Most major DM central banks are likely finished hiking, but under our baseline forecast for a strong global economy, rate cuts probably won't arrive until 2024H2. When rates ultimately do settle, we expect central banks to leave policy rates above their current estimates of long-run sustainable levels.
■ The Bank of Japan will likely start moving to exit yield curve control in the spring before formally exiting and raising rates in 2024H2, assuming inflation remains on track to exceed its 2% target. Near-term growth in China should benefit from further policy stimulus, but China’s multi-year slowdown will likely continue.
■ The market outlook is complicated by compressed risk premia and markets that are quite well priced for our central case. We expect returns in rates, credit, equities, and commodities to exceed cash in 2024 under our baseline forecast. Each offers protection against a different tail risk, so a balanced asset mix should replace 2023’s cash focus, with a greater role for duration in portfolios.
■ The transition to a higher interest rate environment has been bumpy, but investors now face the prospect of much better forward returns on fixed income assets. The big question is whether a return to the pre-GFC rate backdrop is an equilibrium. The answer is more likely to be yes in the US than elsewhere, especially in Europe where sovereign stress might reemerge. Without a clear challenger to the US growth story, the dollar is likely to remain strong.… To demonstrate the size of the improvement, Exhibit 3 plots the average core CPI inflation rate of all G10 economies minus Japan (where higher inflation was desired) plus the EM “early hiker” economies that experienced the biggest inflation surges and thus delivered the most aggressive monetary policy tightening. Since the end of 2022, sequential core inflation in this group of economies has fallen from 6% to 3% sequentially. Central banks have therefore achieved more than three-quarters of the adjustment needed to get inflation back to their targets.
… The Last Mile
We don’t think the last mile of disinflation will be particularly hard. First, although the improvement in the supply-demand balance in the goods sector—measured for example by supplier delivery lags—is now largely complete, the impact on core goods disinflation is still unfolding and will likely continue through most of 2024 (Exhibit 6).Goldilocks - Global Markets Outlook 2024: Towards a Better Balance (10 themes where #1, 2, 3, 5 AND 6catching MY eyes…)
… We provide more detail on our Global Markets Outlook here, highlighting as usual 10 core investment themes that drive many of our market views. More detailed outlooks for the individual asset classes are forthcoming.
Parking the Plane: Inflation nearing target, no imminent US recession, but markets already priced for soft-ish landing.
The Great Escape (From a Low-Yield Equilibrium): Real yields on core assets mostly back to pre-GFC levels, so a more conventional opportunity set.
Loosening the Inflation Constraint: Further disinflation could open the door for a weak "Fed put", especially later in 2024.
US Exceptionalism—More on Growth than Inflation: A benign growth backdrop in most places, but US looks to be the "surest thing".
The Dark Side of “Higher for Longer”: Higher rates cause ongoing stress for some sovereigns and pockets of corporate and consumer sectors.
Valuing Duration: Better valuations and a shift from inflation to growth risks make duration more attractive for portfolios.
A Smaller Carry Cushion: Carry less appealing than all-in yield, limiting the upside even in benign cases.
Equities—Finding the Right Kind of "Yield": Valuations not uniformly stretched, potential upside if rates fall earlier.
EM—The Limits of Narrow Outperformance: Selective performance reaching limits, US rate relief needed to unlock broader gains.
Balancing Portfolios: More balance as non-cash assets outperform cash in our central case and each asset class protects against a different "tail".
UBS - Vol else equal: Why has equity volatility been so low?
2023 has largely been a story of volatility compression. We rationalize this past year's lower volatility environment, and why we think we now find ourselves at fairer levels — As featured in our Global Economics & Markets Outlook 2024-2025.
We examine the global equity volatility landscape across three drivers: 1) Macroeconomic volatility, 2) Corporate volatility, and 3) Market ('spike') volatility. Overall, we expect volatility to remain around the mid-to-high teens. On a 'sum of the parts' basis, we expect moderately higher macroeconomic volatility, partially offset by limited risks posed from both corporate and market volatility.
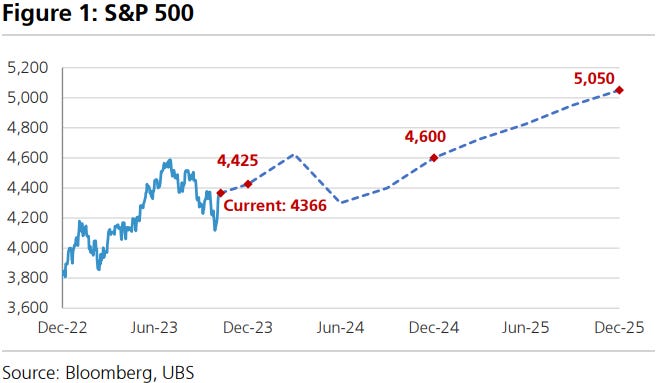
UBS - Global Economics & Markets Outlook 2024-2025 (is it that time already? yep yep it is … Global Wall St getting out their year ahead dart boards and warming up … HERE is 349pg full note with just one excerpt and here as with BAML picture book above, will take TIME to go thru … and in addition TO what was noted yesterday — 2s cleanest trade and the 10yy outlook … stocks leaning on the BAML ‘rule(r)’ — they always go UP? and…)
… S&P 500 to 4600 by Year-End 2024
S&P 500 to 4600 by Year-End 2024, 5.6% Upside over Next 14 Months
We are initiating our year-end 2024 S&P 500 price target of 4600, representing 5.6% upside over the next 14 months. This forecast is based on EPS estimates of $224, $228, and $249 for 2023-25, implying 1.8% and 9.2% YoY growth.…
Wells Fargo - 2024 Annual Outlook (hey now, Thing 1 has moved TO the Mountain WEST region — who are said — below — to be OUTPERFORMING … woo hoo ?)
Summary
Despite the 525 bps of rate hikes that the Federal Open Market Committee (FOMC) has implemented since March 2022, the U.S. economy generally remains resilient due, in large part, to continued strength in consumer spending. Meanwhile, inflation has receded.
We believe it would be premature to claim that the economic storm has passed, because the battle against inflation has not yet been decisively won.
There already are some cracks that are beginning to appear in the economy, and these strains likely will intensify in the coming months as monetary restraint remains in place. Our base case is that real GDP will contract modestly starting in mid-2024.
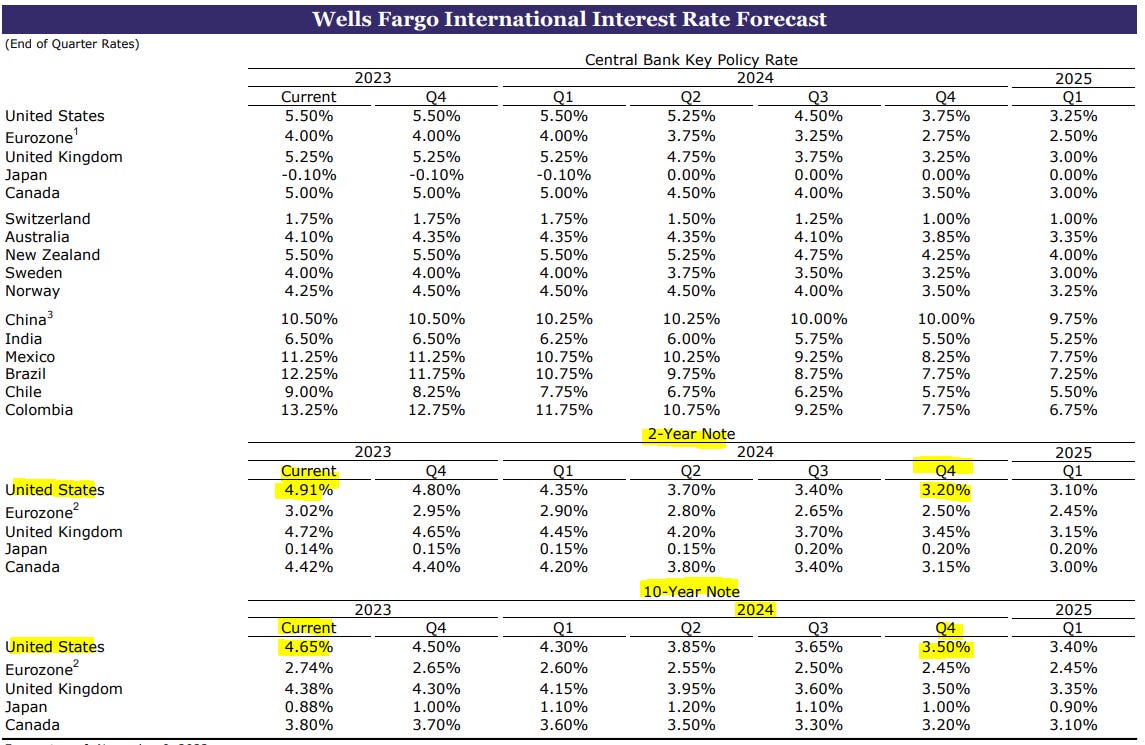
We look for the FOMC to cut its target range for the federal funds rate by 225 bps by early 2025, which is more than both Fed policymakers and market participants currently project.
Even if Fed policymakers are able to pull off a “soft landing,” real GDP growth in 2024 likely will be subpar, at best, due to the elevated level of real interest rates that will be needed to wring inflation out of the economy.
The Sun Belt and Mountain West have outperformed the Northeast and the Midwest in recent years, and these trends likely will remain in place for the foreseeable future.
In the commercial real estate market, storm clouds hover above the office sector and the multifamily sector. Fundamentals in the retail and industrial sectors are stronger.
We believe the global economy will face an unsettled climate in 2024, and the economic storm could be quite severe at certain times and for certain economies. In our view, the Eurozone and United Kingdom will be the hardest hit. China's economy likely will continue to face structural headwinds to growth. In contrast, the economic outlook for 2024 remains relatively sunny and clear in India.
The U.S. dollar should generally remain well-supported versus most foreign currencies in the first half of 2024. We then look for the trend of U.S. dollar strength to eventually wane and turn to U.S. dollar weakness later in 2024 as the Fed eases monetary policy.
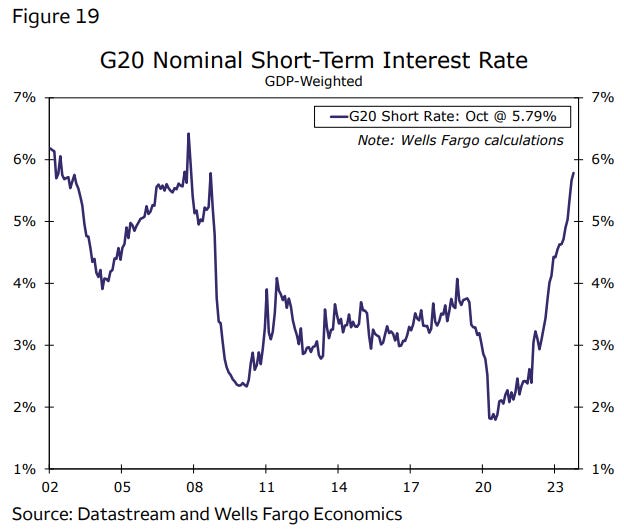
… As this monetary tightening has proceeded, we estimate that the average short-term nominal interest rate in the G20 economies has risen from below 2% during 2020 to around 5.75% currently (Figure 19). While we believe that many central banks have already reached the end of their rate hike cycles, and indeed some have already begun reducing interest rates, the long and variable lags between changes in monetary policy and their impact on economic growth and inflation mean the effects of restrictive monetary policy will likely continue to be felt for several quarters ahead. As we discuss below, however, that influence will likely be felt differently across major economies.
… And from Global Wall Street inbox TO the WWW,
Bloomberg - US 30-Year Mortgage Rate Tumbles by Most in More Than a Year (finally some good news to go along with relief at gas pump)
Contract rate dropped 25 basis points last week, to 7.61%
Mortgage applications for home purchases rose most since June
… The contract rate on a 30-year fixed mortgage slid 25 basis points to 7.61%, the lowest level since the end of September, according to the Mortgage Bankers Association. The group’s index of mortgage applications for home purchases increased 3% in the week ended Nov. 3, the data out Wednesday showed.
The second-straight weekly decline in mortgage rates is the first since mid-June and offers modest relief for a struggling housing market. Still, mortgage rates remain uncomfortably high and are discouraging many homeowners who have locked in rates at much lower levels from moving. That’s put pressure on supply and kept prices elevated…
Bloomberg Five Things You Need to Know to Start Your Day (Asia)
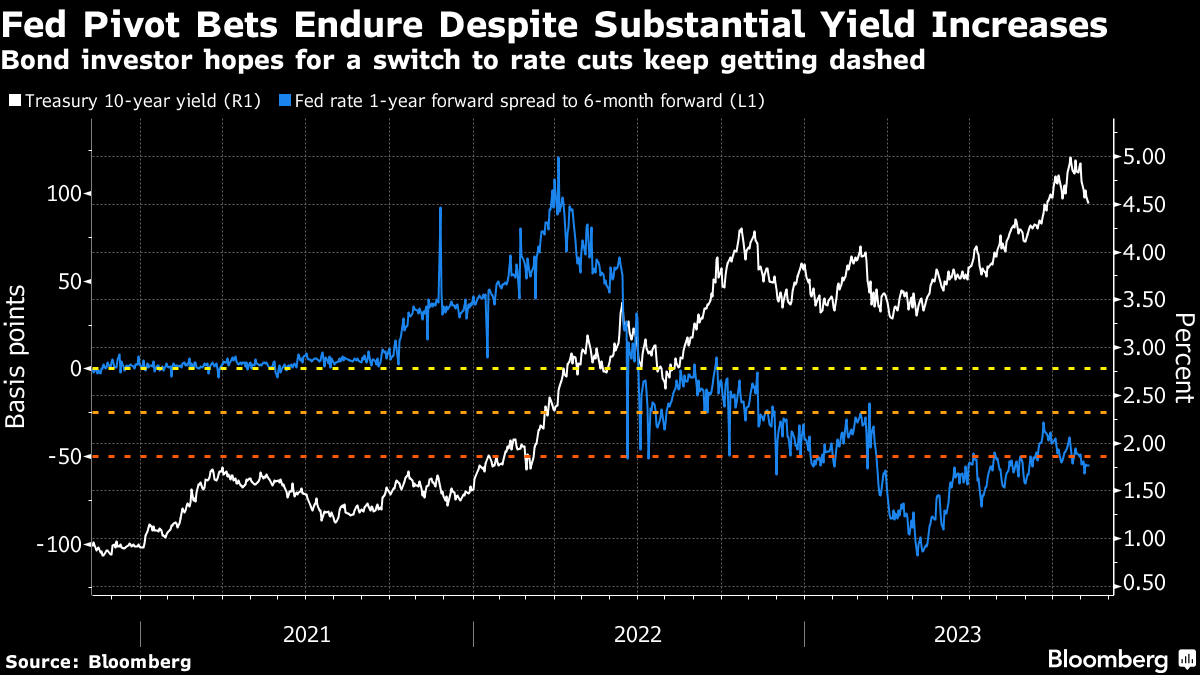
… Rates traders are about to mark a perhaps uncomfortable anniversary. Friday will be a year to the day since they switched to pricing in a Federal Reserve pivot to rate cuts within a year. The one-year forward US cash rate dropped to more than 25 basis points below the six-month forward on Nov. 10, 2022 and it has remained at or below that level pretty much ever since.
The uncomfortable part is that 10-year Treasury yield has climbed more than 36 basis points during the past 12 months, while the Fed has hiked its benchmark by 150 basis points. The bond market apparently decided that a pivot to rate cuts was inevitable as soon as it became apparent that the Fed would slow the pace of its hikes after delivering a fourth-straight 75 basis point increase last November. At some stage traders are likely to end up being right, but the pain trade for bonds remains a stickier tightening cycle than they anticipate.
ChartAdvisor - Examining the Treasury Yield Curve (specifically on long bonds…AND of seasonality …)
… 2/ Long Bond Bullish Divergence
One of the longest duration Treasury bond ETFs is the Vanguard Extended Duration Treasury ETF, EDV. Above are three different time frame charts for this ETF. The top Chart represents the monthly chart. The middle is the weekly and the bottom is the daily chart of EDV.
Across each of these time frames we can see that there is a Bullish Relative Strength Index (RSI) divergence. This is where the price of the position is moving to a new low, but the RSI made a higher low. Along with this divergence, EDV reached oversold conditions in each of the accompanying scenarios.
This may support a bounce in EDV over all time frames. But there is significant overhead resistance at the 74.30 price level. The response at each resistance level will be important to determine if the bounce has legs to run or is just an oversold reaction.
3/ Seasonality
Over the last 13 years, November has been one of the best months of the year for both stocks and bonds. The top chart is the seasonality pattern of the S&P500 index of the last 13 years, since the Great Financial Crisis. In November, the index closed higher 83% of the time with an average gain of 2.7%. November is only surpassed by July as the best month for the index during this time frame.
The bottom chart if the seasonality pattern of the Ten-Year Treasury Yield over the last 13 years. In November, the yield of the 10-year Treasury Bond closed higher only 42% of the time. Since bond prices move inversely to yields, this means that the price of the treasury closes higher 58% of the time.
Collectively this means that November can be one of the best months for a large cap stock and bond portfolio aside from July based on historical seasonality patterns.
StockCharts.com - Stock Indexes Continue Winning Streak: Growth Stocks Still In the Lead (leading with BONDS — TLT exactly…)
If there were one thing that was surprising about the stock market, it would be how quickly the charts changed in November. Equities trended higher, yields fell, and crude cracked.
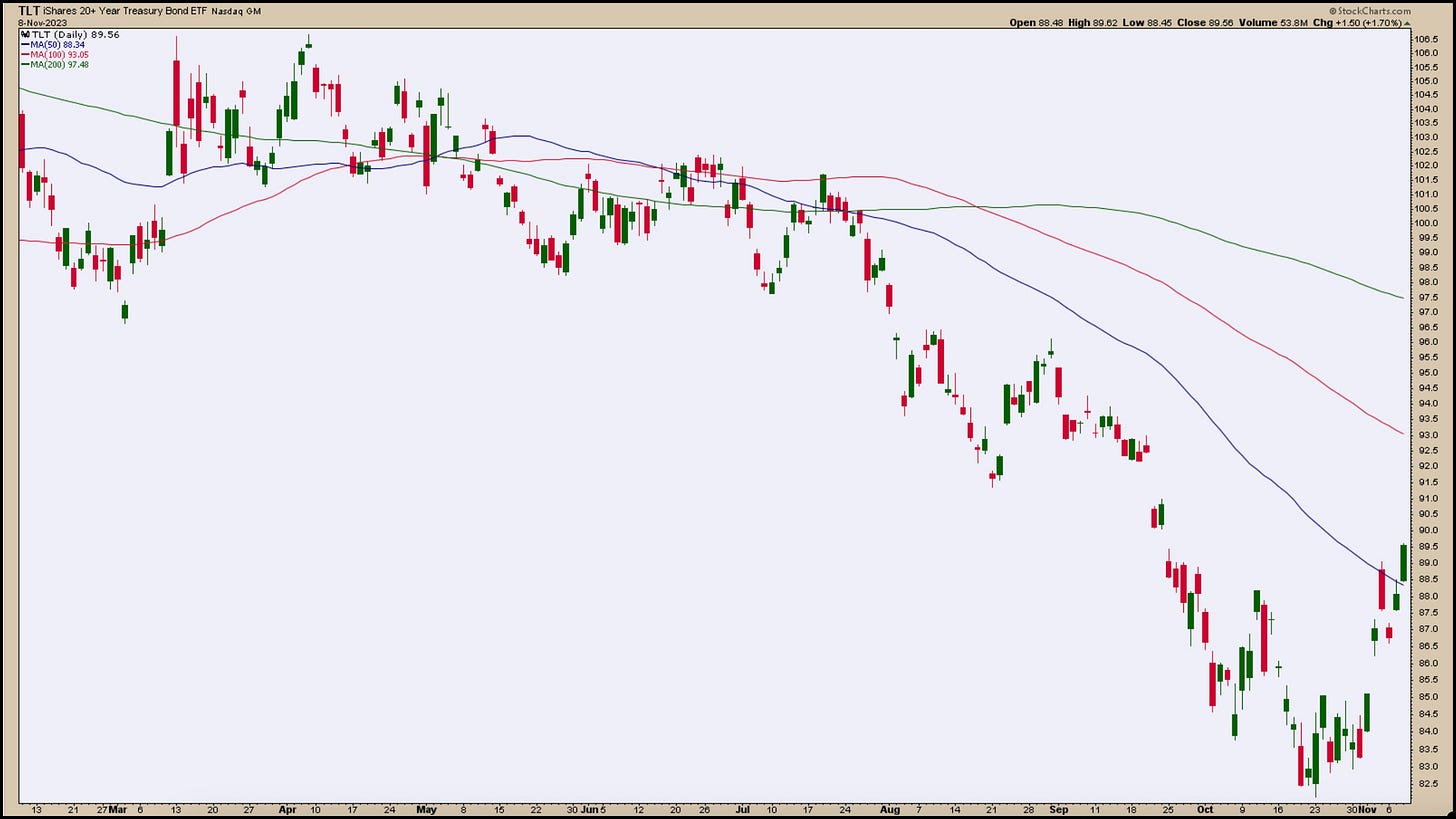
Treasury yields dropped—the 10-year yield dropped from close to 5% to around 4.5%—and is now below the support of its 50-day simple moving average (SMA). It's worth focusing on the chart of the iShares 20+ Year Treasury Bond ETF (TLT), which, after reaching a low of 82.14, bounced higher to 89.58, crossing above its 50-day SMA (see chart below).
CHART 1: TLT RISES ABOVE ITS 50-DAY MOVING AVERAGE. Are bonds finally getting some love? It seems like it, but there's still a ways to go before bonds confirm a bullish trend.
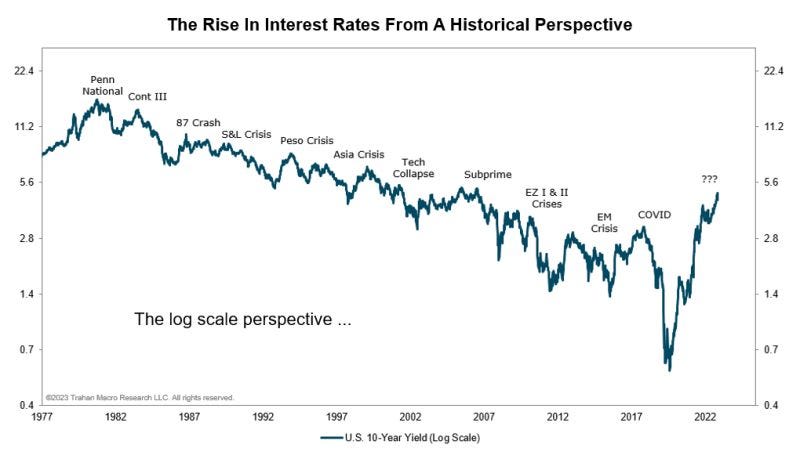
AT Francois TRAHAN (on LinkedIN — 10yy annotated)
There is plenty of work from academia that shows that a rise in rates from low levels packs a bigger punch on the economy than a rise from higher levels. Worded differently, going from 2% to 3% in rates is a bigger deal than going from 8% to 9%. Anyone who has recently dealt with a mortgage should easily understand this math. I've had this chart for a long time. I think I first used it at Bear Stearns back in the day. Anyway, here is the update. Now ponder how some of these historical economic events occurred from a smaller change in rates (log or not). Not all are due to a prior rise in rates (COVID-19), but I think the chart makes the point on risks ahead regardless. We shall see I suppose. Happy Wednesday. FT
ZH: Crude Crashes To 4 Month Lows: Here's Why...
ZH: Bullion & Black Gold Breakdown As Loosening Financial Conditions Foil Fed's Plan (closing babble BUT conclusion seemed important at least to me)
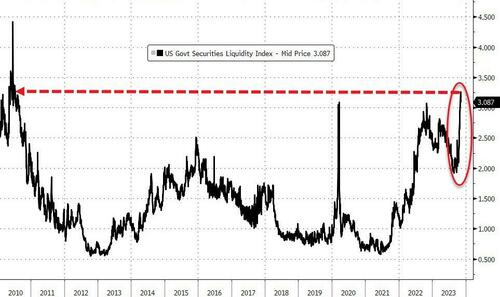
… Finally, liquidity in the crucially-important US Treasury market remains very poor - at its worst since 2010...
Source: Bloomberg
The last time liquidity was this bad - in March 2020 - The Fed unleashed its largest money-drop ever.
And in light of that liquidity crisis, is it any wonder that Warren Buffett is holding his drypowder.
Since the pandemic first struck, the conglomerate’s holdings of cash have declined, but its holdings of T-bills have soared past $126 billion to a record. Wondering why he is not snapping up those 'cheap' stocks you keep hearing about on TV?
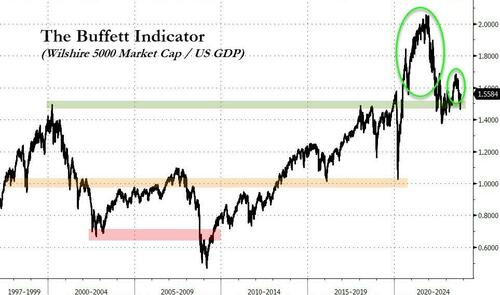
Simple - according to his favorite indicator, stocks are only back to the same level of 'expensive' as they were at the peak of the dotcom bubble...
Source: Bloomberg
As Buffett once remarked, “Our stay-put behavior reflects our view that the stock market serves as a relocation center at which money is moved from the active to the patient.”
AND …
Investing.com - Global Stocks Rally On Bets Powell Is Done Raising Rates!
… THAT is all for now. Off to the day job…











Great write up & thoroughness. Thank you.
Like that Goldilocks report !!!!
WFC...225 bps cuts seems excessive ???
Some China Deflation, not all bad....
Great article !!!!