(USTs mixed, flatter on what appears to be average volumes)while WE slept; "...US 2y is the cleanest trade..." (UBS); '...bond rally is just gettin' started' (HIMCO) AND more...
Good morning … Ahead of this afternoons liquidity event … (aka 10yr auction) …
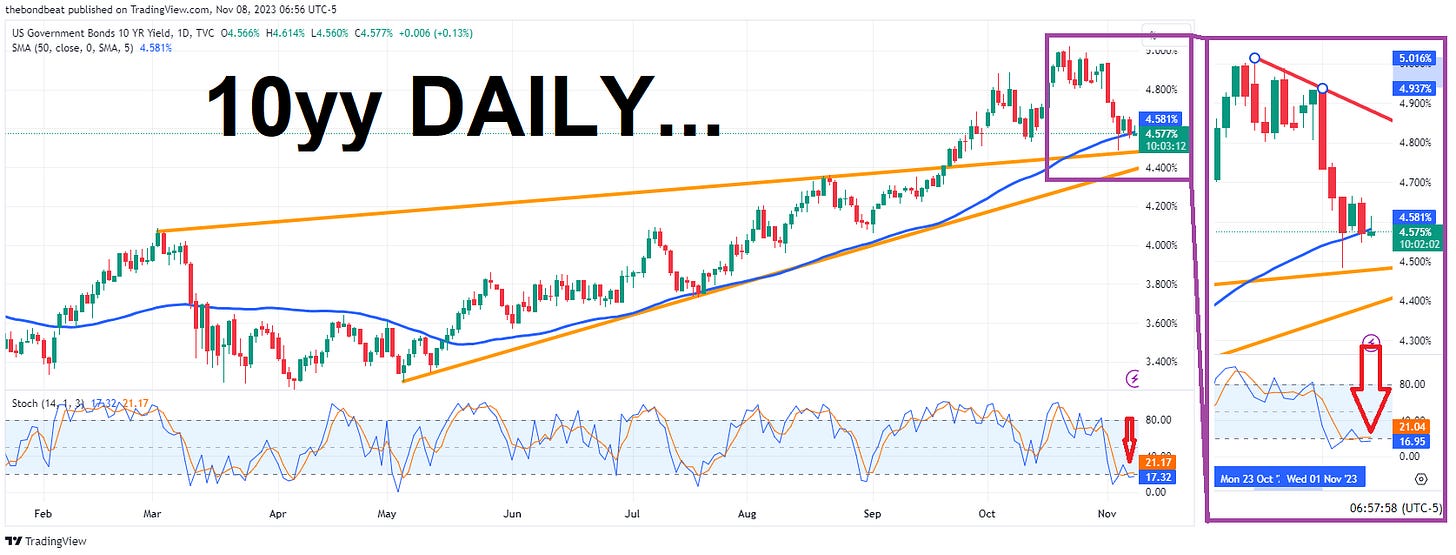
… where MY eyes are drawn to the 50dMA (4.58) along with most of the free world AND momentum (stochastics, bottom panel) which remain overBOUGHT. I’d note a couple TLINES for some outlier levels of resistance (4.50% then 4.40%) and support (4.85%) and I do so without any reason other than Fedspeak as a motivation towards one extreme or another …
I will say the longer 10s flirt with 50dMA the more important the level (4.57%) becomes and for no special reason … and some used to say there were times like these when the price action WAS the news …
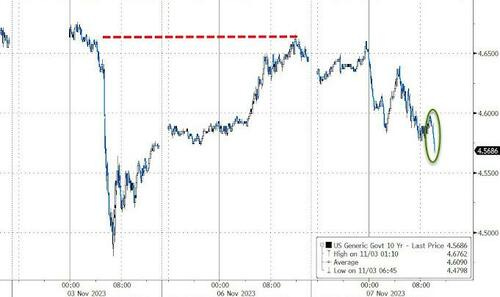
ZH: Stellar 3Y Auction Sends Rates To Session Lows
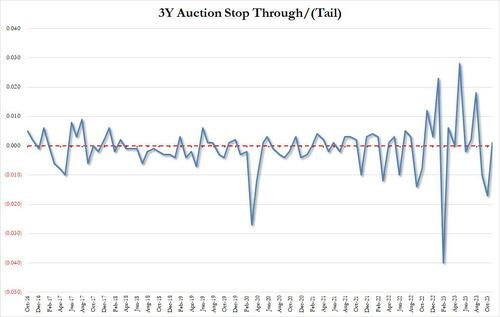
…Here are the details: the high yield of 4.701% was not only below last month's near-record stop of 4.723%, it also stopped through the 4.702% When Issued by the smallest of increments, of 0.1bps. This was the first stop following two tails of which last month's 1.7bps was especially harrowing and was the third highest in the past decade.
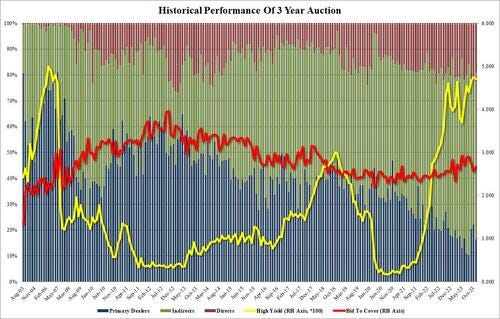
The bid to cover was nothing special: at 2.668 it was above last month's 2.562 but excluding that, it was the lowest since April and well below the six-auction average of 2.787.
The internals were far better, with Indirects spiking from last month's 56.0% to 64.6%, the highest since August, and in line with the recent average of 65.319.
Overall, this was a very impressive auction, and certainly stellar compared to last month's dismal 3Y offering. No surprise that moments after the results, yields across the curve and especially at the 10Y tenor slid to session lows just below 4.57% as the rollercoaster in TSY yields continues.
And so, ahead of today’s 10yr auction - first crack at duration AFTER QRA last week,
… US Treasury 10y Auction In Focus Wednesday -- The first US Treasury auction of the week was well received, providing some relief over Treasury demand concerns. The Treasury's three-year note auction drew a yield of 4.701% on Tuesday, pretty much matching the pre-sale when-issued yield. Demand information was better than the October auction. Moving through duration this week, concerns over term premium could become more transparent. If investor supply concerns have cooled, expect lower tails and higher bid-to-cover ratios in the 10y and 30y auctions. The Treasury is due to auction a UST 10y for $40 bn on Wednesday at 18:00 London, and a UST 30y for $24 bn on Thursday at 18:00 London
-UBS
… here is a snapshot OF USTs as of 705a:
… HERE is what this shop says be behind the price action overnight…
… WHILE YOU SLEPT
Treasuries are mixed with the curve pivoting flatter around a little-changed 10-year sector this morning- following the UK and German curves in doing the same. DXY is higher (+0.2%) while front WTI futures are lower (-0.8%, see attachments). Asian stocks were mixed/lower, EU and Uk share markets are little changed while ES futures are UNCHD here at 7am. Our overnight US rates flows saw yields meandering during Asian hours until the London crossover when prices dropped sharply amid multiple block sales in UXY futures. The Tokyo desk saw better selling in 10's out to 30's from real$. In swaps, the desk still senses a strong risk parity vibe to the price action with 'buy stocks and bonds' a theme of late. Overnight Treasury volume was unavailable due to technical issues but TY futures volume was ~104% of average as of 7am.
… and for some MORE of the news you can use » The Morning Hark - 8 Nov 2023 and IGMs Press Picks (who CONTINUES to be sportin’ that new, fresh look) in effort to to help weed thru the noise (some of which can be found over here at Finviz).
Moving from some of the news to some of THE VIEWS you might be able to use… here’s SOME of what Global Wall St is sayin’ …
Argus - Stock Valuations Move Back Toward Normal (normal is GOOD’er than bonds or just normal? you decide …)
Our bond/stock asset-allocation model is indicating that bonds are the asset class offering the most value at the current market juncture, as interest rates have risen. But stocks are not seriously overvalued, and the recent decline in the benchmark 10-year government bond yield has improved equity valuations. Our model takes into account levels and forecasts of short-term and long-term government and corporate fixed-income yields, inflation, stock prices, GDP, and corporate earnings, among other factors. The output is expressed in terms of standard deviations to the mean, or sigma. The mean reading from the model, going back to 1960, is a modest premium for stocks, of 0.15 sigma, with a standard deviation of 1.0. The current valuation is a 0.76 sigma premium for stocks, inside the normal range and down from 0.98 last month. Other valuation measures also show reasonable multiples for stocks. The current forward P/E ratio for the S&P 500 is 16.7, within the normal range of 10-21 and down from 22 a year ago. The current S&P 500 dividend yield of 1.5%, while below the historical average of 2.9%, is up from an ultralow 1.2% as recently as 2021. We expect the results from our valuation model to improve, as interest rates start to decline next year and EPS growth picks up. Based on the current valuation levels, as well as interest rate and earnings forecasts, we have called for a recovery in stock prices in 2023 from bear-market lows. Our current recommended asset-allocation model for moderate accounts is 67% growth assets, including 65% equities and 2% alternatives; and 33% fixed income, with a focus on core opportunistic segments of the bond market. On duration, we recommend focusing on the short end of the curve.
BAML - The Longest Pictures (as a visual learner this one helps with tremendous context and will have to keep digging through this one for more BUT p1 notes … banks … and as far as WWW, “A very long-term chart of U.S. stock prices usually going up” Sam Ro TKer)
… The secular contrarian
25/25/25/25 cash/commodities/bonds/stocks likely to outperform 60/40, real assets to outperform financial assets, Main St to outperform Wall St; bonds have completed first leg of secular bull; we buy secular contrarian plays in gold, small cap, value stocks, global banks (Chart 1), emerging markets, distressed tech, in anticipation of recession and elections sparking inflationary policy moves in ’24.… Since interest rates peaked in the early 1980s, the performance of banks has been hit by periodic debt crises (Latin America in the ‘80s, Asia/Russia in the late-90s, and the Global Financial Crisis of ’07-’09).
The underperformance of banks in the past 10 years has been driven by historically low interest rates, poor balance sheets and government regulations hampering bank profitability….
… Bond & dividend yield spread: US
• Equities are historically more attractive when equity dividend yields exceed Treasury bond yields.
• Before WW2, S&P 500 dividend yields were in excess of the 10-year Treasury yield, with an average premium of 136bps.
• In the post war period, 10-year Treasuries on average yielded 199bps more than equity dividends, though the spread has narrowed in recent years.
• The widest spread of Treasuries over dividend yields was 1,023bps in 1981.
• In 2020, equity dividend yields rose to a premium of 167bp over Treasury yields, the widest since 1954.
• The current spread between Treasury yields and equity dividend yields is 257bps, the widest spread of Treasury bond yields over equity dividend yields since 2007…
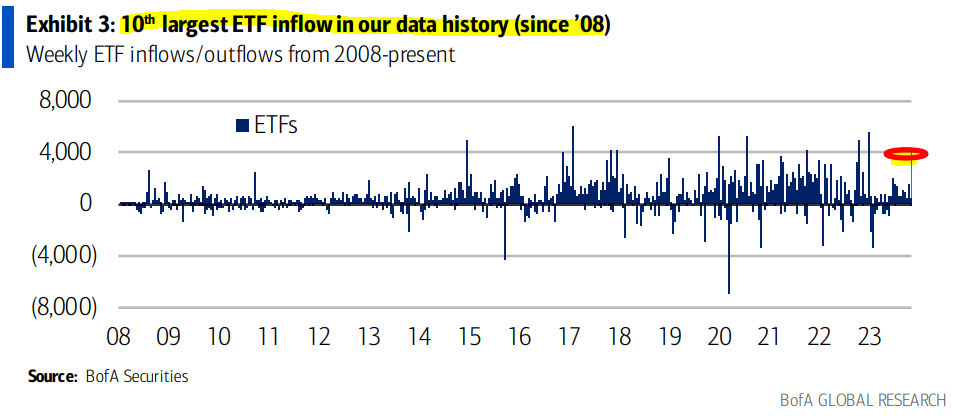
BAML - Equity ETF inflows in last week’s rally
… ETFs: largest inflows since Dec.; all styles saw inflows
ETF inflows in all styles and Large/Small cap/Broad Market: Clients bought Blend/Growth/Value ETFs and Large/Small cap and Broad Market ETFs. Value saw inflows for a 19th consecutive week. Clients sold Mid cap ETFs.Most sector ETFs saw inflows, led by Tech ETFs; Energy ETFs led outflows.
BNP - Early Warning Signals: November 2023
… Increased credit risk played a role in six of seven downgrades, with the CDS signal now being on for ten currencies, up from four since the last update. Local market conditions also worsened, with the RSI signal now on for twelve currencies, up from eight since the last update. In contrast, economic conditions slightly improved and the ECO signal is now on for thirteen currencies, down from fifteen since the last update.
DB - Early Morning Reid
… Overall, the Fed commentary did little to derail the rates rally. Treasuries rallied across the curve, and the 10yr yield fell -7.6bps to 4.57%, with the 2yr yield down -1.7bps to 4.92%. The bond rally got some support from an auction of 3yr notes, which saw solid investor demand with the primary dealer takedown (16.3%) slightly below its 1-year average (17.0%). Today we have a 10yr auction which is the first big "proper duration" bond auction since last week's QRA. This morning in Asia, 10yr USTs (+1.3 bps) have edged back higher again…
DB - Bank lending and financial conditions: reprise
We previously noted the yawning gap between bank lending standards and market-based financial conditions, and questioned whether it might attenuate the transmission of tighter lending standards to output growth this cycle.
With the tightening in market-based financial conditions over recent months and moderation in the degree of bank tightening seen in yesterday's SLOOS, that gap has narrowed significantly, as shown in today’s chart.
Where does it leave things? Even with the moderation in the latest SLOOS, banks are on net tightening standards, and for over a year that tightening has been at levels historically only seen around recession. Banks' willingness to make consumer loans – available over a much longer history – is similarly at recession levels…
…All told, the SLOOS data are consistent with DB's forecast for a mild recession next year, but the signal, as with so many others this cycle, is cloudier than usual.
Goldilocks - Trade Deficit Larger Than Expected in September; Lowering Q4 GDP Tracking to +1.6%
BOTTOM LINE: The trade deficit widened more than expected in September from an upwardly-revised level. We lowered our Q4 GDP tracking estimate by one tenth to +1.6% (qoq ar) but left our Q4 domestic final sales growth forecast unchanged at +1.7%.
TD - Who Skipped Last Month's US Auctions? (while I didn’t catch this one until AFTER hitting send ahead of the 3yr auction, perhaps that saying — better late than never — making this one worth considering BEFORE getting those bids in early / often (or not at all?)
Last month's 3y, 10y, and 30y auction series all saw tails, which we flagged was a rare occurrence, happening in just 11% of auction series since 2012. The 3.7bp tail at the 30y auction was especially worrying — the fifth largest tail for a 30y auction since 2011.
The post-auction data showed a decline in end-user demand, with dealers getting their largest allocation since Oct 2022 (Fig 1). Treasury's allotment data shows that the Oct 10y and 30y auctions saw 4.6pp and 4.2pp declines, respectively, in allocations to foreign investors (Fig 2, 3). This sharp decline in foreign demand at auction likely contributed to auction weakness as foreign investors stepped away.
Given the market's positive reaction to last week's November Treasury refunding announcement which delivered a modest slowing in the pace of long-end auction size increases, this week's long-end auctions will be key to watch.
The market's failure to break through the psychological 5% level and a decline in vol could draw foreign investors back into auctions, helping markets stabilize further (Fig 4). However, investors may remain cautious as duration supply will continue rising in FY2024 and the outlook for Treasury demand remains murky (Fig 5). We remain long 10y rates, but markets will look to Fed speak, supply, and technicals for direction this week as we await more data (Fig 6).
UBS - Global Economics & Markets Outlook 2024-2025 (is it that time already? yep yep it is … Global Wall St getting out their year ahead dart boards and warming up … HERE is 349pg full note with just one excerpt and here as with BAML picture book above, will take TIME to go thru … )
… Fixed Income: US 2y the key trade. Long UK, KR, BZ, NZ. HY OAS peak ~600bps.
DM real rates last traded at these levels in 2005-07 & 2010, when global growth was twice as strong as it's likely to be in ‘24. The market expects a Fed cutting cycle less than a third of a typical one, but we see a regular one panning out. US 2y is the cleanest trade. Term premia should pick up but only through bull steepening. Both for external (China) and domestic reasons, rates should come well lower also in UK, KR, BZ and NZ. JP, EU and CH lag. Total returns in IG should be strong. HY total returns will likely be negative in H1 ’24, but, spreads should peak at lower levels than in prior recessions …… Long US Steepeners
The biggest driver of the slope of the curve is always Fed policy, as short rates react more to policy changes than long rates due to an assumed reversion to a long run neutral rate. Aggressive easing in 2024 should mean dramatic steepening.Even without any actual Fed easing, we think the front of the curve is far too cheap. The OIS curve suggests FF will remain above 4% permanently, far above any possible increase in r*. While some of that is term premium, it is difficult to have a huge term premium in relatively short maturities. Supply is a far bigger factor out the curve than in shorter maturities, in part because there are fewer very long duration non-Treasuries out the curve, while there are many structured products, supras, agencies, etc, at the front of the curve. The big pile of other bonds limits the impact of Treasury supply changes.
Even if we are wrong and the Fed easing is less aggressive, 2yr rates seem much too cheap. We like outright longs in 2s now, but would shift to steepeners as the year progresses. This is because the curve may have an extra kicker from heavy Treasury supply.
Out the curve, we think the supply story is overdone, but there is still risk as the Treasury market has not seen any meaningful supply shock yet. Auction sizes were significantly bigger in 2021 (20s were 79% bigger) than they are now. Even adjusting for QE in 2021, the flow of dollar duration to the private sector was higher in 2021 than it is today. The Treasury refunding announcement suggests the supply surge won't hit until 2025. If auction sizes stop rising in May, the flow of 10yr equivalents will only be 6% above 2021's pace in 2024. But in 2025, supply will rise.
Wells Fargo - Larger Trade Gap Shows Downside of Robust Domestic Demand
Summary
The September trade report makes sense of the initial GDP estimate which revealed a drag from trade in Q3 when most anticipated a slight boost amid a trend narrowing in the trade gap. Exports grew in September, but imports grew even faster amid resilient domestic demand…… Exports were strong across the board. The monthly gain was enough to pull the year-over-year change above zero for the first time in five months (chart). While exports ended the summer on strong note, the recent strengthening of the U.S. dollar makes U.S. goods more expensive to foreigners which we expect could restrain export growth in the coming months.
At the same time, higher financing costs will eventually catch up to even the intrepid U.S. consumer. The business activity component of the ISM services index shed 4.7 points to come in at a five-month low of 54.1. Slowing domestic demand should lead imports lower, which in turn will lead net exports to be a mostly neutral factor on headline growth in the coming quarters.
… And from Global Wall Street inbox TO the WWW,
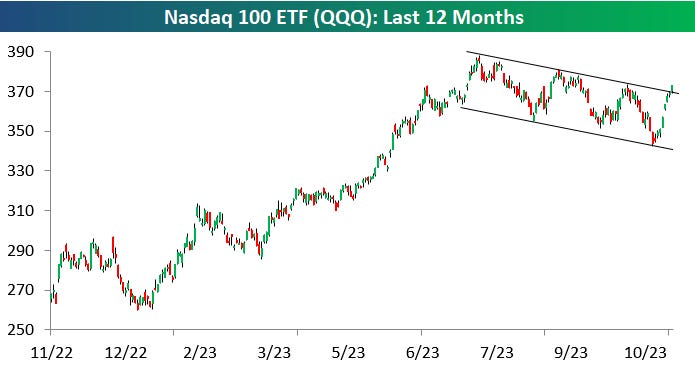
Bespoke - Nasdaq 100 Goes for Eight in a Row (challenge accepted? anyone?)
8 and Counting
If you're a chart watcher, you have to be following the move in the Nasdaq 100 (QQQ) today as it breaks above the top of the downtrend channel that had formed over the last few months.
The Nasdaq 100 ETF (QQQ) is currently set to close higher for the 8th day in a row. This would be the 21st eight-day winning streak in the history of QQQ, which we highlight in the table below. As shown, the ETF has actually extended the winning streak to nine 60% of the time, including the last four times it has happened dating back to mid-2017.
Bloomberg - Hoisington’s Hunt Says the Bond Rally Is Just Getting Started
Wasatch-Hoisington U.S. Treasury Fund is down over 12% in 2023
Firm remains resolute in its wager on long-term US Treasuries
Hoisington Investment Management Co. was pummeled by its bullish stance on US bonds in recent years, driving its Treasury fund to some of the industry’s biggest losses as the Federal Reserve’s rate hikes sent prices tumbling.
But long-time chief economist Lacy Hunt sees the recent retreat in Treasury yields as the start of a rally that will gain steam once the US economy careens into a hard landing.
Long-term Treasury yields have slid sharply since late October on speculation that the Fed has completed its most aggressive tightening cycle in decades and the wave of new debt supply is abating. The benchmark 10-year yield has been hovering around 4.6% — well below the 16-year high of 5.02% reached on Oct. 23. That’s raised hopes that Treasuries might even eke out a small positive return in 2023 after two straight years of losses.
The Wasatch-Hoisington U.S. Treasury Fund is down about 12.7% this year and tumbled 34% in 2022, data compiled by Bloomberg show. That’s put it dead last among the funds tracked by Bloomberg in each of the past three years.
Despite that rough run, Hunt sees a fiscal and monetary backdrop that bodes well for bonds, anticipating that rates will move lower into next year and beyond.
For the bond market, “the cloud is breaking because the economy is heading into a hard landing,” Hunt said in an interview with Manus Cranny on Bloomberg Television. “But it’s a process that will take time. The US economy has very serious difficulties” that will “be with us for a long time in the future.”
Those expecting a bond recovery gained support last week, when the US central bank left its benchmark rate unchanged and signaled in a post-meeting statement that the overall rise in longer-term Treasury yields had reduced the impetus to hike again.
The curve has already gone through a major steepening move after long bond yields drew closer to those on short-term debt, though it remains inverted. Ten-year Treasury yields are about 35 basis points below those on two-year debt, though that gap exceeded 100 basis points as recently as July.
Hoisington was founded in 1980 by Van Hoisington, with Hunt helping guide investments since 1996. Hunt began his career in 1969 as an economist at the Dallas Fed.
While the runaway inflation that followed the pandemic and the massive fiscal and monetary policy stimulus it brought has been fixed, the large US national debt will weigh down growth for years to come, Hunt said. Over indebtedness is a problem, as well as other forces, like an aging population, that plagued the US before the pandemic and have only gotten worse since, he added.
“The problem for the US and the rest of the world is that there’s going to be very poor growth, very erratic growth,” he said. “But the inflationary problem in my view for all practical purposes has already been solved.”
While Hunt wouldn’t give a specific level for how low he expects yields to fall, he pointed to the firm’s 18-year duration as a sign of their conviction in the positive outlook for Treasuries. Duration is a measure of a bond portfolio’s sensitivity to changes in yield, and a longer position reflects a more bullish view.
“The 18 year duration speaks for itself,” he said. “When economic conditions weaken investors will see there is great advantage to holding the long duration Treasuries.”
Bloomberg - SEC’s Gensler Sounds Fresh Alarm on Leverage in Treasuries Market
SEC chair speaks Tuesday on market reforms at industry event
Industry heavy weights say basis trading provides liquidity
… Regulators are particularly concerned about one strategy called the basis trade, which involves using leverage to profit from the price gap between Treasury futures and the underlying cash market. It has garnered particular attention from federal watchdogs over concerns about a lack of visibility into the amount of risk in the market.
Executives at Citigroup Inc. and CME Group Inc., among other firms, have voiced support for the popular trade, which they say provides needed liquidity for government bonds.
The basis trade is also under increasing scrutiny internationally from the Bank of England and the Bank of International Settlements. Regulators have warned that sudden volatility in such a highly-leveraged market could reverberate across markets and lead to systemic instability.
Bloomberg - Citi, CME Defend Treasuries Trade That’s Worrying Regulators
Basis trade is vital for Treasury market functioning, they say
Strategy has attracted scrutiny since blow up in 2020
Citigroup Inc. and CME Group executives are standing up for a Treasury trade popular with hedge funds that’s been criticized by regulators for posing risks to financial stability.
The proponents say the so-called basis trade, which seeks to benefit from small pricing mismatches between US Treasury futures and underlying bonds, is valuable as it helps provide liquidity to off-the-run bonds that are unpopular with many investors.
The strategy has recently faced scrutiny from institutions including the Federal Reserve, the Bank of England and the Bank of International Settlements, which say it can leave investors exposed to sudden market moves since it typically involves borrowing large sums of money. The strategy has enjoyed a resurgence this year, with short positions mounting in the futures market, a key part of the basis trade…
Bloomberg - Why My Recession Rule Could Go Wrong This Time (SAHM on the SAHM rule … )
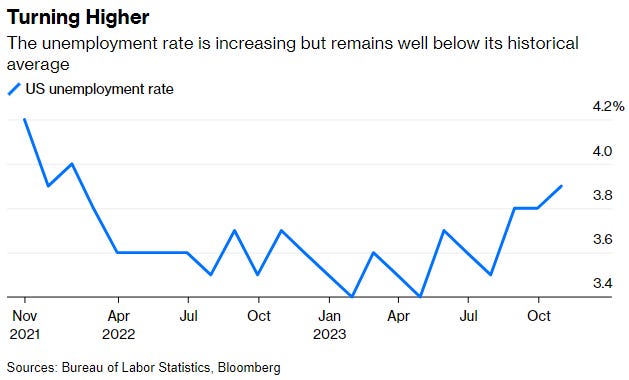
The highly accurate Sahm rule uses the unemployment rate to detect the start of an economic downturn. But like many indicators during the pandemic era, it’s possible it could “break.”
… The Sahm rule is simple. If the three-month average of the unemployment rate (the monthly rate often bounces around too much) is half a percentage point or more above its low in the prior 12 months, the economy is in a recession. The current value is 0.33 percentage point, so it’s highly unlikely that we are in a recession - at least for now.
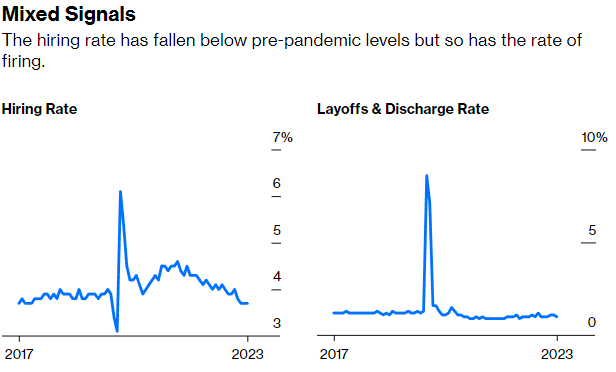
Even so, the unemployment rate has risen, threatening to trigger a negative feedback loop of further unemployment that leads to a recession. When workers lose paychecks, they cut back on spending, and as businesses lose customers, they need fewer workers, and so on. Currently, the signals are mixed: the hiring rate has fallen below pre-pandemic levels, while the firing rate remains low. And growth in consumer spending, even after accounting for inflation, has been strong this year.
… With the federal funds rate over 5%, the Federal Reserve has ample room to ease monetary policy, as it would in a recession. But it’s part of the orthodoxy that cutting rates at the first signs of a recession in the 1970s when high inflation was a mistake and actually fueled inflation. It’s unclear whether today’s Fed, hyper-focused on taming inflation, would do anything to soften the blow of a recession.
The question is not whether we can call a recession if it were to come; it’s what policymakers do next that will determine how much hardship it causes.
CNBC - Credit card balances spiked in the third quarter to a $1.08 trillion record. Here’s how we got here
Collectively, Americans now owe $1.08 trillion on their credit cards, according to a report from the Federal Reserve Bank of New York.
Steadily, persistently higher prices have caused consumers to spend down their savings and increasingly turn to credit cards to make ends meet.
At the same time, credit cards are one of the most expensive ways to borrow money.
LPL - Higher Yield Cushions Can Offset Still Higher Rates
…Currently, the highest hurdle rates reside in the short-to-intermediate categories but have improved in most sectors. For example, in order for the short Treasury category (1-5 year Treasury securities) to generate a loss over the next 12 months, interest rates would need to increase by more than 2.56% from current levels. Similarly, given the increase in yields for the intermediate corporate credit category, interest rates would need to increase by 1.5% from current levels to offset current levels of income. However, while hurdle rates are the highest for shorter maturity sectors, the increase in yield cushion for (most) longer maturity sectors has improved as well. Taking on some duration risk makes more sense now than it did a few years ago. That said, it would only take a 0.33% increase in yields to offset current levels of income for the long Treasury category—something that is within a likely distribution of outcomes. And while we can’t rule out the possibility of still higher rates at this point, we think it would take a steep resurgence in inflationary pressures to get to the levels needed to generate further losses on most fixed income asset classes.
The move higher in yields recently has been unrelenting but we think we’re closer to the end of this sell-off than the beginning. Over the past decade, interest rates were at very low levels by historical standards. Now, the recent sell-off has taken us back to longer term averages. That is, at current levels, yields are back to within normal ranges. And while the transition out of the low interest rate environment to this more normal range has been a challenging one for fixed income investors, we think, given higher starting yield levels, the chances of further negative returns over the next year have declined.
RIA - Tuesday Takes: Bond Bear Market. Is It Dead, Or Just Hibernating?
Is the bond bear market finally over? That is the question everyone is asking now that bond prices rallied sharply following the November FOMC policy meeting. As noted in the #BullBearReport this past weekend:
“On Wednesday, Jerome Powell’s speech sparked a broad rally in stocks and bonds as market expectations for further rate hikes collapsed. There was nothing new about the Fed’s recent policy announcement as they maintained that higher Treasury yields are doing their work in slowing economic activity and, ultimately, inflation. However, they did, again, as expected, leave open the possibility of further rate hikes as needed.”
POWELL: PROCESS OF GETTING INF. TO 2% HAS A LONG WAY TO GO
*POWELL: FULL EFFECTS OF TIGHTENING YET TO BE FELT
*POWELL: NOT CONFIDENT WE’VE REACHED STANCE FOR 2% INFLATION
“Given that the Fed did little to talk up the projections of further rate hikes, the market took this as meaning the Fed is likely done hiking rates. Of course, that means, from the market’s perspective, the subsequent actions will be ‘rate cuts.'”
With the more “dovish” tone of the Fed’s commentary, combined with a much weaker-than-expected employment report last Friday, expectations for higher yields collapsed, sending bond prices higher. As shown, on a short-term basis, bond prices rallied sharply to the “neckline” of a potential “head and shoulders” low. That technical pattern, which is bullish for bond prices if it completes, is supported by a positive divergence in both the MACD “buy signal” and the Relative Strength Index (RSI).
… However, despite evidence that financial conditions are tightening, they are not shrinking drastically. As shown, liquidity has remained primarily neutral over the last year. Last week’s surge in stocks and bonds is reflected in a recent uptick in liquidity.
The problem for the Fed is that increased liquidity, higher asset prices, and lower yields remove the pressure from consumers. If consumer confidence improves, then so does consumption. That increased demand then fosters higher prices, which is not what the Fed wants, at least not yet.
The Fed’s challenge is potentially a trap of their own making. On the one hand, they want falling asset prices and weaker economic data to quell inflation. However, the Fed does NOT want an economic event destabilizing the financial system. Unfortunately, the Fed may soon face a very tough decision. Either allow a deeper recession to take hold, quelling inflation, or cut rates to keep a banking crisis from spreading.
We will likely know the answer sooner than later.
However, I believe that Treasury bonds will be the asset class of choice.
WolfST - Mortgage & HELOC Balances, Delinquencies, Foreclosures: How Are our Drunken Sailors Holding Up?
Mortgage balances outstanding ticked up 1.0% in Q3 from Q2, to a new record of $12.1 trillion, after having dipped in Q2, according to data from the New York Fed’s Household Debt and Credit Report. This increase is less than half the pace than the big jumps during the era of the 3% mortgages, when mortgage balances had soared quarter-to-quarter by as much as 2.8% in Q2 2021…
… Note the impact of the pandemic-era funds that consumers got (stimulus payments, PPP loans, etc.) that caused disposable income to spike, and therefore the burden ratio to fall. And note the impact in recent quarters of the biggest pay increases in 40 years, even as mortgage debt barely increased.
Transitioning into delinquency: 30+ days. Mortgage balances that were newly delinquent by 30 days or more at the end of the quarter ticked up to 2.8% of total balances, which is still lower than anytime before the pandemic and down from the 3.5% range during the Good Times in 2017-2019 (red line in the chart below).
ZH: Credit Card Debt Grinds To A Halt As Average APR Hits New Record High
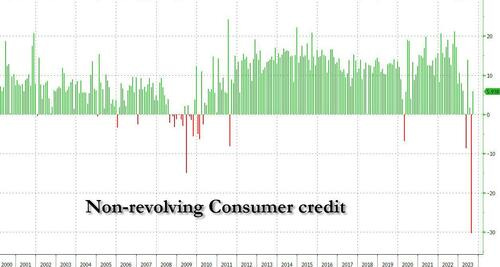
… As for non-revolving credit, or student and auto loans, here too things have gotten bogged down, and after last month's record ($30BN) contraction driven by student-loan forgiveness, in September just $5.9 billion in total loans were issued, also one of the lowest monthly increases since covid.
Before hitting SEND and with all this review and recap / victory lap out there on consumer credit and CREDIT CARD DEBT, I thought an ‘official’ link worth noting.
FRBNY Liberty St Economics - Credit Card Delinquencies Continue to Rise—Who Is Missing Payments?
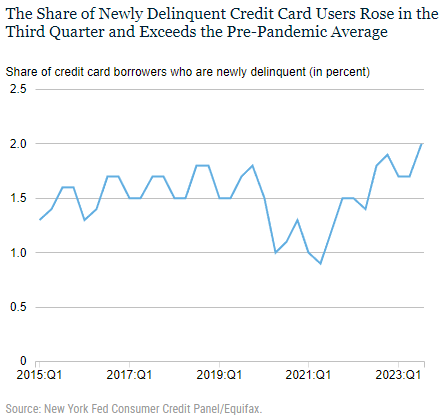
This morning, the New York Fed’s Center for Microeconomic Data released the 2023:Q3 Quarterly Report on Household Debt and Credit. After only moderate growth in the second quarter, total household debt balances grew $228 billion in the third quarter across all types, especially credit cards and student loans. Credit card balances grew $48 billion this quarter and marked the eighth quarter of consecutive year-over year increases. The $154 billion nominal year-over-year increase in credit card balances marks the largest such increase since the beginning of our time series in 1999. The increase in balances is consistent with strong nominal spending and real GDP growth over the same time frame. But credit card delinquencies continue to rise from their historical lows seen during the pandemic and have now surpassed pre-pandemic levels. In this post, we focus on which groups have fallen behind on debt payments and discuss whether rising delinquencies are narrowly concentrated or broad based.
…Conclusion
Delinquency rates on most credit product types have been rising from historic lows since the middle of 2021. The transition rate into delinquency remains below the pre-pandemic level for mortgages, which comprise the largest share of household debt, but auto loan and credit card delinquencies have surpassed pre-pandemic levels and continue to rise. While the growth in auto loan delinquency has appeared to moderate over recent quarters, credit card delinquency rates have risen at a sharper pace. Even though the increase in delinquency appears to be broad based across income groups and regions, it is disproportionately driven by Millennials, those with auto or student loans, and those with relatively higher credit card balances. The labor market and the general economy have remained resilient throughout this period which makes pinning down the causes of rising delinquencies rates more difficult. Whether this is a consequence of shifts in lending, overextension, or deeper economic distress associated with higher borrowing costs and price pressures is an important topic for further research. We will continue to monitor conditions for household balance sheets for further signs of distress.
… THAT is all for now. Off to the day job…












Burning Question: who's the worst NYC pro QB, Jones or Wilson? Considering the hype & expectations I vote Wilson. In the words of Colin Cowherd, "for Wilson, an early 7-0 deficit appears insurmountable".
Yeah, exactly WTF is 'normal' in this Relm of Madness within which it is we reside? If only 'Neo' or the 'Daywalker' would hurry up and save us already LOL! Of course I do jest....save yourselves, and those that you LOVE