Good morning / afternoon / evening - please choose whichever one which best describes when ever it may be that YOU are stumbling across this weekends note…
… momentum rolling over and so, i’d say bonds look OK especially as they are just north of the middle of the aforementioned range …
… AND some of what’s making up this price action …
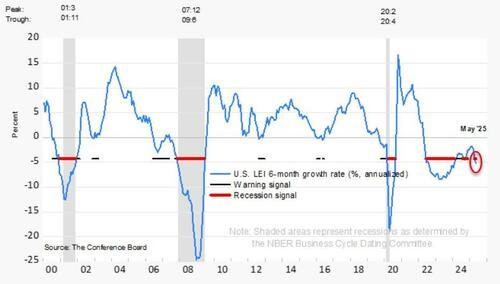
ZH: Dollar's Best Week In 4 Months, Bonds Bid As LEIs Trigger 'Recession' Signal; Uncertainty Drops
… Made worse today by LEI's ongoing downturn
“The LEI for the US fell again in May, but only marginally,” said Justyna Zabinska-La Monica, Senior Manager, Business Cycle Indicators, at The Conference Board.
“The recovery of stock prices after the April drop was the main positive contributor to the Index. However, consumers’ pessimism, persistently weak new orders in manufacturing, a second consecutive month of rising initial claims for unemployment insurance, and a decline in housing permits weighed on the Index, leading to May’s overall decline. With the substantial negatively revised drop in April and the further downtick in May, the six-month growth rate of the Index has become more negative, triggering the recession signal..."
… wait, what? LEIs send recession signals? This new in the past 3yrs? When I was dealing with institutional portfolio managers and trading desks, well, I don’t EVER recall anyone trading an LEI recessions signal so, forgive me, but …
It’s NOT to say I don’t get the joke … again, having listened / watched Ms DiMartino Booth not too long ago AND noting video a few weeks back (HERE), well, there’s somethin’ happenin’ here and what it is ain’t exactly clear …
That said, Friday 2.0 really wasn’t a day. MOST of Global Wall vacated on Wednesday for the long weekend and I guess it goes to show that the “B” Team was really in charge as these guys …
… had already hit the ‘Hamptons Hedge’ button Wednesday after the FOMC.
… Alrighty, then.
This ‘recession signal’, nevertheless, did not capture the hearts and minds as much as Waller …
ZH: Waller Puts In Bid For Next Fed Chair, Says Powell Should Cut "As Early As July"
… “I think we’ve got room to bring it down, and then we can kind of see what happens with inflation,” he said, adding the central bank could pause cuts if needed. And of course, let's not forget that the Fed did cut 50bps two months before the election, when inflation was not only much higher than it is today, but when the US economy was just as weak as it is now.
… Ok then … back to Waller JPOW & Co and how it was that most of Global Wall wasn’t looking on Friday and so, the proverbial question — if a monetary policy report to Congress falls, when nobody is there to read it, does it make a sound?
Inflation has continued to moderate this year, though it remains somewhat elevated. The labor market is in solid shape, with a moderate pace of job gains so far this year and the unemployment rate at a low level. Although growth in real gross domestic product (GDP) is reported to have paused in the first quarter, growth in private domestic final demand was moderate, reflecting a modest increase in consumer spending and a jump in capital spending. However, measures of household and business sentiment have declined this year amid concerns about the effects of higher tariffs on inflation and employment as well as heightened uncertainty about the economic outlook.
With the labor market at or near maximum employment and inflation continuing to moderate, the Federal Open Market Committee (FOMC) has maintained the target range for the federal funds rate at 4¼ to 4½ percent. The FOMC’s current stance of monetary policy leaves it well positioned to wait for more clarity on the outlook for inflation and economic activity and to respond in a timely way to potential economic developments. The Federal Reserve has also continued to reduce its holdings of Treasury and agency mortgage-backed securities and, beginning in April, further slowed the pace of decline to facilitate a smooth transition to ample reserve balances. The FOMC is strongly committed to supporting maximum employment and returning inflation to its 2 percent objective. In considering the extent and timing of additional adjustments to the target range for the federal funds rate, the Committee will carefully assess incoming data, the evolving outlook, and the balance of risks…
The June 2025 Monetary Policy Report signals that the Fed expects to cut interest rates twice before the end of 2025, citing easing inflation, slower economic growth, and moderating labor market strength. While inflation remains slightly above target, recent data suggest it's trending lower, allowing room for potential policy easing. The Fed acknowledges uncertainty from new trade tariffs, but some officials—especially Governor Waller—believe their inflationary impact may be temporary. Economic risks are balanced, but the Fed emphasizes a data-dependent approach before making any moves. Overall, the tone is cautiously dovish, with a bias toward easing if inflation continues to cool.
I’ll move on TO some of Global Walls WEEKLY narratives — SOME of THE VIEWS you might be able to use. A few things which stood out to ME this weekend from the inbox
Summer time, and the livin’ is easy … except for the economy?
Geopolitical tensions are still high, as the Israel-Iran conflict de-escalates but is far from resolved, and next week's NATO summit could lay bare US-EU tensions just ahead of the 9 July tariff deadline. Central banks remain cautious, but internal views are diverging as data signal slowing growth.
… US Outlook The best lack all conviction The FOMC remained in a holding pattern this week, with Chair Powell downplaying updated dots showing two cuts this year. As we and the Fed await greater clarity about how tariffs will affect prices and activity, available May estimates point to subdued growth and soft inflation.
The US remains positioned for a second-consecutive quarter of below-trend growth. This week's incoming May estimates showed a large overall decline in retail sales, lackluster industrial production, and weak housing starts. We retain our view that the growth trajectory will remain soft through year-end, reflecting tariffs and an intensifying drag from slower immigration.
We expect next week's estimates to confirm a flattening of personal income in May and an outright decline in consumer spending, with the latter reflecting payback from earlier front-running. With cost-push pressures from tariffs still taking shape, we think core PCE price inflation will increase 0.16% m/m (3.6% y/y), a third-consecutive soft print.
As expected, the FOMC held rates steady in June, with Chair Powell communicating no urgency to cut rates amid uncertainty about how tariffs will affect inflation and unemployment. Updated projections show a divide between two camps, one penciling in two cuts in 2025, the other no cuts. Neither holds its view with strong conviction, placing the emphasis on the evolution of data.
… Waller is not representative of the committee During a CNBC interview at the close of the week, Governor Waller surprised markets by noting that he could see the FOMC cutting rates "as early as July." We doubt that others on the committee share this view. In our view, Waller holds strong priors about the likely effects that are not widely held by other participants, including a view that the Fed should "look through tariff effects on inflation," that second-round effects would not resemble the post-pandemic experience, and that "if [inflation] got really bad, we could just pause." That said, even his approach would likely involve cautious and gradual easing, not the aggressive cuts advocated by the president.
… this was sent late Wednesday (and noted HERE) … and best in biz are still lookin to enter 2s10s steepener, 10s30s flattener and now will added SFRM6/M7 steepener IF … the price is right …
** Given Thursday’s market holiday and Friday’s likely limited participation, we’re publishing our weekly early and will return to our regularly scheduled strategy pieces on Monday morning. **
…Trading View … More cuts starting in summer 2026 implies less in 2027 and upward pressure on the SFRM6/M7 curve, which is currently at some of its flattest levels in over a year. We'll look to enter the trade on a move back toward the local flats.
Germany on longer-term rates and apparently, foreign demand hasn’t yet disappeared OR, said another way, maybe there are other factors aside from / along with ‘47 …
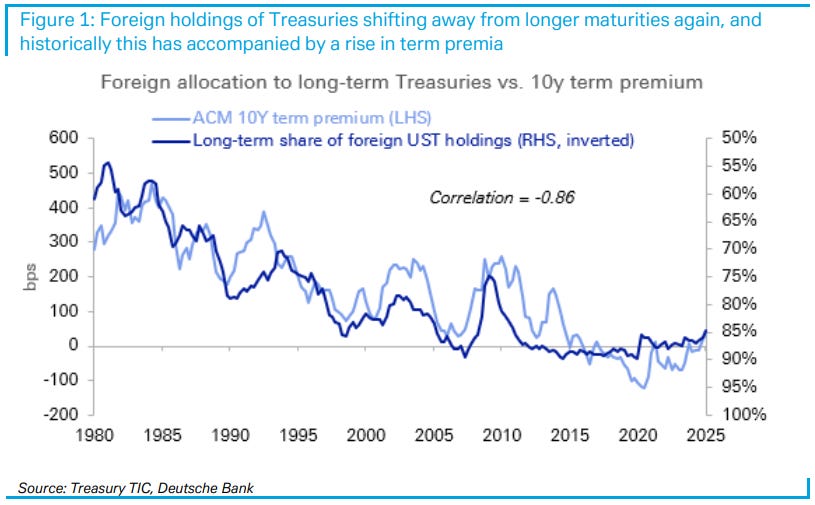
20 June 2025 DB: Foreign allocation to long-term Treasuries and UST term premium
We highlight an interesting relationship between the long-term share of foreign U.S. Treasury holdings and the Treasury term premium. Using monthly TIC data, we calculate the proportion of long-term securities – defined as original maturity of one year or more – within total foreign holdings and treat it as a measure of foreign appetite for duration risk. In the latest TIC release for April, the share was 84%, about the lowest level in nearly 15 years, having fallen from a peak of 90% just before Covid. Notably, this measure has exhibited a durable relationship with the 10y Treasury term premium, with a correlation coefficient of -0.86 dating back to 1980.
The reallocation toward shorter maturities underscores a broader retreat from long-term Treasuries. Concerns over inflation and Fed rate hikes have likely led foreign investors to reduce duration risk, favoring T-bills over notes and bonds. As noted last month, more than half of foreign private inflows in Treasuries during March went into short-term securities, likely reflecting a desire to position defensively amid elevated policy and market uncertainty (see "A TIC up in foreign Treasury purchases"). At the same time, the Treasury has increased bill issuance meaningfully over the last few years, providing ample supply to investors and further facilitated this shift. Foreign investors now own 23% of the outstanding bill stock, not far behind the 20%-40% for money market funds in recent years.
Building on our recent note on foreign UST holdings (see “Who really owns U.S. Treasuries? Adjusting for custodial bias in the data”), we view the long-term share of foreign UST holdings as an important indicator to monitor in the monthly TIC data. With the current trend in foreign holdings tilting toward shorter-term paper, the signal suggests ongoing upward pressure on the term premium.
… here’s an idea for those who are with, or long to be with steepeners … BUY 5s …
June 20, 2025 MS: Add Duration To Your Yield Curve Steepeners | US Rates Strategy
Don't let the lack of movement in US yields and curve shape cause complacency. Any summertime data that may encourage more voices on the FOMC to join Fed Governor Waller in arguing to lower rates ahead of weakness in labor markets would cause a much steeper curve, lower rates. Add 5y duration.
Key takeaways
Our economists do not expect sudden deterioration in labor market data, and they continue to expect a temporary inflection higher in core inflation measures.
Still, markets don't price enough risk of weaker labor market data, a lesser inflationary impulse, or a Fed that looks through tariff-driven inflation.
We suggest investors add to their yield curve steepeners (UST 3s30s, term SOFR 1y1y vs. 5y5y) and layer on an outright long in 5y UST notes (or FV futures).
The coming week will bring new UST issuance to the sector of the curve we prefer: from 2y notes to 7y notes. Use this opportunity to add UST duration.
The 5y to 7y sector of the UST curve carry and rolls flat-to-positive over 6 months at current financing rates – which may come down over that horizon.
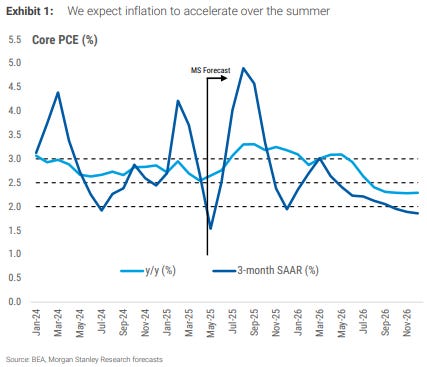
…United States | By the time it's obvious, it will be too late … On Friday, Fed Governor Waller suggested he would feel comfortable easing policy as early as July, looking past the expectation that inflation would rise 0.3 to 0.5%, in order to avoid waiting until the job market weakens to cut rates. Our economists forecast a similar rise in core PCE inflation on a Y/Y basis (see Exhibit 1 and Exhibit 2).
…In our view, markets do not properly reflect downside risks to inflation and labor market data over the summertime - downside risks that, if realized, would allow the market to price a more dovish path for Fed policy.
… While the median dots in June have tended to skew too hawkish relative to realized policy, we don't take comfort in the historical record – particularly when so much rides on the evolution of US public policy.
We simply note that the historical record supports the famous Yogi Berra quote, "It is difficult to make predictions, especially about the future."
… Trade idea: Enter long UST 5y at 3.96% with a target of 3.25% and a stop of 4.20%.
Trade idea: Enter long FVU5 at 108-08 with a target of 111-16 and a stop of 107-08.
Trade idea: Maintain UST 3s30s yield curve steepener at 0.99% with a target of 2.10% and a trailing stop of 0.75%…
… same firm on EQUITY flows you might wanna knows …
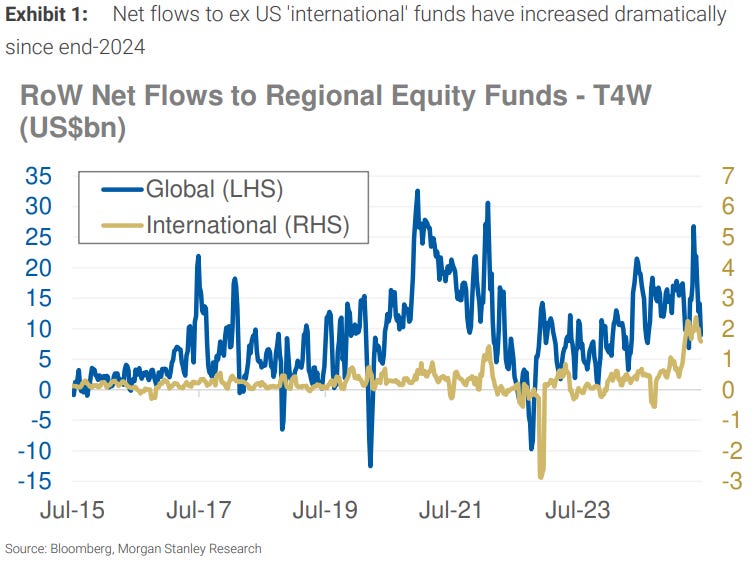
June 20, 2025 MS: Cross-Asset Flows and Allocations: Where Are Equity Flows Going?
Demand for US equities is weakening to almost the sole benefit of European stocks. Section 899 concerns can sustain these trends, but we think the narrative of foreign investors deserting US stocks is overdone. Flows are not a zero-sum game; the US market should still see inflows, just less of them.
Key takeaways
Foreign demand for US stocks endures, but it is lower post-Liberation Day. Surprisingly, it's US investors who have shifted the most from domestic equities.
European equities dominate as *the* top destination for equity fund flows, with nearly US$37bn YTD, significantly higher than the run-rate of prior years.
However, these flows are still not reflected in global equity funds allocation so far – less US, more RoW stocks are aligned with benchmark weight changes.
Where we've seen signs of active diversification away from US stocks is in the record flows into international equity funds (i.e., global ex US).
These trends last as long as US policy uncertainty lingers. But the sheer size of the US stock market means it should still receive inflows, just less of them.
The Fed remained on hold at the June meeting. The FOMC expects to see the effects of tariffs on inflation in the summer, as do we.
Key takeaways
At the June FOMC, Chair Powell maintained his wait-and-see stance, noting he expects to see a pickup in inflation from tariffs "over the course of the summer."
The Fed's projections showed higher inflation and slower growth, moving towards our forecasts for 2025.
While the median number of cuts for 2025 remained at two, there was greater divergence among the committee.
Oil prices rose but we think the push to core inflation will be minor.
Big beautiful bonds. Rising debt and QT will continue to flood the markets with bonds. There is appetite, but a shift away from long bonds and dollar assets is becoming apparent.
In limbo. The first six months of Trump's administration have seen volatile rates. While risks remain, perceptions of tail risks are diminishing, and economic data will guide the future.
Policy pause. Central banks are holding policy steady but are ready to ease rates if growth and inflation decline.
Term premia rebuilding a long game. Increased borrowing will gradually incorporate term premia into longterm rates, depending on investor absorption and international flows.
Steepening not over. The cycle may be ending, but demand for short-duration may persist until more clarity emerges.
Unstoppable spreads. Peripherals are outperforming core and semi-core. Further narrowing is possible as Germany uses its fiscal space.
…US RATES OUTLOOK Resilient, but for how long?
It is tempting to draw up simple cause and effect relationships – tariffs = higher inflation, deficits = higher yields, but the reality is a bit more complex. The US economy remains resilient despite a high degree of uncertainty on tariffs, fiscal policy, federal spending cuts, and the evolving global trade and geopolitical landscape. While this is likely to lead to lower growth and higher inflation, the magnitude of the impact is uncertain. Our base case sees a ‘muddle through’ for the economy and Treasuries remaining in a range in 2H25. We expect the Fed to cut rates twice this year to counter the slowdown in growth and employment arising from Trump 2.0 policies. But Treasury yields should remain in a range, with the 2yT yield at 3.5-4.0%, 10yT yield at 4.0-4.5% and 30yT yield at 4.5-5.0% this year. However, with resilience waning, we believe the risks to yields are skewed to the downside.
… Moving along TO a few other curated links from the intertubes, which I HOPE you’ll find useful …
Oh no … yer telling me there’s a chance ‘47 may be right (again)?
June 21, 2025 Apollo: Has Trump Outsmarted Everyone on Tariffs?
As we approach the Trump administration’s self-imposed 90-day deadline for trade deals, markets are starting to speculate about what comes next. The longer uncertainty remains elevated, the more negative its impact on the economy, as shown in the chart below.
Maybe the strategy is to maintain 30% tariffs on China and 10% tariffs on all other countries and then give all countries 12 months to lower non-tariff barriers and open up their economies to trade.
Extending the deadline one year would give countries and US domestic businesses time to adjust to the new world with permanently higher tariffs, and it would also result in an immediate decline in uncertainty, which would be positive for business planning, employment, and financial markets.
This would seem like a victory for the world and yet would produce $400 billion of annual revenue for US taxpayers. Trade partners will be happy with only 10% tariffs and US tax revenue will go up. Maybe the administration has outsmarted all of us.
Lacy Hunt in waiting … Eric Basmajian asks / answers …
Jun 21, 2025 EPB Research: Where Does the US Economy Stand Today?
…To answer the question directly, the US economy is growing at a rate of roughly 1.8% as of the latest data. This is down slightly over the last few months and slightly below the “trend” growth of 2%, but over the last two years, growth has been remarkably stable.
Weaknesses in real retail sales, industrial production, and the unemployment rate are offset by strengths in nonfarm payrolls, real personal consumption, and real personal income. It’s worth noting that the weaker three variables were also the variables that weakened first in the 2008 cycle…
Brent Donnelly with a GREAT chart of 2s and FF — pictures truly are worth a thousand (Waller)words …
Chris Waller has decided to head a strongly dovish charge at the Fed, even as the rest of the committee seems more interested in a wait-and-see approach.
*FED’S WALLER: COULD CUT RATES AS EARLY AS JULY MEETING
His thinking might be that if there is a bit of flex in July FOMC pricing, that creates a feedback loop where the psychology of the Fed is amenable to at least thinking about thinking about a cut. If July FOMC is priced at 14% chance of a cut, the Fed won’t cut. It’s circular as they can guide the market or the market can guide them, depending on the circumstances. You can see 2-year yields lead on the way up (orange line) because the Fed hates hiking and only does it when it’s absolutely forced to do so. Fed Funds and the 2-year yield go down in synch because the Fed leads the way ‘cuz they love to cut.
Anyway, Waller continues to lead the dovish camp, but I am not too sure how many others are with him at this point. He’s like Jerry Maguire standing up in the middle of the office yelling: “Who’s coming with me?”
I guess in this analogy Austan Goolsbee is Renée Zellweger?
Nobody has a clue on 10-year yields as the Big Beautiful Bill is not at the forefront of the narrative right now, CPI is soft but could unsoften in coming months, Atlanta Fed GDPNow is booming on a snapback, and the US jobs market is deteriorating veryyyyyyyyyyyyyyyyy slowly. Too slowly to matter much for bonds so far….
… slowly at first then all of a sudden? Brent’s entire note worth a look …
And as you do, have a look at who owns USTs …
Jun 20, 2025 WolfST: Who Held or Bought the Huge US Government Debt even as the Fed Shed Treasury Securities in Q1? An Iffy Situation
Here's who dumped and who bought over the years through Q1.
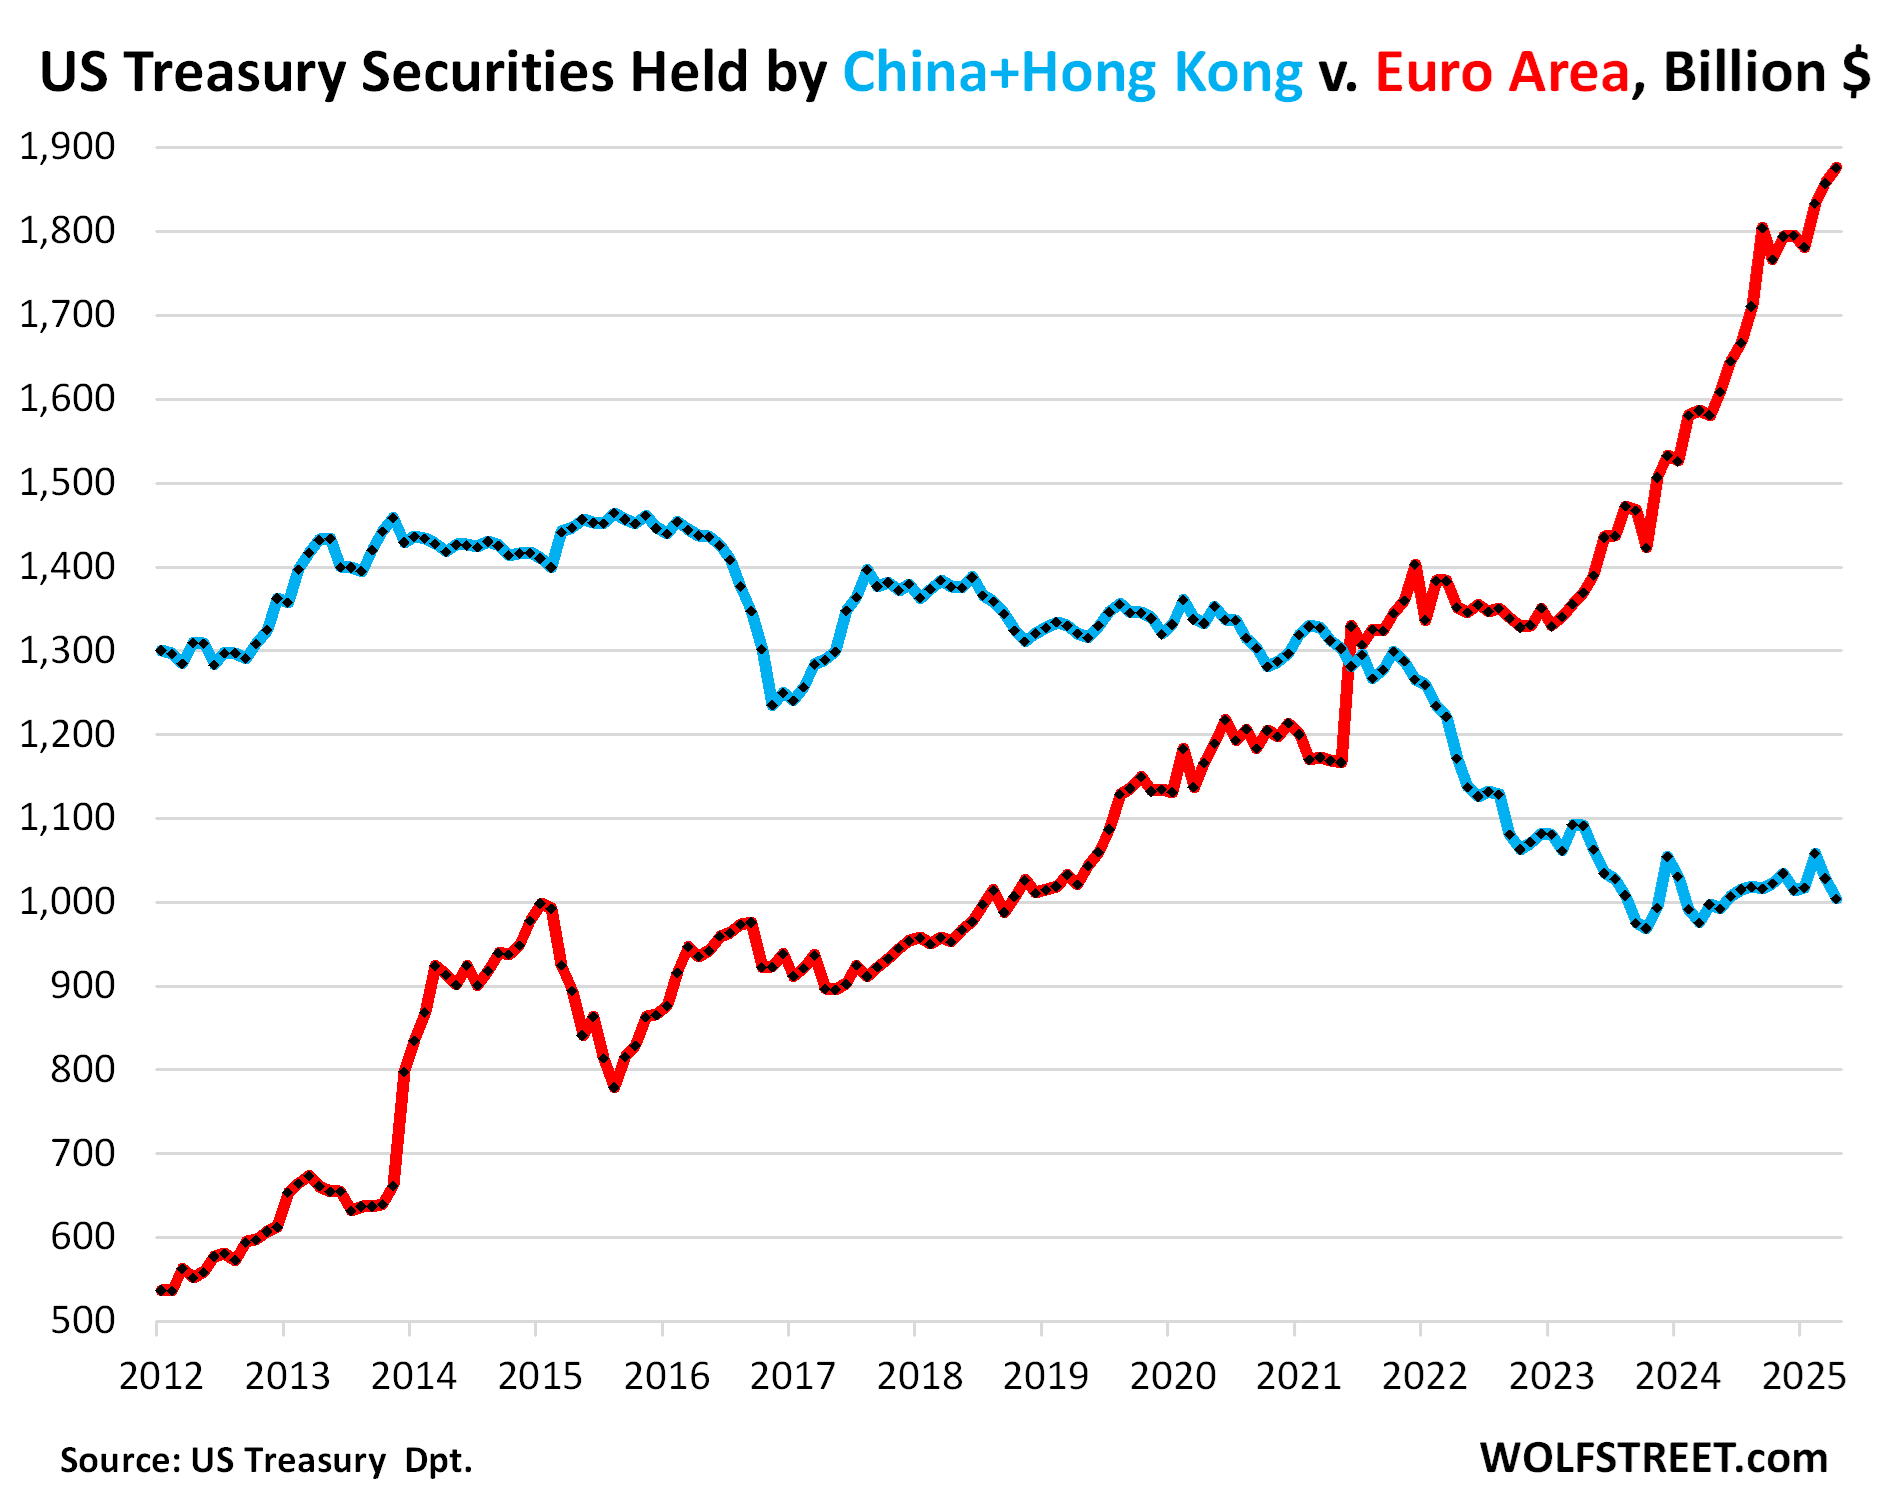
…Biggest foreign holders at the liability level:
The importance of China and Japan continues to fade as Europe, financial centers, Canada, India, Taiwan, and others have been piling them on:
The top six financial centers: $2.73 trillion (blue)
Euro Area: $1.88 trillion, which includes three of the financial centers (green)
Japan: $1.13 trillion (gold)
China and Hong Kong combined: $1.0 trillion (purple).
Top 6 financial centers held a record $2.73 trillion, up by $396 billion year-over-year.
US corporations hold a portion of these Treasury securities to park their overseas profits there to avoid US income taxes.
China unloads, Euro Area loads up: The Euro Area – which includes the three financial centers Luxembourg, Belgium, and Ireland – has been purchasing Treasury securities on a large scale over the years. The Euro Area now holds nearly twice as much as China and Hong Kong combined.
Over the past 12 months through April, the Euro Area added $295 billion, bringing its total holdings to a record of $1.88 trillion at face value.
Over the past 12 months, China and Hong Kong added $7 billion, despite shedding some securities in March and April. Over the long term, they have been reducing their holdings of Treasury securities. At the end of April, their total holdings were $1.0 trillion, down by 31% from 2015.
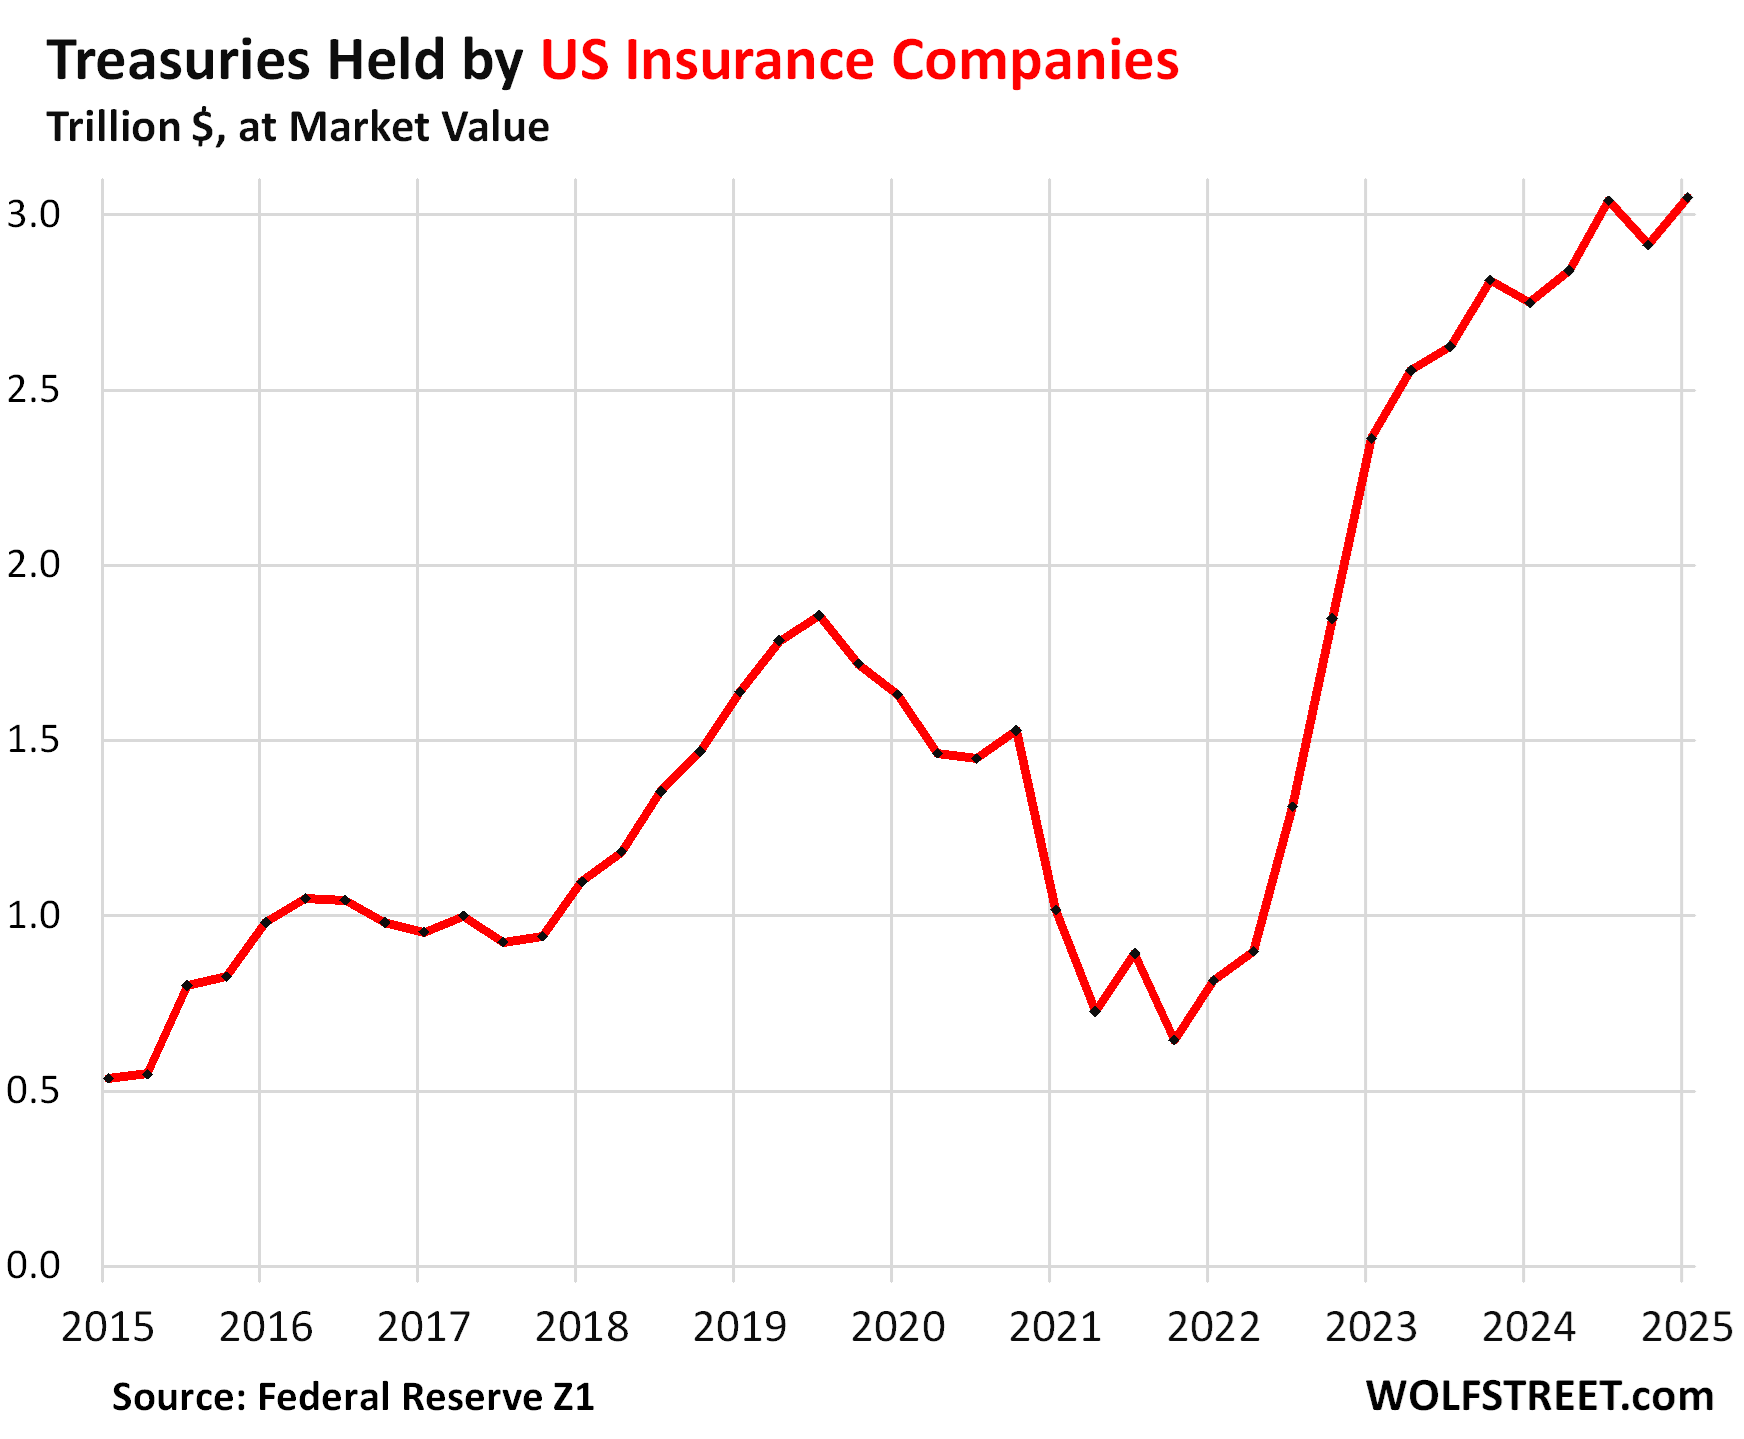
… Insurance companies held $3.05 trillion of Treasury securities at market value, or 11.3% of the debt held by the public, of which property and casualty insurance companies held $2.86 trillion and life insurers held $191 billion.
Insurance companies have been huge buyers after yields started to rise, and Treasuries started to make a little more sense again. Since mid-2021, they multiplied their holdings by nearly five.
Also note how they got out of Treasuries during the Fed’s interest rate repression, starting in mid-2019 when the Fed started cutting rates again, and market prices were rising. Insurers got out, while banks were loading up.
As prices were rising and yields were falling, insurers shed two-thirds of their holdings. So when yields started rising again in 2022, and banks took huge losses and several collapsed in early 2023 because of it, insurers came out with low holdings of these securities, and they started buying again at these lower prices and higher yields.
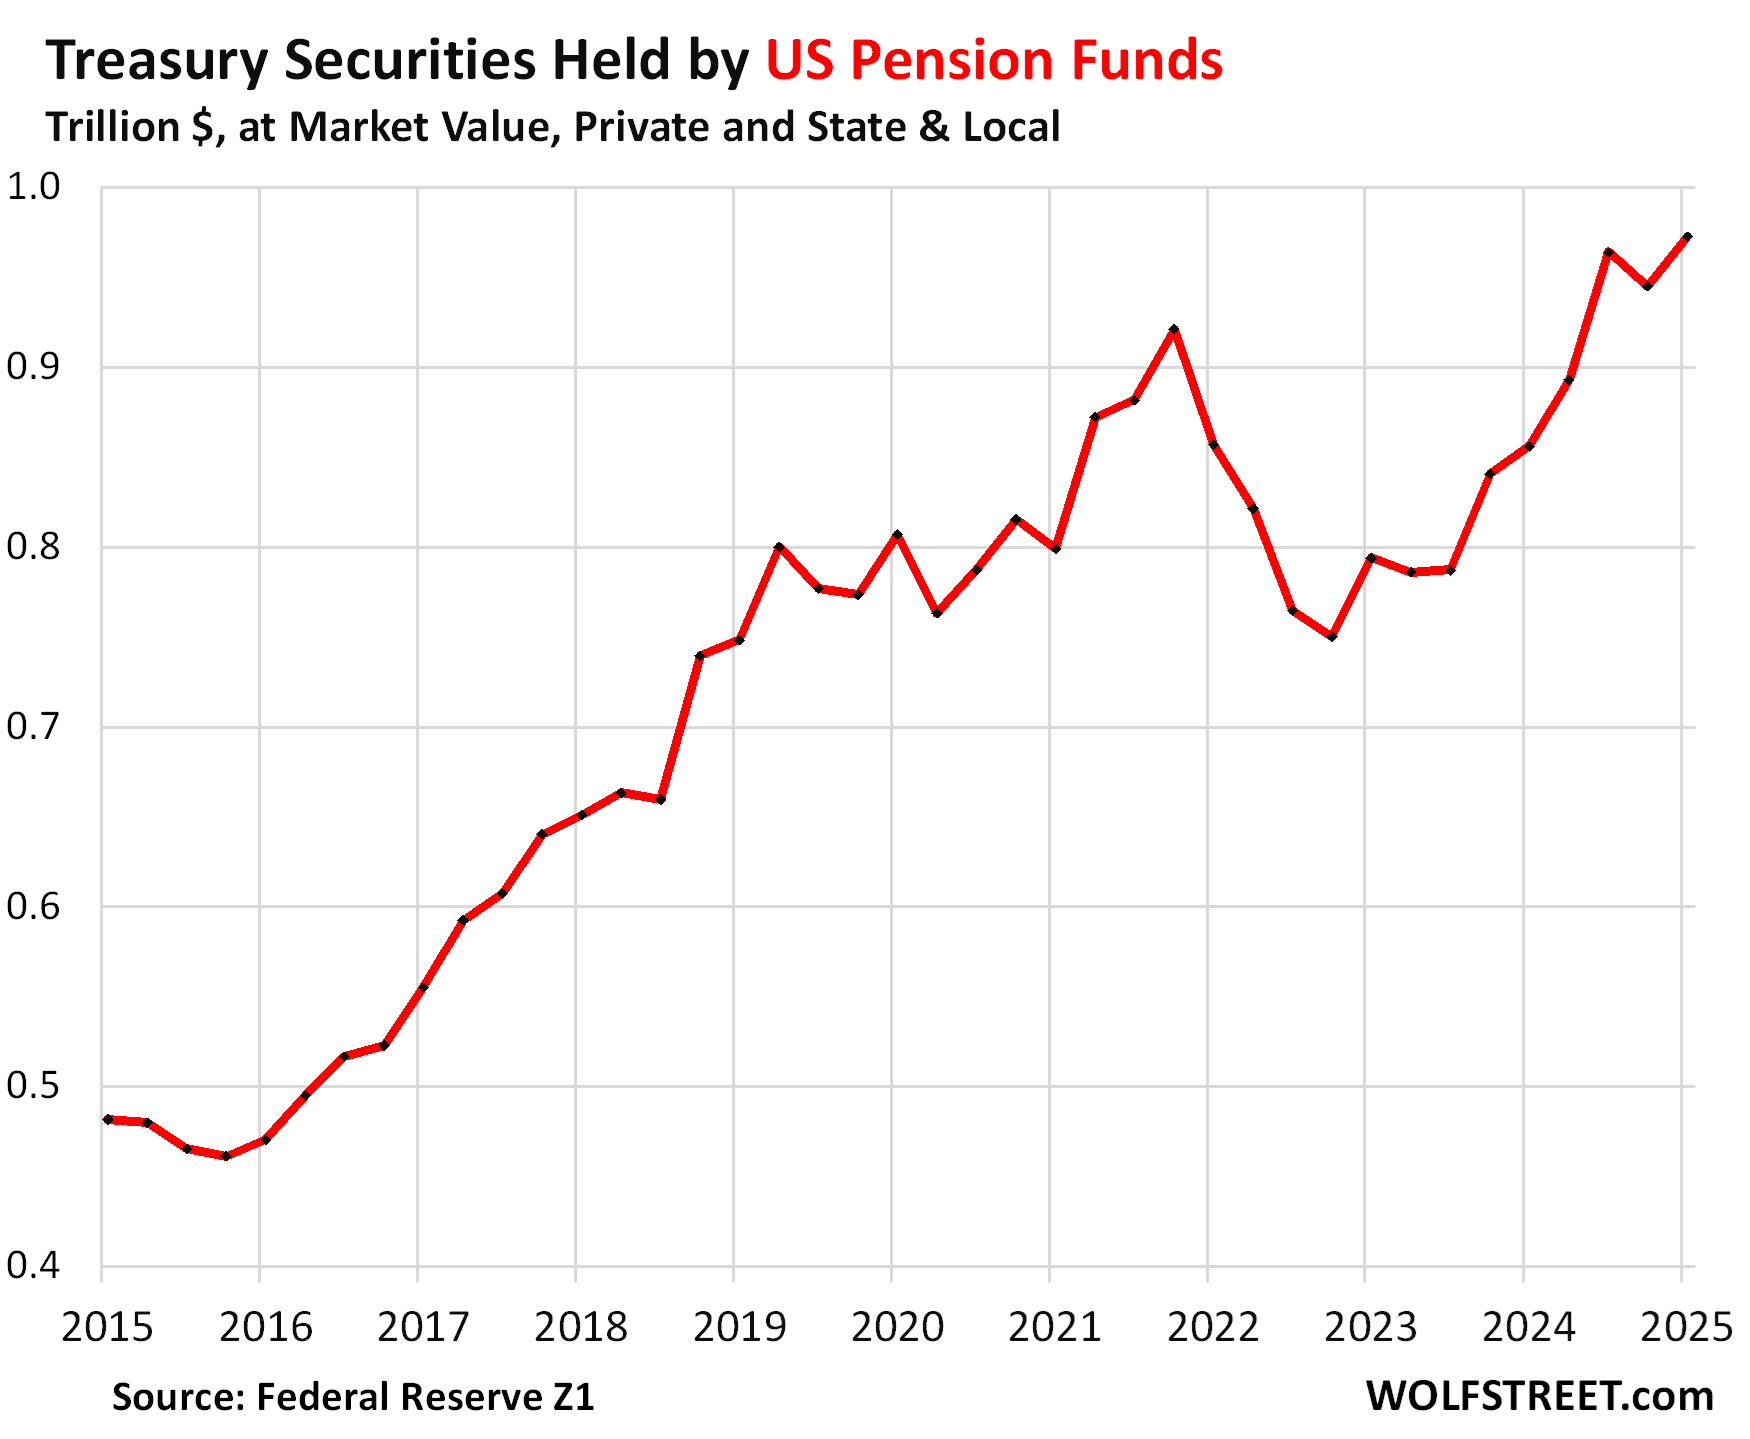
…US pension funds held $972 billion of Treasury securities at market value, or 3.6% of the debt held by the public. This includes private pension funds and state and local government pension funds.
… AND for any / all (still)interested in trying to plan your trades and trade your plans in / around FUNduhMENTALs, here are a couple economic calendars and LINKS I used when I was closer to and IN ‘the game’.
First, this from the best in the strategy biz is a LINKthru TO this calendar,


 - IMDb")