weekly observations (06.02.25): watching 'double top risk' 30s (BAML); bullish bond seasonals (BMO); record SHORT FV (DB); DiMartino BOOTH, a must watch...
Good morning / afternoon / evening - please choose whichever one which best describes when ever it may be that YOU are stumbling across this weekends note…
First UP, and beyond the trade talks (new, last night, 50% tariffs on steel? EU to respond -CNBC) and mkts stumbling early on US v China news (HERE and HERE?), the Fed favored PCE …
Reuters: OPEC+ may discuss oil output hike larger than 411,000 bpd for July, sources say
… seems to ALL be pointing out how … gulps … Trump was right ‘bout everything?
Still.
Again.
The ‘flation moving in correct direction … the very same direction desired by ALL (no matter what side the aisle, we’re all filling up our refrigerators and gas tanks) …
Basically, JPOW and DJT huggin’ it out and, well, maybe just maybe, da Fed could / should be lowering rates IF / WHEN it sees fit …?
Back TO Friday and soft U o MISSagain data …
ZH: UMich Survey Shows ImprovementDespite TDS Still Among Democrat Respondents
… Alrighty, then.
A quick look at LONG BONDS, WEEKLY as month-end index needs are now behind us AND as the jobs report awaits next week …
30yy WEEKLY: 4.92 TLINE and stochastics appear to be BULLISH …
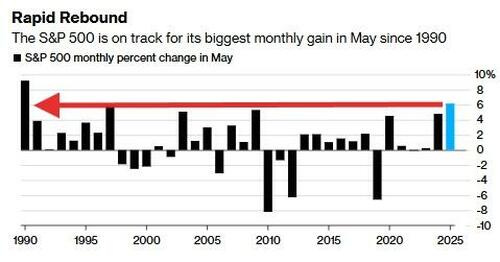
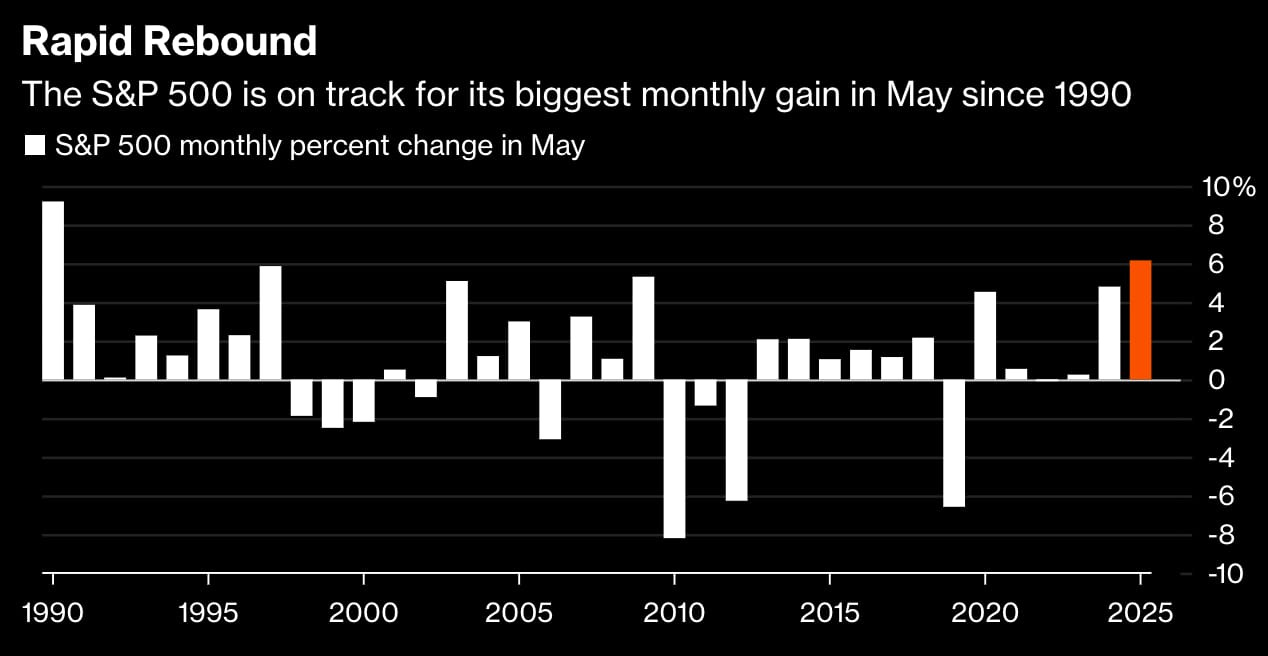
Yet and with THAT in mind, stocks a best May since 1990 … Really? Yes, really …
ZH: Stocks Soar To Best May Since '90; Gold Gains As Dollar Dumps To Three-Year-Low
…TheS&P 500 just rallied to its best May since 1990...
If you're wondering why, Goldman's Brian Garrett notes that if it’s felt like market-on-close imbalances have been consistently better to buy, it’s because they have...May will be the largest monthly sum of MOC buys in 2.5 years…
… read through full note and again, consider what appears to be a bullish bond setup and ask IF Fed shoulda woulda be cuttin’ more and sooner and as you do that, something to accompany your process of thought.
THE one and only … Danielle DiMartino Booth of QI Research: The Fed is Derelict in it's Duty to the American People … I’ve listened and I’ll listen again BUT it’s compelling and IMO, bullish of rates (which again makes ME pause as it’s not initially my view) … SHE is one of the best in the business (and very much aligned with what you’ll see below from, say, others who are ALSO best in the biz — BMO) …
… Lot of moving parts and SHE has forgotten more about global markets than I may ever have known and again, while MY view is now limited to what I can see from Global Wall (below) and readily avail on the intertubes AND has been somewhat more constructive, when I watch and listen to Danielle, well … Have to say it’s hard to dispute.
Hard for me to fight my former and inner bond jockey daemons where economic glass was only and forever MAYBE half full.
I’ve just not the time nor the (Bloomberg, economic workbench, access to brilliance) resources to dig as deep as she.
I’d LIKE to think things are better.
Jobs report in the week ahead will be very telling — as telling as was yesterdays PCE.
Little bit below on the jobs market as there was over the course of the week just past (HERE) and so, for now, I’ll let this all marinate and likely watch couple more times before weekend is OUT.
I’ll move on TO some of Global Walls WEEKLY narratives — SOME of THE VIEWS you might be able to use. A few things which stood out to ME this weekend from the inbox
A rates weekly from THE bank of the land with a catchy title (who are underweight duration yet, at same time, watching ‘double top risk’) …
30 May 2025 BAML: Global Rates Weekly Legally bond
…Rates: Fed inflation point may start next week US: Fed cutting trough likely to re-price higher if strong data next week. We close Z5-Z6 flattener & pay Z6. We like underweight duration, 10s30s steeper, and short 30y spreads…
…Why has the market re-priced end ’25 more than end ’26? We see at least 3 reasons: (1) inflation expected decline in ’26 (2) new dovish Fed Chair in May ’26 (3) Fed dot plot.
Inflation: inflation should decline in ’26 due to tariff-related base effects; however, reaccelerating US growth may limit extent of inflation decline.
New Fed Chair: the new Chair will likely bend an ear to the President but it will still require a majority of the FOMC (currently 12 voters) to support a policy decision; we sense the market is putting too much weight on the new Fed Chair to justify ’26 cuts.
Fed dot plot: Z5 & Z6 are now priced below Fed dots (end ’25 dot = 3.875%, end ’26 dot = 3.375%) but trade & US data developments skew risks to higher Fed dots; in ’25 it will take an upward shift of 2 dots move the median +25bps, in ’26 it will take an upward shift of 4 dots to move the median +25bps & 6 dots to move median +50bps…
…US core rate views: still underweight, esp. at front end Duration: we remain tactically underweight US duration (see: May 16 Global Rates Weekly). Our logic: US economic data has been solid & recession risks have declined with trade de-escalation. We continue to believe US rates have lagged US macro data & the re-pricing of other markets. USD is even more of an outlier vs USTs (Exhibit 6)…
…Bottom line: we are constructive on near-term US data which can drive a narrative shift around Fed cuts. If market starts to question Fed cut rationale, Fed cutting trough will re-price. We close our Z5-Z6 flattener & are now outright paid Z6. We are still underweight US duration, in 10s30s steepeners, & short back-end spreads.
…Technicals: Seven big beautiful breakouts We recap seven breakouts seen thus far in Q2 including US 30Y yield’s battle with 5% and the Schatz-BUXL spread steepening above resistance lines.
…To summarize, breakouts favor the world ex-US, higher long-end yields (for now), still steeper curves, higher EURUSD, lower USDCHF and higher spot platinum prices. The headlines for each of the seven charts summarized in this report are as follows…
…3. US 30Y yield uptrend broke above 5%, watching 5.18% as double top a risk.
We previously argued that technical patterns and signals over the last couple of months had shifted in favor of a move higher in yields. Trend measures have estimated a move higher to 5.02% (reached), 5.18% (almost reached last week) with upside risks to 5.40% and possibly 5.65%.
The longer yield remains below or fails to move decisively above 5.18%, the greater the chance for a double top to form with the peak in 2023 at about 5.18%. This scenario would be in line with our cyclical bull market bias in 2024-2025. The chart needs a little more time to tell us if this becomes the relevant case vs the patterns and oscillators that have been in favor of the uptrend that has been underway…
… AND some FLOWS to knows from the bank of the land (better late than never?) …
29 May 2025 BAML: The Flow Show The Bourse Whisperer
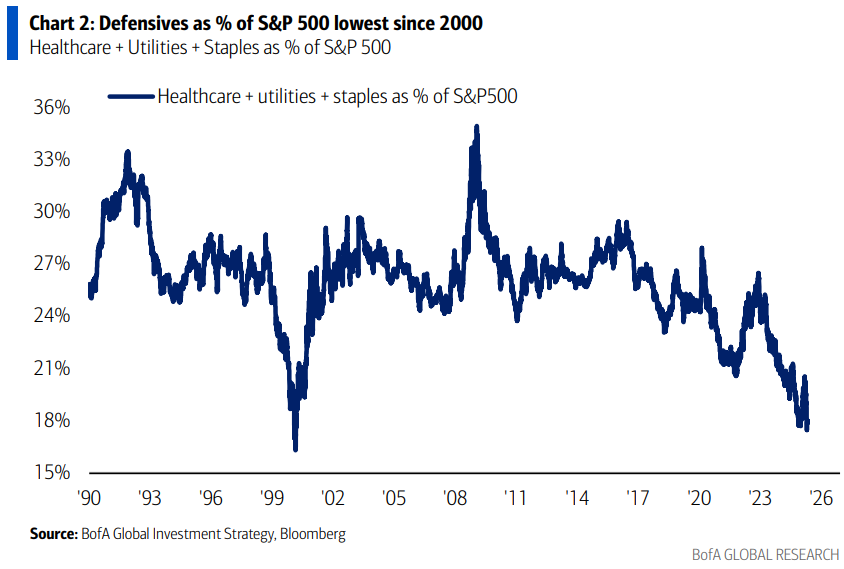
…The Biggest Picture: bears position for breakdown via defensive healthcare, staples, utilities (now just 18% of S&P 500 index, lowest since 2000 – Chart 2); bulls position for breakout via “long Magnificent 7, long RoW value stocks" barbell (hedges blow-off top in US and EU/China fiscal excess; note inflection of US value vs International – Chart 4)…
An economic week ahead with some excellent perspective, from across the pond …
Trump's policy making per executive order confronts the complexity of democracy’s checks & balances: Congressional procedures, court rulings, appeals, etc. This further complicates the administration's plans and extends uncertainty. Next week, the ECB and US jobs data return the focus to economics.
…US Outlook Clarity postponed, serenity never Outlook uncertainty has re-intensified, with legal challenges threatening the administration's justification of tariffs. Although this could mean interruptions, we think that tariffs will be implemented one way or another. Sentiment reminds that consumers view their fortunes as tied to trade.
Best in show on BOND FRIENDLY seasonals (June thru Aug) remains tactically short 10yr breaks, ‘bumped stop down’, considering ‘scaling into 2s10s steepeners, fading rallies in FFF6 (later resumption of rate CUTS than Sep 17 mtg) — important, IMO …
In the week ahead, the Treasury market will have the benefit of a full docket of fundamental inputs starting with ISM Manufacturing and capped by the May payrolls report. The week will offer an updated take on the relevance of the current data over forward expectations based on the actions of the Trump Administration. Given that many of the releases cover the month of May, one should anticipate a degree of influence from the trade war and the associated uncertainty. It’s the latter influence that we suspect will be more relevant for the employment data – after all, uncertainty breeds indecision. This is particularly relevant when considering the fact that labor statistics are notoriously a lagging indicator. To be fair, we’ve been in the camp anticipating a challenge to the resilience of the labor market for months, and we’ve yet to see this come to fruition. As for the relevance of current data over trade-war-inspired inflationary angst, we’ll argue that if any realized data releases should be traded, it’s those on offer in the week ahead.
The current consensus is for an increase in headline payrolls growth of +125k during May, compared to +177k seen in April. It's a downshift from the recent trend, but not to the point of being troubling on an outright basis. In addition, the Unemployment Rate is seen unchanged at 4.2% – an impressively low level in light of the prevailing crosscurrents facing the US economy. Note that the recent increase in initial jobless claims points toward some softening on the labor front, but the data was for a period after the NFP survey week. On net, we don’t see any particularly compelling reason to expect a softer payrolls print on Friday – at least not outside of the fact that uncertainty implies downside risk.
The market also hears from Powell on Monday as he gives the opening remarks at the Board’s International Finance Division’s annual conference. The forum is topical, and we’re expecting a few tradable headlines, although the absence of Q&A implies that the Fed’s messaging will be consistent and point toward an extension of the wait-and-see policy stance. As we’ve seen the courts mount a challenge to Trump’s tariffs, it strikes us that patience looks particularly prudent at the moment. The week ahead is also the final window for the Fed to refine its messaging prior to the June 18th FOMC meeting. In the event the Committee is leaning more hawkishly or considering delaying cuts into 2026 (signaled via the dotplot), a setup for such a shift in rhetoric could be on offer. That being said, we are not anticipating such a change.
Instead, we suspect that the week will be spent absorbing the incoming economic data while the market remains well-within the confines of the prevailing range. 10-year rates have retraced well following the recent deficit-inspired peak at 4.627%, and the rally that has brought benchmark rates below 4.40% still has a distance to run further before risking overbought conditions. The yield curve remains a directional trade – bull flattener or bear steepener with 2s anchored to a 3.90% to 4.00% range based on stable monetary policy expectations. The 2s/10s curve remains content to use 50 bp as an anchor, and it won’t be until there is another deficit spending-inspired spike in term premium or weaker data that brings forward Fed cut expectations that we anticipate the focal point will shift. We’re open to revisiting the supply implications from the budget process, even if lower tariff revenues (or the potential, for sure) present challenges to the House bill making it smoothly through the Senate without drawing the attention of any lingering deficit hawks – admittedly an endangered species in the current environment…
…Charts of the Week …With the summer solstice on the horizon, our second chart takes a look at the historical performance of 10- and 30- year yields from the first trading day of June to the last trading day in August. Over the last decade, 10-year notes rallied 9 bp, on average, during the June-August period while the long-bond rallied by an average of 12 bp. While the seasonals show a bias toward lower 10- and 30-year rates over the coming months, it goes without saying that the current macro environment has been anything but traditional. The reality is that the Administration continues changing the rules (trade, immigration, etc.) – thereby reinforcing the collective sense of instability and uncertainty. In this context, the duration-friendly summer seasonals may be de-emphasized, but shouldn't be overlooked.
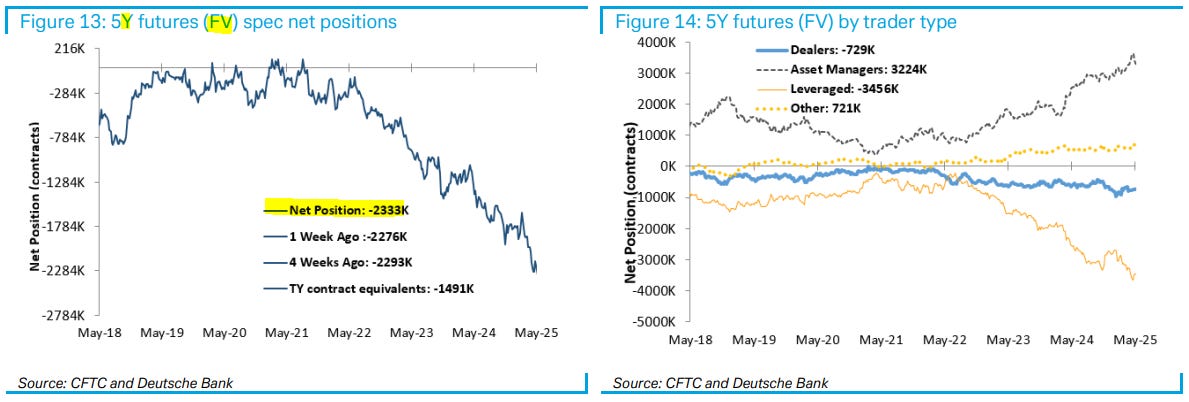
Positions matter and even those from the ‘evil speculators’ and while there doesn’t appear to be much ‘there’ there, I did spy with my little eyes … a record net short in belly AND a look at positions and flows (in stonks) …
… Speculators sold 57K contracts in FV to extend their net short positions to a record -2,333K contracts.
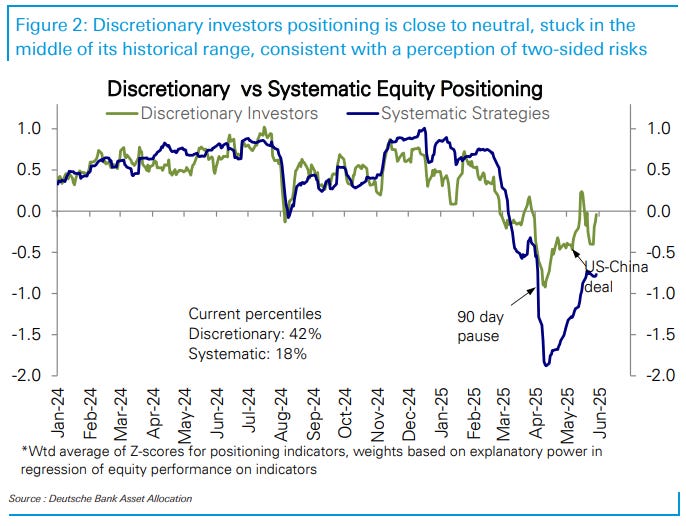
30 May 2025 DB: Investor Positioning and Flows - Stuck In The Middle
After the steep climb on the US-China trade deal, our measure of equity positioning has largely gone sideways since and is moderately underweight (z score -0.45, 23rd percentile). Discretionary investors positioning is close to neutral, stuck in the middle of its historical range, consistent with a perception of two-sided risks (z score -0.04, 42nd percentile). Systematic strategies positioning is still notably underweight (z score -0.77, 18th percentile). The lack of movement is notable given an abundance of catalysts in both directions over the last two weeks: the threat of tariffs on Apple, the threat of 50% tariffs on the EU and its delay, the surprise court ruling against reciprocal tariffs, and the re-escalation with China. The market has not reacted to the headlines collectively or individually, with equity vol and daily ranges quite modest and bond vol dropping to a two-month low. Across sectors, positioning in Tech and the cyclicals remains underweight. Meanwhile, equity funds (-$9.5bn) this week saw the largest outflows year-to-date, driven by record outflows from Japan (-$11.8bn) and outflows from the US (-$5.1bn), offset partly by inflows to Europe ($1bn) and EM ($2bn). Inflows to bond funds ($19.3bn) remained robust and broad-based.
Same shop using AI to show Fedspeak is most hawkish in ‘while …
30 May 2025 DB: DB AI shows Fedspeak most hawkish since early 2023
We leverage our proprietary LLM tools to analyze the hawkishness/dovishness of communications from all 12 voting FOMC members. This analysis builds on our previous work analyzing speeches by a smaller group of officials, including Chair Powell.
We leverage our proprietary LLM tools to analyze the hawkishness/dovishness of communications from all 12 voting FOMC members. This analysis builds on our previous work analyzing speeches by a smaller group of officials, including Chair Powell. The updated sample captures the shift in Fed communications in response to recent tariff announcements, market volatility, and heightened economic uncertainty. By focusing on Fed officials' speeches, a more flexible communication channel, we aim to provide a nuanced and timely view of evolving Fed sentiment.
Similar to our previous work, the results are encouraging (see Fedwatching with DB's AI tool and Using DB AI to ID Fed hawks and doves). The broad trajectory of the scores – both at the individual and aggregate levels – are consistent with our subjective assessment, in terms of the evolution across time and the differentiation across officials. Moreover, the scores confirm that Fed communications have become more hawkish since January, as officials started to consider tariff-induced inflation risks. Indeed, on a three-month average basis, FOMC communications have recently been the most hawkish since February 2023. This hawkish shift is consistent with our expectation that the Fed will only cut rates once this year, in December (see US outlook: Tariff-struck).
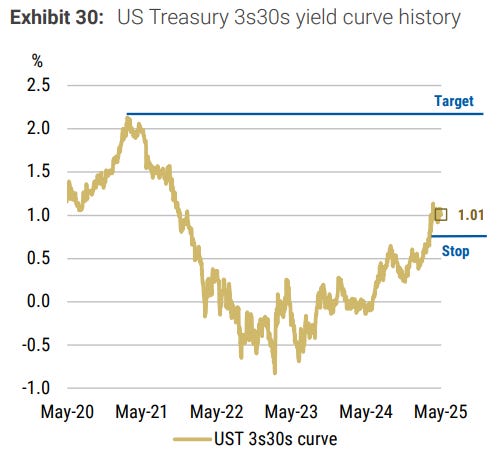
A few follow up words / reiteration of a mid-year outlook from a shop that I continue to be extremely grateful to keep receiving their work (and they are maintaining 3s30s steepening exposure) …
May 31, 2025 Morgan Stanley Insight: The Moments of TRUTHs | Global Macro Strategy Mid-Year Outlook
We think rates and currency markets have embarked on sizeable trends that will be sustained - taking the US dollar much lower and yields curves much steeper - after two years of swing trading within wide ranges. The TRUTHs may not set you free, but navigating them by trading with these trends will.
Key takeaways
G10 rates: The skew for G10 policy rates leans very dovish through 2026. It's this dovish skew that informs our view on the likely direction of G10 rates: much lower. We see 10y UST yields reaching 4.00% by the end of 2025 and ending 2026 just above 3.00% - significantly outperforming German Bunds, UK gilts, and JGBs as the Fed cuts rates much more than forwards price in 2026.
G10 FX: The DXY fell faster than we had anticipated in our year-ahead outlook, reaching our year-end target of 101 last month. We think that this weakening trend continues, and we now forecast the DXY to fall an additional 9% over the next 12 months to 91, with USD weakness most pronounced against its safe-haven peers – EUR, JPY, and CHF.
Interest Rate Strategy In the US, we expect Treasury yields to continue range trading through 3Q25 before starting their move lower in 4Q25. We forecast 10-year yields to reach 4.00% by the end of 2025. Treasury yields stage a much larger decline in 2026 as the Fed delivers 175bp of rate cuts on the back of weaker real growth and inflation moving back to target…
…In our baseline, we expect Treasury yields to continue range trading through 3Q25 before starting their move lower in 4Q25. We forecast 10-year yields to reach 4.00% by the end of 2025. Treasury yields stage a much larger decline in 2026 as the Fed delivers 175bp of rate cuts on the back of weaker real growth and inflation moving back to target.
Relative to the market-implied path for Fed policy, our economists forecast a more dovish outcome. As a result, we forecast 10-year yields to end 2026 just above 3.00%. The Treasury curve also range trades through 3Q25 before accelerating steeper in 4Q as investors begin to accept the pricing of much lower policy rates.
Ultimately, we think the yield curve will steepen substantially more than the forwards imply today, i.e., the carry and roll profile presents only a minor hurdle. As a result of the low cost and upside risks to curve steepness, we continue to suggest investors hold Treasury curve (and SOFR curve) steepeners. We think the trend to a steeper curve should strengthen, and that a steepening of the rate expectations curve should drive the next impulsive leg of the trend…
…Trade idea: Maintain UST 3s30s yield curve steepener at 1.05% with a target of 2.10% and a trailing stop of 0.75%
Trade idea: Maintain term SOFR 1y1y vs. 5y5y curve steepener at 0.83% with a target of 2.10% and a trailing stop of 0.50%.
Another note from across the pond reiterating overseas demand for USTs is FINE …
30 May 2025 NatWEST: US Weekly Economic and Strategy Brief
…US Rates: One of the main narratives in markets post-Liberation Day has been that foreign and international investors are migrating away from US assets due to the negative growth / inflation implications of US trade policy, coupled with the deficit impact of currently proposed fiscal policy. This idea has translated to rumblings of a “Sell America” theme, whereby shaken investor confidence in US Treasuries and the dollar as haven assets may be prompting a shift to alternatives.
… We also look at the detailed Treasury auction allocation data, specifically foreign and international participation, as this is released on less of a delay (chart below). Data released May 22nd cover the 3y, 10y, and 30y auctions the first week of May as well as all auctions in the April week post-Liberation Day. The data speak for itself – foreign participation in the 10y and 30y auctions increased in both April and May and are in-line with recent averages.
Covered wagons on clarity AND on mortgage rates …
May 30, 2025 Wells Fargo: Weekly Economic & Financial Commentary
United States: Waiting for Clarity Uncertainty continues to shape economic data. Personal spending was revised lower in Q1 but rose at a modest pace in April amid sturdy income growth. Inflation also remains in check, but we expect to see a tariff-driven bounce in goods prices in the coming months. Meanwhile, the appetite for large capex is generally weak and the housing market remains on ice…
…Interest Rate Watch: Mortgage Rates Move Back Up Mortgage rates are back on the rise. According to Freddie Mac, the average 30-year commitment rate climbed to 6.89% during the week of May 29, the highest level since early February. Stepping back, mortgage rates are little changed over the past year. High financing costs remain a significant constraint on residential activity.
Mortgage rates are back on the rise. According to Freddie Mac, the average 30-year commitment rate climbed to 6.89% during the week of May 29, the highest level since early February. The move up coincides with a similar increase in the 10-year Treasury yield. Although there has been some easing over the past week, the 10-year yield generally has trended higher over the course of May, starting the month at 4.2% and ending at 4.4% (as of this writing). Although the spread between the 10-year Treasury yield and 30-year mortgage rate remains unusually wide, the two are still highly correlated. In other words, when the 10-year yield moves in either direction, mortgage rates usually follow by a similar magnitude. The ascent in both interest rates recently reflect increasing odds of a new tax bill coming to fruition that would do little in terms of reducing the borrowing needs of the federal government and pared-back expectations for rates cuts from the Federal Reserve.
Stepping back, mortgage rates have oscillated over the past year, with rates dipping as low as 6.1% last fall alongside hopes that the Fed's 50 bps federal funds rate cut was the start of a significant monetary policy easing cycle. While an additional 50 bps of rate reductions were delivered over the remainder of the year, the Fed has paused so far in 2025 amid still-warm inflation and heightened economic policy uncertainty.
As a result, mortgage rates are back around 7%, not far off from the average rate registered during May 2024. The buoyancy on display in financing costs for home buyers is having predictable effects on housing activity. This week, the National Association of Realtors reported that pending home sales declined 6.3% in April, keeping the headline index near a low level, which is typically only observed during economic recessions. Overall, residential activity remains very tepid, largely due to severe affordability conditions brought on by higher mortgage rates.
For that reason, the Trump administration has prioritized lowering the 10-year Treasury yield and bringing down mortgage rates in order to improve housing affordability. Treasury Secretary Bessent has repeatedly stated that one of the goals of the administration is achieving lower mortgage rates for home buyers, and this need should not arrive only via easier monetary policy. It remains to been seen if federal government cutbacks and new revenues from tariffs will help lower the federal deficit and help long-term rates ease. Currently, however, mortgage rates are little changed over the past year, and the challenging affordability environment is still a significant constraint on home buying activity…
… Moving along TO a few other curated links from the intertubes, which I HOPE you’ll find useful …
Seventy-three percent of bonds in the world trade at a yield of less than 5%, see chart below. There is only beta in public credit markets, and with the total amount of public credit outstanding at $12 trillion and only $15 billion in dealer inventory, there is little liquidity in public credit markets, see charts below. Our latest credit market outlook is available here.
5. 5% May. "Here are the six times the S&P 500 gained at least 5% in May and what happened next. You can see stronger returns across the board and a year later up double digits five of six times."
… evil speculators and their POSITIONS — covering of shorts …
31 MAY 2025 Hedgopia CoT: Peek Into Future Through Futures, How Hedge Funds Are Positioned
Rosie’s weekly recap …
May 30, 2025, 4:02 PM Rosenberg Recap: More Labor Pains Than Meet The Eye
Chart of the Week More Labor Pains Than Meet The Eye The JOLTS data at least tell you what is happening to the engine under the hood. When you combine the job opening and hiring rates together, they show that labor demand has declined to such a low level that it is now tied for the weakest figure since April 2020 — when the economy was mired in the pandemic-lockdown recession. The combined rate, which is a proxy for labor demand, has dropped from 8.4% a year ago to 7.7% currently (the hiring rate on its own, at 3.4%, is now tied for the fourth lowest level since October 2013).
But headline payrolls data have yet to decline, and that is because the layoff rate has remained depressed at 1.0% — as companies, filled with the horrible labor supply-demand mismatch of 2021 and 2022, continue to hoard labor. At the current hiring rate, that firing rate would have to approach 1.3% before net job losses come to the fore. Until that happens, the markets will continue to behave as if a recession is far from being a base-case scenario.
… play nice this weekend in the sandbox …
May 30, 2025 sandbox: Inflation knocking at the Fed’s doorstep, plus weekend sprinkles
…This morning, we received the Fed’s preferred measure on inflation, the Personal Consumption Expenditures (PCE) Price Index.
The good news is continued moderation in price changes, with the headline number showing just 2.1% growth year-on-year for April.
This report came in line as expected, with no surprises for a monthly surge in inflation. The audience caught the preview mid-month when the Consumer Price Index (CPI) came in soft as well.
The data offers a snapshot of the U.S. economy during a month when the Trump administration surprised investors announcing universal and reciprocal tariffs that roiled markets and caused outright panic.
Objectively speaking, both headline and core inflation rates are knocking on the doorstep of the Fed’s stated target of the 2% mandate.
The path of disinflation is complete, or is it…
Where is this one-time structural shift higher in inflation that economists are ringing alarm bells over?
The easy answer is it’s too early to detect any meaningful impact from tariffs…
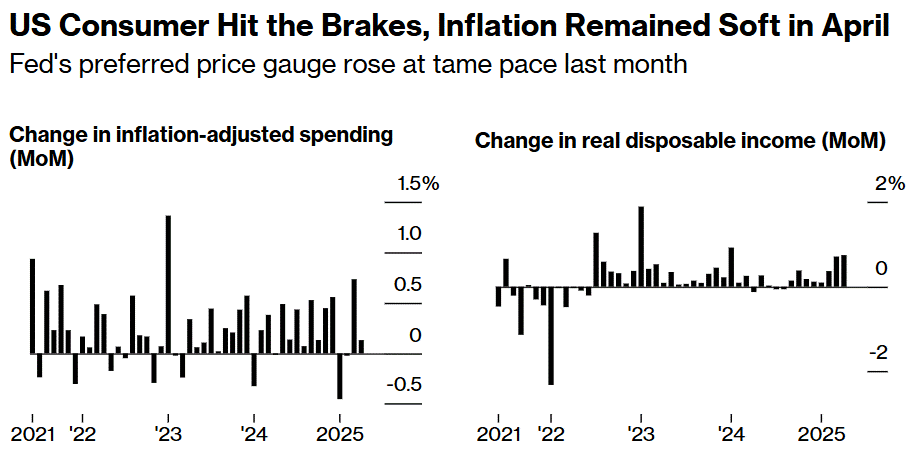
…Today we also received updated data on income and spending to shed further light on the consumer.
Wages rose by +0.8% in April, while consumer spending increased +0.2%. Higher incomes is welcome news for Americans, but softer spending doesn’t help growth unless those wages are spent.
As the personal savings rate ticks higher, consumers cutting back is a warning sign that caution is permeating into the collective consciousness. This jives with the various consumer sentiment surveys throughout 2025 that show historic levels of uncertainty and nervousness about the economy…
AND … ahead of this coming weeks NFP, a view …
May 31, 2025 Yahoo Morning Brief: The labor market is worse than than it appears
…Next week, the May jobs report is expected to bring more of the same headlines, as it's anticipated to show the US labor market added 130,000 jobs with the unemployment rate holding steady at 4.2%. More resiliency.
But the story of job hunting in America has been far more bifurcated, masked by these broad figures. Behind the solid headline numbers is a hiring rate hovering near a decade low. So too is the rate at which Americans are quitting their jobs…
…With the labor market stuck in neutral, the millions of students who walked off the campus quad for the final time this month are facing a challenging situation.
The three-month moving average of the unemployment rate for recent graduates aged 22 to 27 currently sits at roughly 5.3%, well above the national average of 4.2%, per Oxford Economics. As our Chart of the Week shows, this is a historic anomaly.
"It's a first sign of hitting a point where the labor market is at kind of a breaking point," Indeed economist Cory Stahle told Yahoo Finance. "Things overall are still solid, but the fact that we're seeing pockets like these younger workers starting to get hit harder is clearly very concerning."…
… AND for any / all (still)interested in trying to plan your trades and trade your plans in / around FUNduhMENTALs, here are a couple economic calendars and LINKS I used when I was closer to and IN ‘the game’.
First, this from the best in the strategy biz is a LINKthru TO this calendar,


")

")


https://rumble.com/v6tzyt7-brat-2-5282025-battleground.html
BRAT: Bond Market Misses The “Big Beautiful” Story Of President Trump’s Revenue And Tax Model
The Danielle DM-Booth video was good. Very informative....