(USTs mixed on light volumes)while WE slept; PBoC CUTS; REAL incomes fell; 'sticky prices' remained sticky (Atl FED); 2yy vs 55dMA and URATE to rise in 2024, so says McClellan (as he interprets data)
Good morning … we interrupt your regularly scheduled programming with a reminder that ALL IS WELL in China
RTRS (via CNBC): China cuts banks’ reserve ratio to aid recovery
The People’s Bank of China (PBOC) said it would cut the reserve requirement ratio (RRR) for all banks, except those that have implemented a 5% reserve ratio, by 25 basis points from Sept. 15.
The move came after the world’s second-biggest economy has struggled after its post-pandemic recovery faltered.
And while PBoC is interesting and funTERTaining and all, inflation data set tone yesterday AND remains a rather large input / talking point ahead of this mornings ECB meeting (and sourced changes leading to increase chances for HIKE) and so, a few bullets / links…
… Core services ex-shelter came in at 0.532% from 0.221% in July (highest since Sep. 2022) while core-CPI services ex-rent/OER was 0.366% versus 0.195% prior .. Within the details we saw OER decelerate to 0.4% from 0.5%, used cars and trucks dropped -1.2% on top of last month's -1.3% decline, and airfares rose 4.9% after July's -8.1% drop. Taken together, while the read surprised on the upside, we'll argue the 0.278% MoM core print was close enough to what the market was looking for that the data represents more of the passing of an event risk rather than a macro game changer … The Fed won't be hiking next week, but particularly given the strength in supercore, November is still very much a "live" rate decision.
CalculatedRISK- BLS: CPI increased 0.6% in August; Core CPI increased 0.3% CalculatedRISK - YoY Measures of Inflation: Services, Goods and Shelter WolfST - The Acceleration of Inflation in the Second Half Has Begun, “Disinflation” Honeymoon Terminated ZH - US CPI Surges More Than Expected In August As Gas Prices Soar
More from Global Wall Street (victory laps, etc) below … I will insert one final LINK first,
FRB Atlanta - Atlanta Fed's Sticky-Price CPI Remained Elevated in August - September 13, 2023
Latest update: 4.7 percent — September 13, 2023 The Atlanta Fed's sticky-price consumer price index (CPI)—a weighted basket of items that change price relatively slowly—increased 4.7 percent (on an annualized basis) in August, following a 3.1 percent increase in July. On a year-over-year basis, the series is up 5.3 percent.
On a core basis (excluding food and energy), the sticky-price index increased 4.8 percent (annualized) in August, and its 12-month change was 5.2 percent.
The flexible cut of the CPI—a weighted basket of items that change price relatively frequently—increased 18.4 percent (annualized) in August and is up 0.4 percent on a year-over-year basis.
Initial reaction was for selloff (ie CONCESSION) but then, after that, a bit of a stabilizing BID for bonds into the long bond auction …
ZH: Tailing 30Y Auction Prices At Highest Yield In 12 Years As Foreign Buyers Flee
… After one subpar 3Y auction, and one average 10Y auction, we closed out the week's coupon issuance with a 30Y auction that, like this morning's CPI, was mixed, with a solid bid to cover, offset by a modest tail, a big drop in indirect demand, and the highest yield in over 12 years…
… The internals were weaker, with foreign buyers awarded just 64.5%, the lowest since December 2021. And with Directs taking down 19.7%, or roughly in line with the recent average of 19.1%, Dealers were left holding 15.6%, the highest since February to cover the shortfall of foreign buyers who pulled back.
… here is a snapshot OF USTs as of 705a:
… HEREis what this shop says be behind the price action overnight…
… WHILE YOU SLEPT Treasuries are mixed and off earlier lows after the PBOC cut their RRR by 25bp while Gilts (see attachments and discussion) and Bunds outperform. DXY is little-changed while front WTI futures are higher (+1.3%). Asian stocks were mostly higher (NKY +1.4%, KOSDAQ +1.9%), EU and UK share markets are modestly higher too while ES futures are showing +0.4% here at 7am. Our overnight US rates flows saw a firm bid for 10yrs during Asian hours despite the upside surprise in Aussie employment (Aussie benchmark yields actually fell). In London's AM hours, the curve twisted stepper on long-end selling from fast$ names. Overnight Treasury volume was ~90% of average overall with solid (166% of ave) turnover seen in the just-auctioned 30yr.
… Our first attachment looks at how Treasury 2yr yields re-tested their March move high (~5.08%) again yesterday, rejecting it.
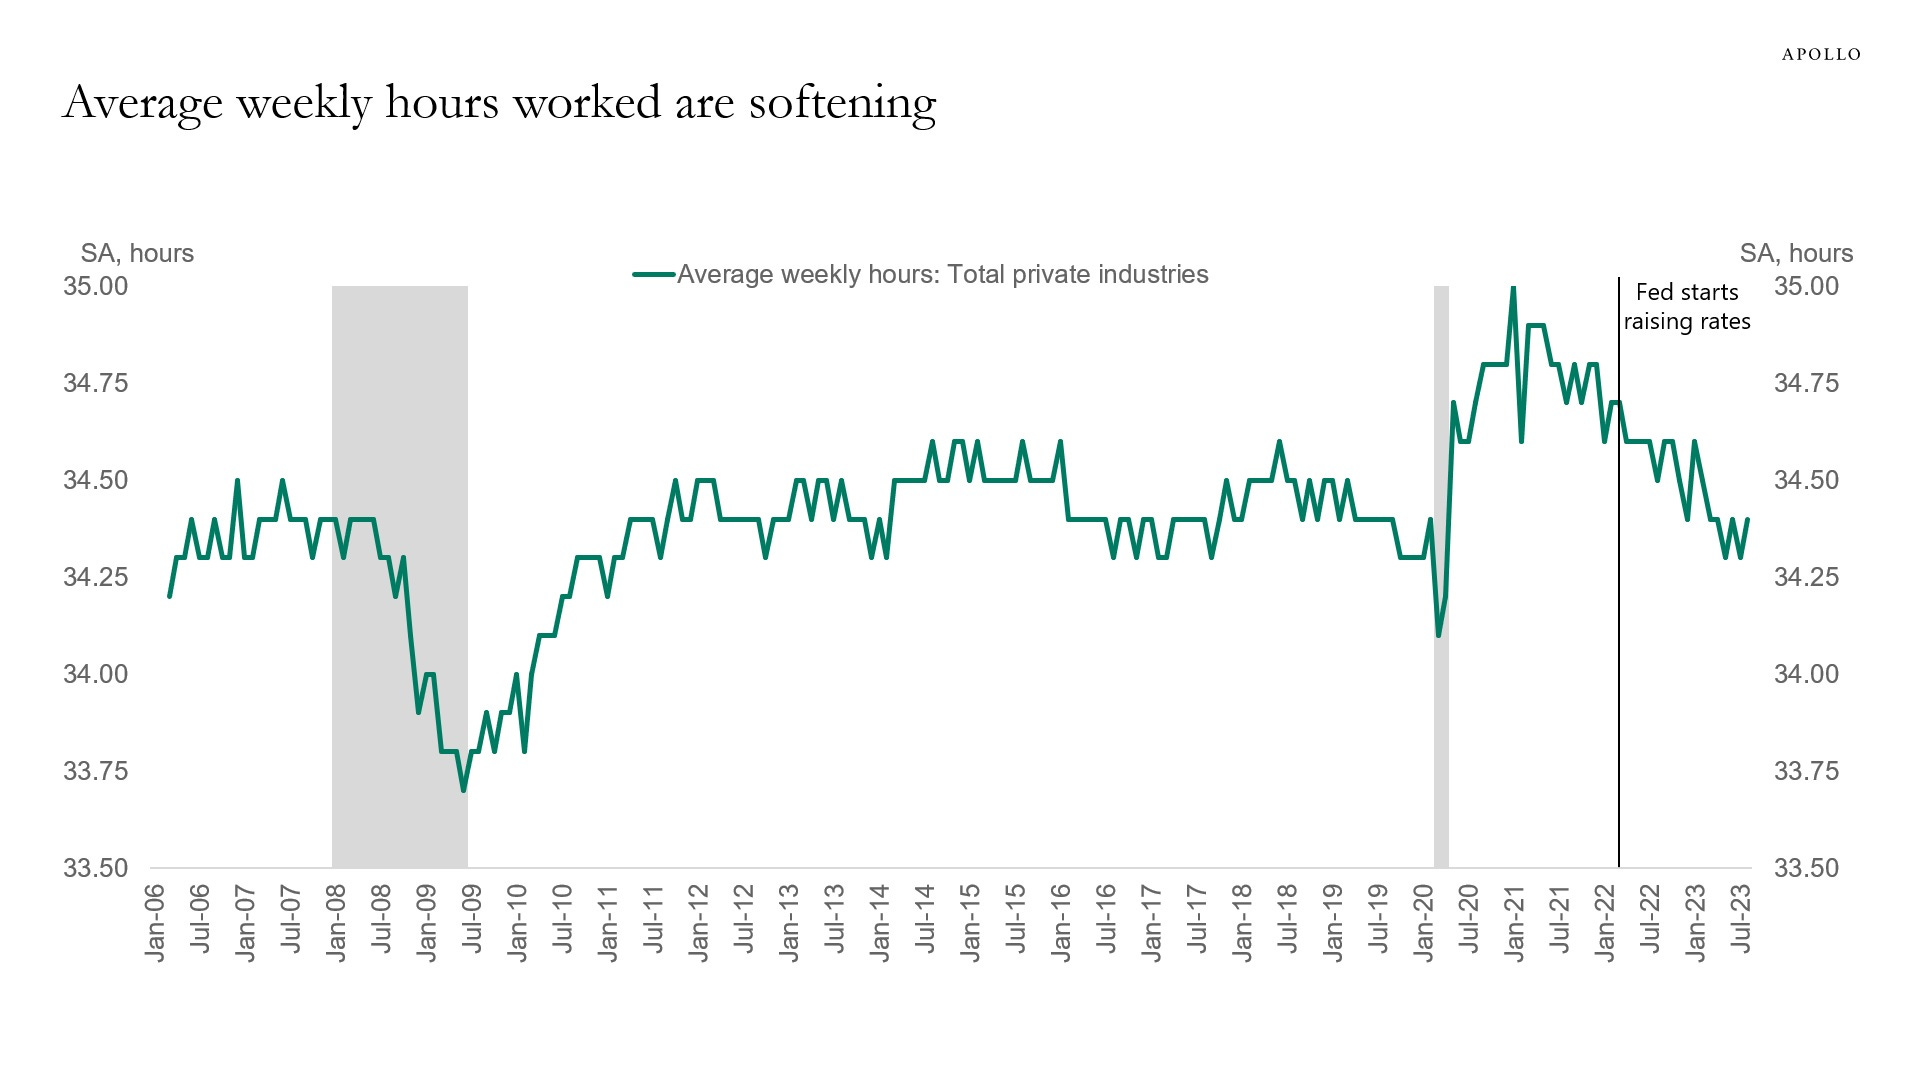
Headline inflation rebounded in August in the US, tracking the recent rise in oil prices. However, more important for the medium term inflation outlook is that wage pressures are easing, and the labour market is softening.
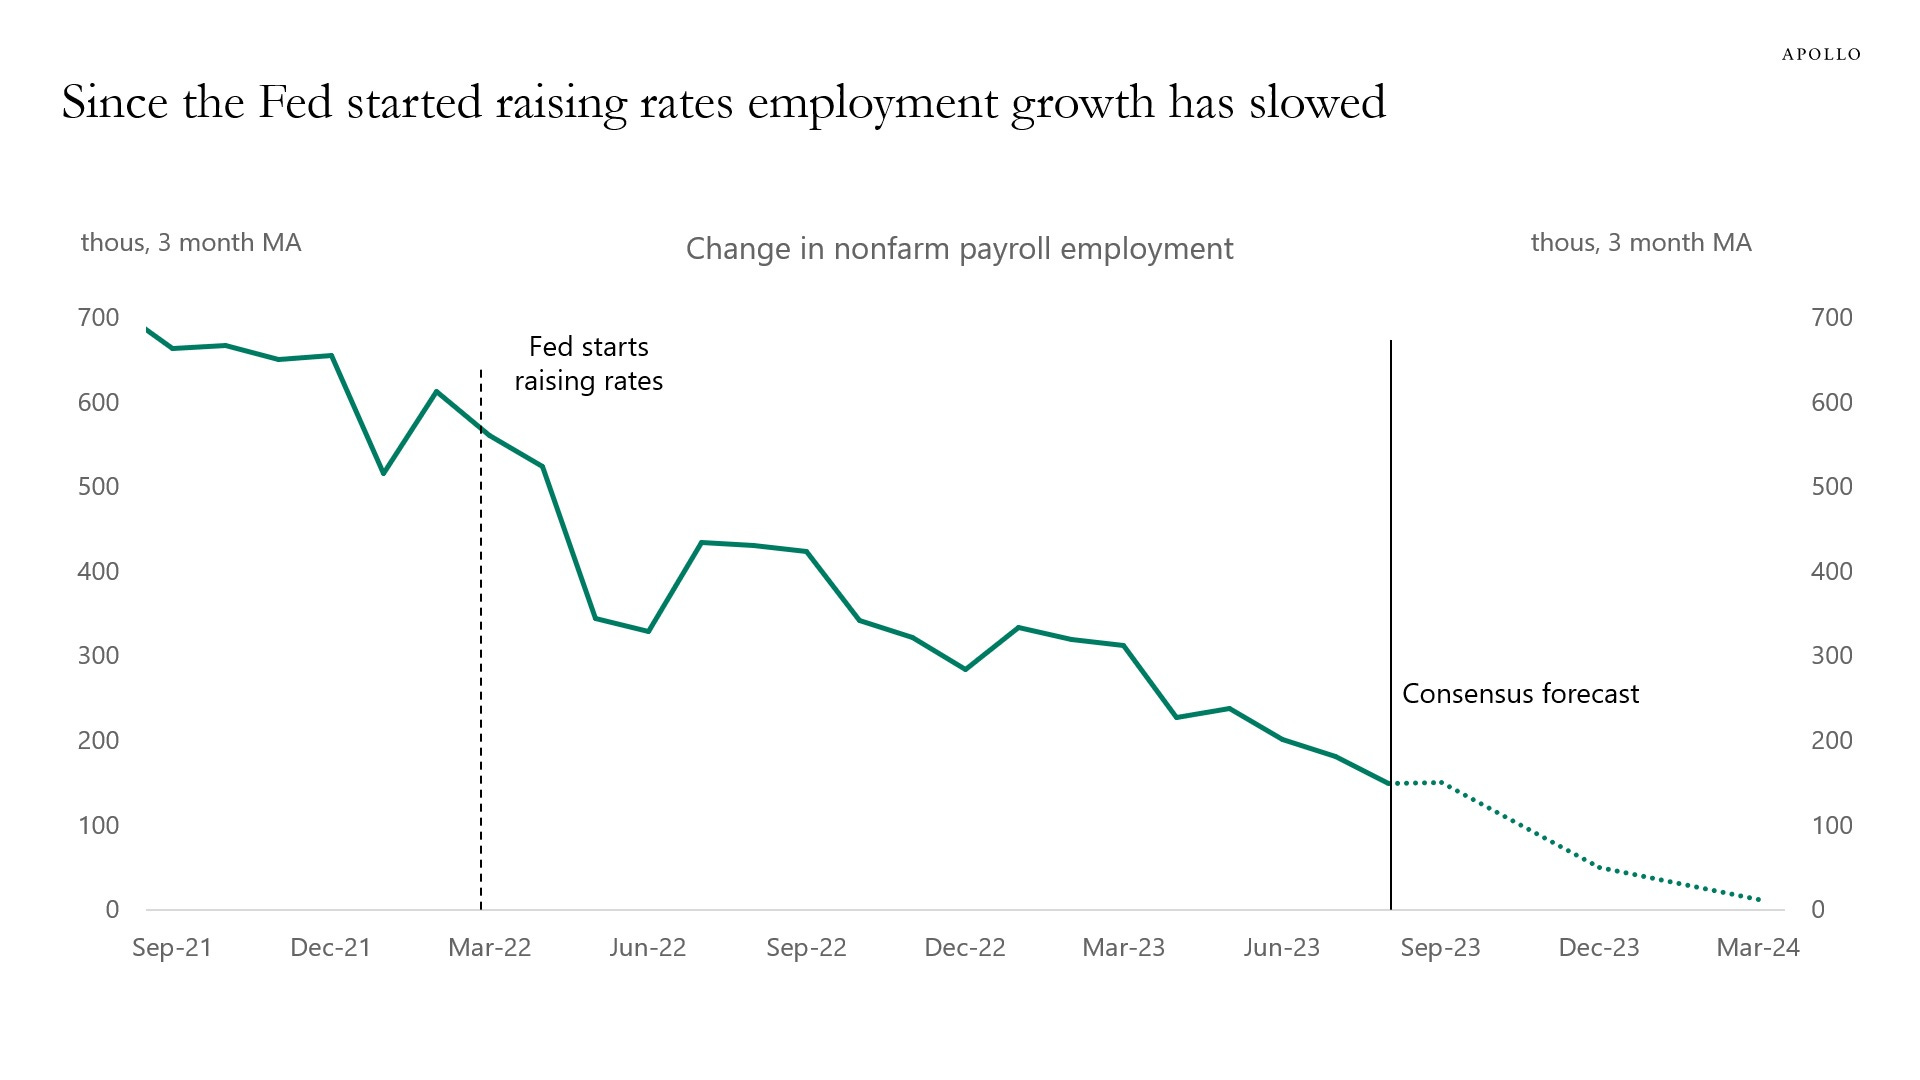
Apollo - What Comes After a Soft Landing? More Slowing(they say ALL OPINIONS are created equally and in reality we know some are just more equal than others … is Torsten one of those ‘chosen’ ones? YOU decide — I happen to like the visual story tellin’ that is going on here…and whether I agree or NOT is besides the point although, i’ll say that based on the CPI i’d think HIGHER FOR LONGER and maybe rates staying higher for longer will be part of what slows economy down … ?)
Since the Fed started raising interest rates, the labor market has gradually softened.
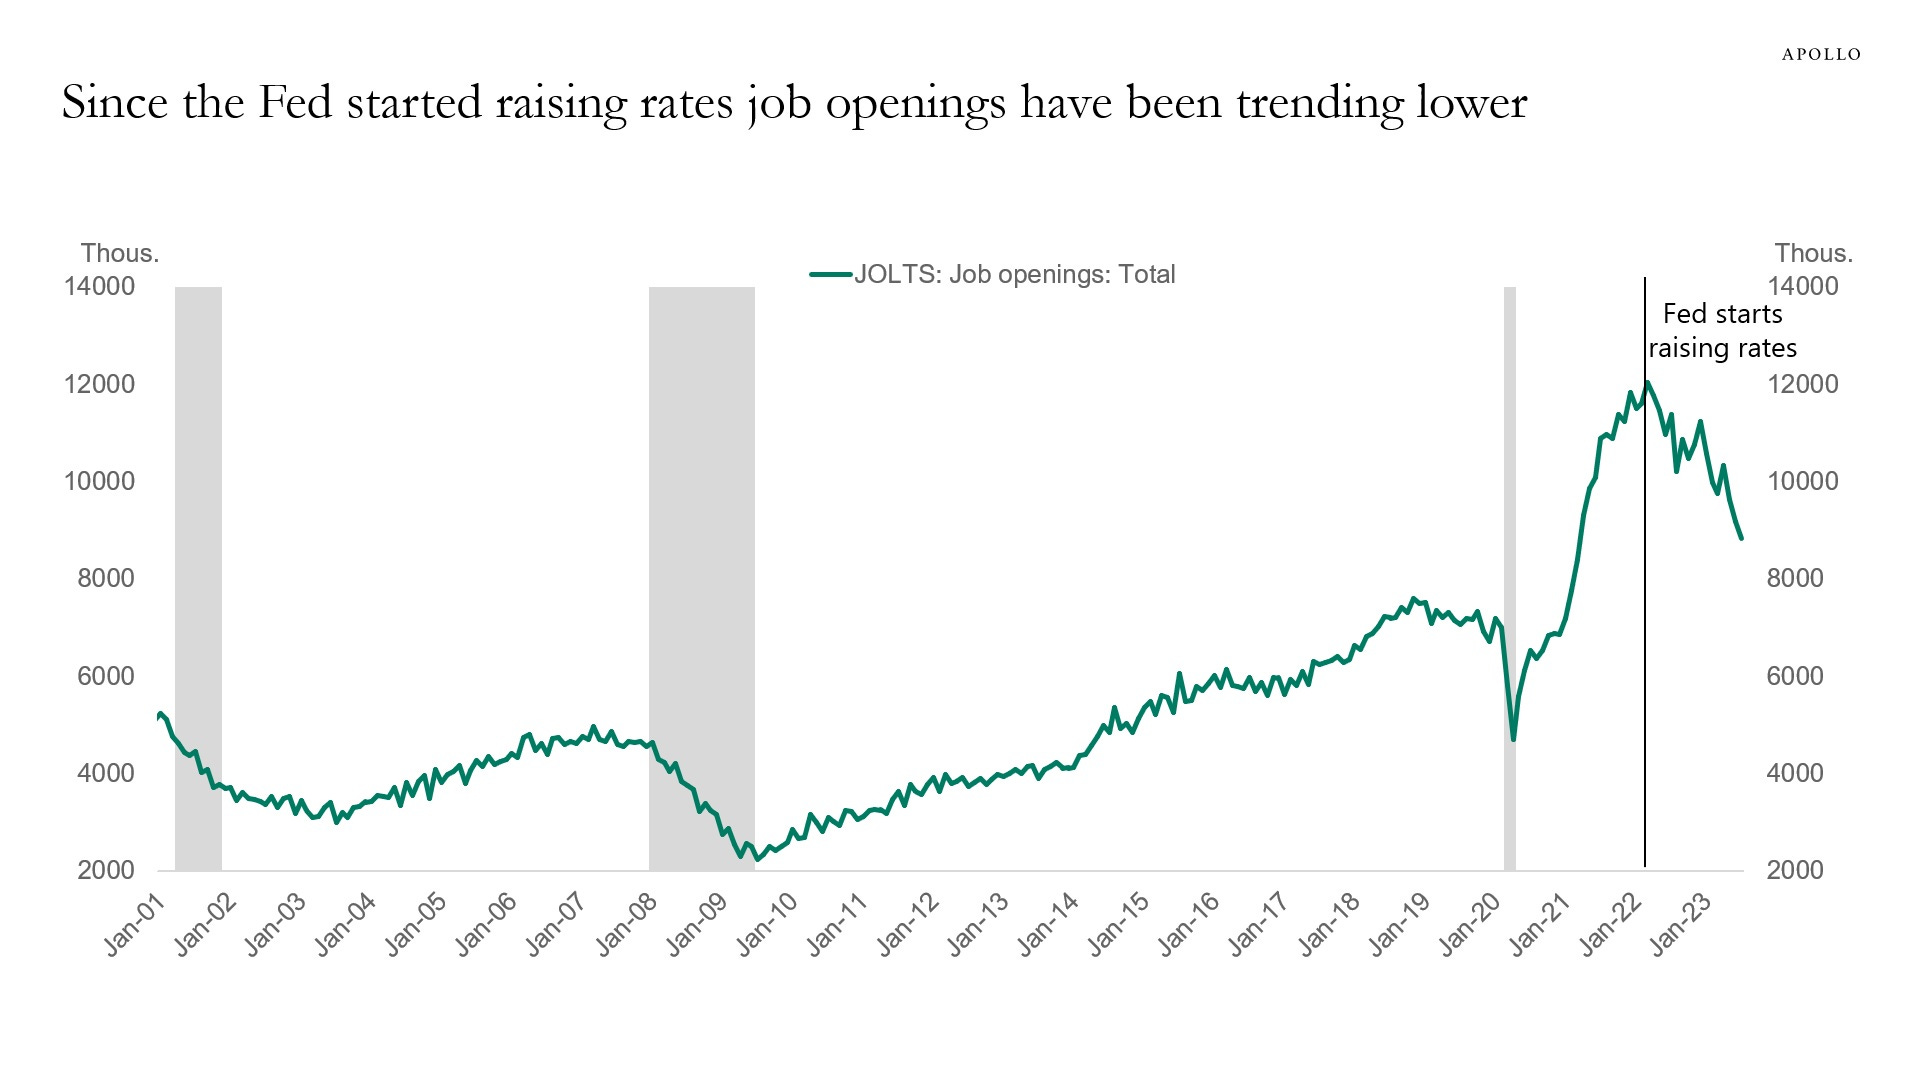
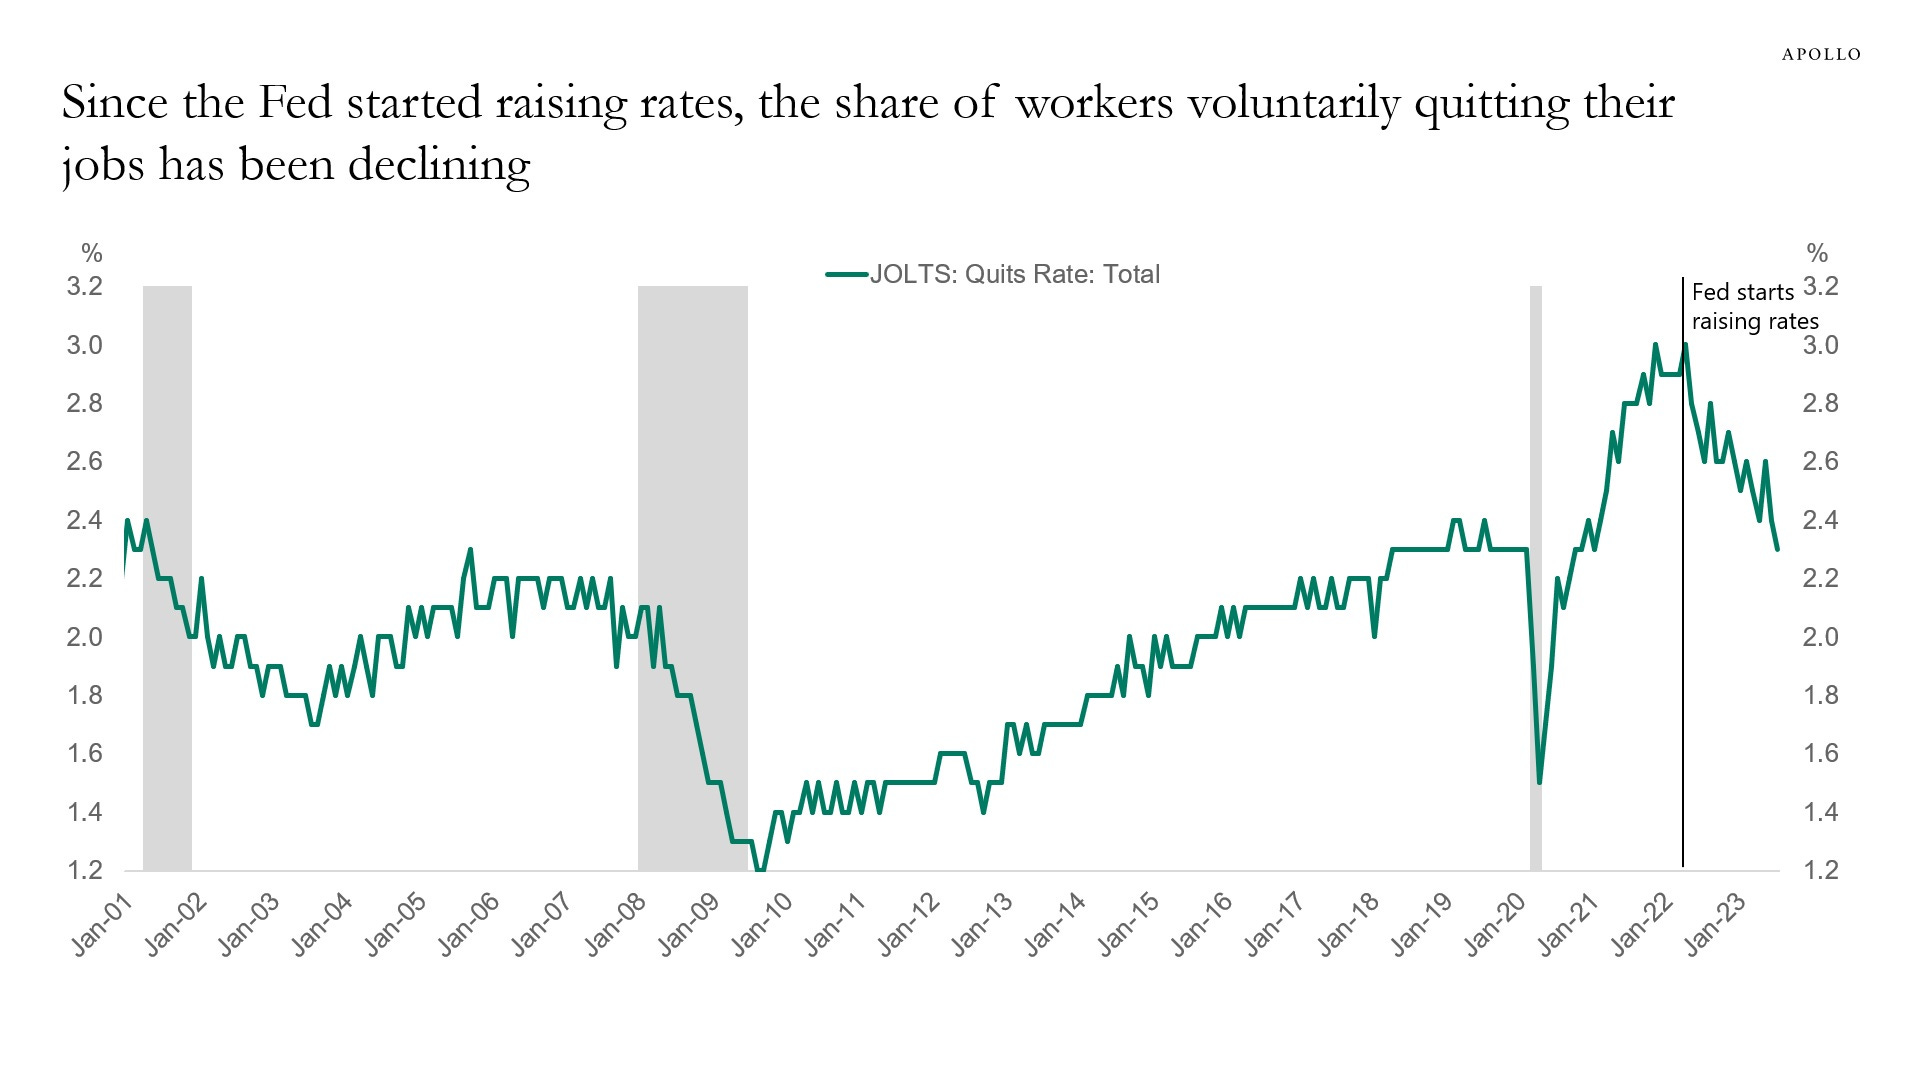
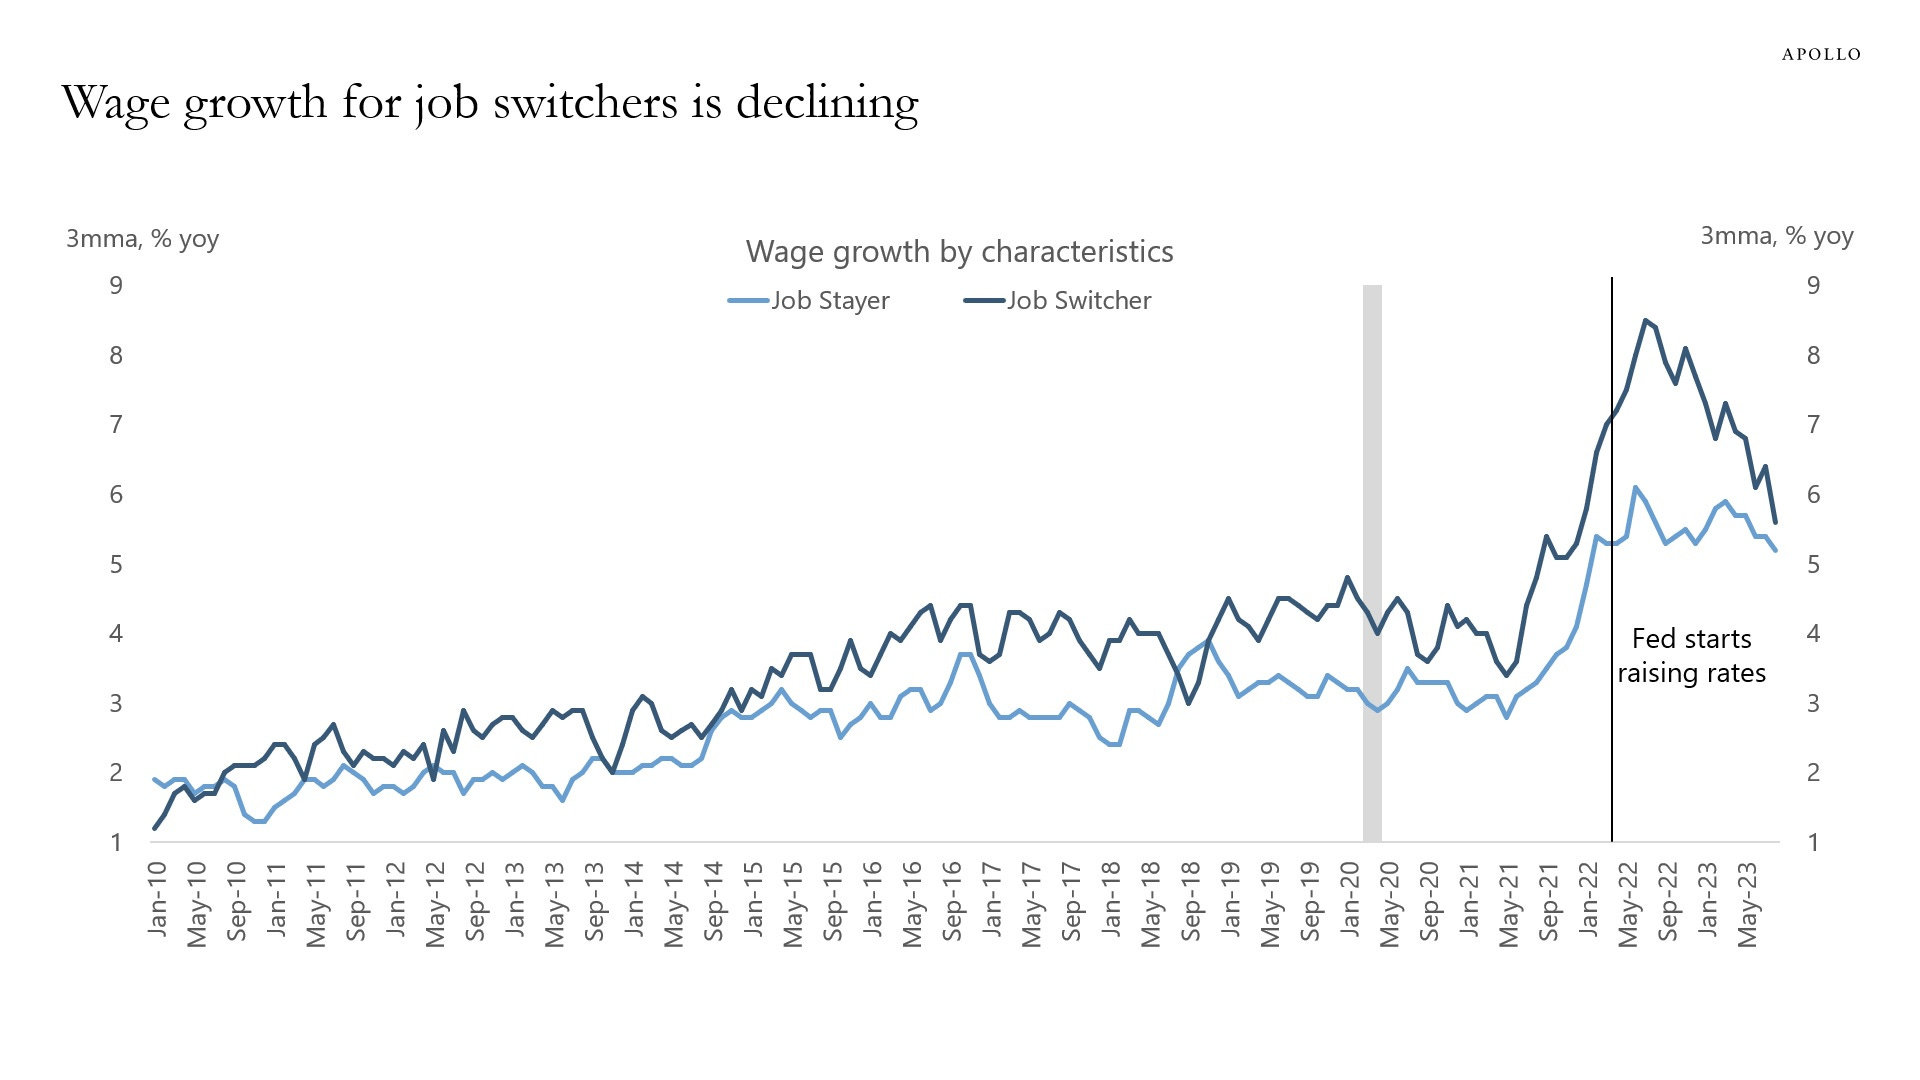
Specifically, employment growth is slowing, there are fewer job openings, the work week is shorter, the quits rate is lower, and wage growth is declining for job switchers, see charts below.
With the Fed keeping interest rates at these high levels for another nine months, it is unlikely that the lines in these charts will suddenly start moving sideways.
The likely scenario is that the trends in these charts continue. In short, more weakness in the economic data is coming as Fed hikes bite harder and harder on consumers and firms.
Bottom line: FMS investor sentiment no longer extreme bearish (17-month high in global equity allocation), but not yet bullish (FMS cash level up to 4.9%); more dramatic shift in relative exposure: record jump in US, record fall in EM equities as China growth optimism slumps back to "lockdown lows"; BofA Bull & Bull Indicator up to 4.1…
… On Macro: net -53% pessimistic on global growth but just 21% say hard landing & 27% expect no recession at all; more notable inflation expectations jump to highest since May'22…sticky inflation/hawkish central banks still seen as biggest "tail risk" (40%).
… The biggest tail risks in the Sep’23 FMS:
High inflation keeps central banks hawkish 40%
Barclays - August CPI: Fueled Up (get sense global wall street seeing this data point as mainly driven by FUEL and is not worried… but then, ‘supercore’?)
Energy costs fueled headline inflation, while overall core inflation accelerated amid a slight uptick in core services inflation and an upside surprise to core goods inflation. On balance, the report adds to evidence that disinflation is proceeding at a more gradual and less widespread pace.
… The "supercore" measures of inflation re-accelerated in August as anticipated. Our PCE-equivalent measure of core services CPI ex-housing rose 0.36% m/m (from 0.19%), and is running at a 3mma pace of 0.2% m/m, in line with its pre-pandemic norm, aided by the weak June and July readings. Given the distortion caused by health insurance CPI this past year, we prefer to look at our CPI supercore ex-health insurance measure, which edged up to 0.44% m/m (from 0.28%), and is running at 0.3% m/m on a 3mma basis, about a tenth higher than its pre-pandemic average.
However, looking past airfares and lodging away from home, supercore CPI measures have yet to register a meaningful slowing in price pressures…
…We maintain our call for a pause at the upcoming September FOMC meeting and continue to expect one more 25bp rate hike by year-end.
Bespoke Daily - Real Income Falls (but wait, I thought BIDENOMICS was working — said in my best WHISPER voice, leaning in to a mic…)
Yesterday, the US Census released its annual Social & Economic Supplement (ASEC) detailing income, poverty, and health insurance in the United States. We did a deep dive on the data in a report we published last night that you can read with an All Access trial, but below is a complimentary look at a snippet of it.
Starting with income, median real money income fell for a third straight year, declining 2.3% for the largest drop since 2010; that drop was almost entirely due to inflation, although the end of pandemic-era fiscal stimulus also played a role.
While income fell for almost all parts of the income distribution, we note that the lowest income households in the first decile saw 1.2% YoY real income growth; that compares to real income declines of 5.5% at the 90th percentile.
Simply put, lower income consumers experienced more rapid wage growth than the already stiff increase in inflation, while higher-income households were less resilient relative to inflation; that drove down measures of inequality…
… Finally, the Fed has been giving prominence to a measure it dubs the “Super-Core” — services (which are driven by wage increases and thus should be susceptible to tighter money) excluding shelter. After falling rapidly earlier this year, that measure has now stalled. On a month-on-month basis (which is prone to volatility), it even ticked upward in August:
The sum total for Fed expectations was to remove a hike this month from the equation. The fed funds futures market currently weighs that as about a 2.3% possibility. But this was already seen as unlikely, so there was little need to trade anything on the back of it. The CPI didn’t do anything to shift longer-term expectations, either. According to fed funds futures, the rate will be at about 4.3% come January 2025, much where it started the week. That implies only a net four 25-basis-point cuts between now and then.
Netting everything out, this report was a little disappointing, but didn’t come as any major surprise, and gave nobody much reason to change their positions. Louis Navellier of Navellier & Associates summed the reasons for this as follows:
There’s been no change in the expectation that the Fed will not increase a week from today. If anything, the market seems to be relieved that the bonds are not trading down, as it’s pretty clear that getting inflation down to the Fed’s 2% target is going to be tough sledding.
There’s plenty to concern us in the latest CPI numbers, then. But nothing that changes what we originally thought. It’s encouraging that the market could take it so calmly.
While US CPI inflation accelerated in August following softer prints in June and July, the latest data is still good enough for a pause at the coming September FOMC meeting, in our view.
Energy-driven airfare prices were the key driver behind the core CPI acceleration after dragging it down in the prior two months. The three-month average pace of core inflation stood at 0.2%.
We think Fed officials will likely look through the energy-related bounce, even as this risks amplifying inflation expectations in the coming months. To put any rate cuts on the horizon, underlying non-housing services inflation needs to indicate a sizable improvement, which we do not anticipate.
Preliminary September forecast: 0.3% m/m headline and core, as stickier non-housing service inflation counters continuing moderation in shelter inflation.
… On a three-month annualized basis, core CPI inflation posted 2.4%, very close to pre-pandemic trends and a rate effectively consistent with PCE inflation at the 2% target, given the CPI’s tendency to outrun PCE inflation by about 0.2-0.3pp…
Bloomberg BNP - US September FOMC preview: ‘Watchful waiting’ may join ‘keeping at it’ (hawkish hold, Fed’s DONE)
KEY MESSAGES
We expect a hawkish hold from the Fed at the September FOMC meeting, with rates kept unchanged but a bias toward further tightening signalled by the dot plot.
We look for the updated dot plot to flirt with the prospect of one more 25bp hike in 2023 and continue to imply 100bp of cuts in 2024. Estimates of the long-run neutral rate may also edge higher.
We see the Fed boosting its growth outlook and lowering its inflation forecast, though we estimate the latter will still end up too high versus realized inflation, ultimately giving the Fed an off ramp from further hikes.
In our view, incoming data showing flagging momentum will preclude the need to hike again this year. We expect weaker activity as economic buffers - including excess savings – erode, enhancing the lagged effects of prior tightening.
Implied US equity volatility is low, but not necessarily cheap. We made that point ahead of the Q2 earnings season. Since then, despite a 5% spot correction through mid-August, realized volatility has remained depressed. The beta of VIX spot to SPX spot is also still stubbornly low.
Using almost any historical window, implieds are low. 1m SPX vol is at the 14th percentile of a 2-year range, and 33rd percentile of a 20-year range. However, prolonged periods of low volatility are not that unusual. The current regime looks very similar to the 2-year period after Volmageddon but before Covid. This Goldilocks implied environment is consistent with the current recent low realized regime (3m RV at 10.5), but at odds with our macro outlook.
Our trade ideas for year-end split into three buckets: trades for a low volatility regime, recessionary trades and relative value ideas. We are cautious on equities exposed to a consumer slowdown and the impact of higher rates for longer, Consumer Discretionary and Small & Midcaps. Our ideas target low premium trades with payouts that perform well if we do get the downshift in macro data, which our US economics team are forecasting, into year-end.
FX reserves were accumulated during the '00s amidst increased globalisation. This trend was reflected in growing current account imbalances and lower term premia in bond markets, a.k.a the bond market conundrum.
Since the GFC, global imbalances have reduced as Asian economies contributed more substantially to global demand. This trend has continued post-Covid with the IMF expecting global imbalances in 2024 to be back at levels last seen in 2003.
Together with central banks shifting from QE to QT (with the BoJ set to join the party next year), a likely increase in the neutral rate and a less benign inflation environment, the catalysts for a further increase in global term premia remain in place for now.
FirstTrust - The Consumer Price Index (CPI) Rose 0.6% in August (MY personal love / hate relationship continues here and frankly, don’t know the guy — never did — i just hate stoopid no matter source … to ME what group saying here / now is more than reasonable and understood … agree or NOT with his message, this 1pg’r makes sense to ME … )
Implications: The Federal Reserve may have gained some traction against inflation, but the inflation problem is far from finished…No matter which way you cut it, inflation remains nowhere close to where the Fed wants it to be. Couple that with a resilient US labor market, Powell and Co. still have plenty of reason to keep monetary policy tight in the months to come. The worst part of today’s report was that real average hourly earnings declined 0.5% in August, taking a large bite out of consumer spending power. We continue to believe a recession is on the way. Equity investors should remain vigilant as we navigate these unprecedented times.
Goldilocks - USA: Monthly Core Inflation Picks Up but Year-on-Year Rate Falls to 4.3% (ink-blot test here continues — see what / how you wanna see it…seems to ME all agree a Sep SKIP BUTT … there’s always that big 'ole butt…)
BOTTOM LINE: August core CPI rose by 0.28%—a three-month high and 8bp above consensus expectations—but the year-on-year rate nonetheless fell four tenths to 4.3%. The composition was firm on net: while the volatile airfares category contributed +3bp to the core, the more-persistent rent, healthcare, and car insurance categories were stronger than we expected. Our measure of trimmed core inflation picked up only marginally, at 0.30% in August compared to 0.29% in July. While somewhat above consensus, we do not expect today’s report to affect the outcome of the September FOMC meeting—for which we expect unchanged policy—and we continue to believe that the FOMC will view a final hike at the November meeting as unnecessary.
■ The August CPI rose 0.6% (+0.631% unrounded) with core up 0.3% m/m (+0.278% unrounded). The headline came in on-consensus, but the core was slightly firmer than expected. ■ Despite the upside surprise in the core, we do not think that there is enough evidence here to push the Fed toward another rate hike next week. The totality of the employment and inflation data, along with an expectation that this month's upward pressure in energy prices will not persist, should give policymakers confidence that rates are already sufficiently restrictive. ■ Within the details, there aren't too many surprises. Shelter costs remain firm, used car and computer prices continue to drag down core commodities, and core service prices ex-housing remain sticky. Modest upside surprises in auto insurance, medical care commodities, and tobacco pushed the core just barely high enough to round up to 0.3%.
Highlights from the August Consumer Price Index (CPI) Report:
The rise in gas prices accounted for over half of the increase in consumer inflation but will not likely contribute in the same way next month.
Prices for hotels, used vehicles, and recreation all declined in August.
The decline in prices for lodging away from home could indicate consumer demand is starting to wane on travel-related services.
Consumer inflation excluding housing was up 1.9% from a year ago, illustrating that one nagging component to inflation is shelter.
Bottom Line: Markets will likely look past the rise in headline inflation since the largest contributor will not likely be a main factor next month. Core inflation rose 4.3% from a year ago and will continue to decelerate as rent prices are expected to slow in the coming months. Yields on the 2-year Treasury are trading below yesterday’s close, indicating that markets are taking the latest inflation report in stride as the Federal Reserve (Fed) is expected to keep rates unchanged at its upcoming meeting.
The consumer price index (CPI) for August came in above expectations. Core CPI increased 0.28%M (MSe 0.18%, consensus 0.2%), with stronger than expected core goods and upside on airfares, but further slowing in shelter. Headline increased 0.63%M (MSe at 0.61%, consensus 0.6%), driven by higher energy prices. On a YoY basis, headline inflation rose from 3.2% to 3.7%, while core inflation moderated from 4.7% to 4.3%. On a 3-month annualized rate, core CPI moderated from 3.1% to 2.4% in August.
… Incorporating inputs from CPI, we preliminarily forecast core PCE inflation increased 0.15%M in August vs. 0.22% in July, while headline is forecasted at 0.39%M vs. 0.21% prior. Core services ex housing translation points to 0.16%M in August vs. 0.46%M prior, lower than CPI given higher airfares in the CPI print. We will finalize our forecast tomorrow with the release of PPI for August.
…Bottom line: Looking through the pick-up in headline CPI in August, underlying inflation pressures remained relatively muted in the U.S. That’s contrasting stronger data on consumer spending which raised doubt on whether low inflation rates over the summer can be sustained over the longer-run. The Fed won’t hesitate to raise the Fed Funds range higher from 5.25% - 5%, if price pressures were to reaccelerate. But already-low core inflation readings and signs of deteriorating labour market conditions (lower job openings and a tick higher in the unemployment rate in August) should give them plenty of space for the Fed to opt for a pause again next week, returning to the “stop and go” pace while waiting for more weaknesses in economic data to come through. We continue to point to headwinds like a near-depleted excess savings pocket, and the restart of the student debt repayment in October for our expectations that consumer spending will start to slow very soon, and for that to keep inflation low and steady at current levels and the Fed on the sidelines through the rest of the year.
UBS (Paul Donovan) - The ECB autopilot (the part on ReSale TALES caught my eyes)
… US retail sales headline numbers will be supported by higher energy prices (this is a value measure), and that may divert money away from other areas of consumption. Middle-income consumers do have better spending power than may first appear—yesterday’s consumer price data suggests that home owners face an inflation rate that is probably below 2% y/y because the fiction of owners’ equivalent rent does not actually affect reality.
Producer price inflation in the US is mercifully unaffected by owners’ equivalent rent, and so comes closer to price reality further up the supply chain. As with the consumer data, oil prices will likely push up the headline, while the core inflation rate continues to slow.
Wells Fargo - August CPI: Turbulence on Inflation's Descent (3mo annualized … if we all had a dime for every time we were focused on this, we’d all be rich — would that then be INFLATIONARY?)
The largest increase in consumer prices since June of last year was a reminder that inflation's ride back to the Fed's target was always going to be bumpy. The Consumer Price Index rose 0.6% in August, pushing the year-over-year rate of CPI up to 3.7%. Although a significant slice of August's gain can be traced to a surge in gasoline prices, price growth for items excluding food and energy picked up a bit in August, with the core index rising 0.3%.
Despite stronger monthly gains in the headline and core CPI in August, the trend in inflation has downshifted since the spring. The core CPI has slowed to 4.4% year-overyear, with the three month annualized rate of 2.4% showing momentum has slowed further in recent months. We expect the recent downshift will keep the Fed on hold for the foreseeable future, but with price growth still running in excess of 2%, rate cuts remain some ways out.
Finally a few links for us visual learners (as if Apollo just above not enough :))
US 2yr Yields: We posted a bearish outside day on Wednesday, off resistance at 5.08%. This suggests short term downside for US 2y yields.
What is the next level to watch? 55-day MA at 4.89% remains the key level for us, having tested it twice in August-September.
A 55-200 day MA setup would also be in play, IF we close below that level (preferably on a weekly basis). IF this setup materializes, it suggests extended downside for 2yr yields, though we see support first at 4.7536% (September 1st low).
Side note: We also posted bearish outside days in US 5s, 10s and 30s yields.
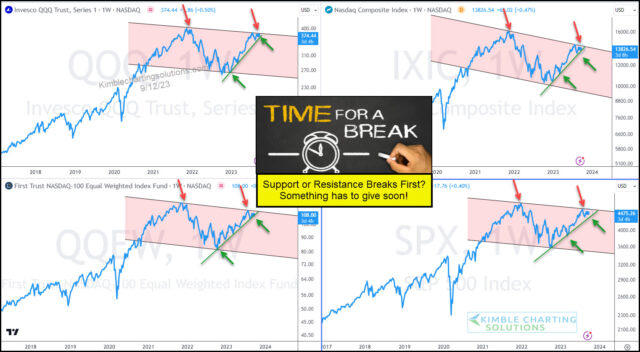
Without a doubt, technology stocks are the leader within global stock markets and the global economy. So when the technology sector nears a major trend decision point, investors and consumers should be watching!
And that is exactly what we have on display today, as several tech-related stock market indices are trading deep into narrowing patterns.
As you can see, these indices are trading higher (green arrows & line) within a down-trending channel (red arrows and shading). As such, price is being squeezed by overhead resistance and up-trend support.
There isn’t much wiggle room in play currently, so something (support or resistance) has to break soon.
And whichever way price breaks will bear importance for investors.
McClellan Financial - Unemployment to Rise into 2024 - Chart In Focus (if bad is good then this note / visual is AWESOME)
September 13, 2023
Back in March 2023, I wrote a piece here titled, "Three Signs Employment Is Going to Take a Hit". It looked at 3 different leading indication relationships that were all calling for a rise in the unemployment rate. This week's chart takes a closer look at one of those, the message from the inflation rate.
The key insight for understanding this relationship is that the plot of the CPI inflation rate has been shifted forward by 2 years to reveal how the unemployment rate tends to follow in the same footsteps after that lag time. This chart frustrates a lot of classical economists who believe what they were taught about the Phillips Curve, which hypothesizes that high unemployment leaves people with less money to spend, and so the economy slows which brings prices down, curing inflation. That is the operating philosophy of the Federal Reserve, and it is wrong.
The real relationship is that high inflation brings high unemployment, and low inflation leads to lower unemployment 2 years later. So if you were in charge of the economy, and wanted to ensure maximum employment, what you should do is somehow arrange for zero percent inflation, and then just wait two years.
There have been instances when this model did not work as well. The Covid Crash is an obvious example. That event, and the government's overwhelming stimulus response, broke a lot of economic models, and understandably so.
We can also see that the 2008-09 economic depression which followed the so-called "Great Financial Crisis" brought unemployment at a much higher rate than hinted at by this model. That came about because the Fed was overly aggressive in trying to undo the excesses of Greenspan's final years as Fed chairman, when he kept rates too low which fueled the housing bubble. The Congress piled on by mandating "mark to market" accounting of distressed assets, which had a positive feedback effect exacerbating the economic damage.
Even though the magnitude of the 2009 unemployment rate peak was higher than suggested, it did arrive on time according to this model, as did the economic recovery which matched the waning rate of inflation 2 years before.
Another interesting anomaly came in 2017, when this model said that the unemployment rate was supposed to have bottomed and turned upward, but instead it kept declining all the way to Feb. 2020 when the Covid Crash disrupted the nice correlation. The tax cuts which were implemented in 2017 arguably had a big effect on business confidence, allowing the unemployment rate to keep falling in spite of inflation's message, but at a cost of seeing the total federal debt rise by between $600 billion to $800 billion per year in 2017-2019. It rose a lot more in 2020 with all of the Covid spending.
Now in 2023, the CPI spike 2 years ago is saying that we should be expecting a rise in the unemployment rate, but it is slow in getting started. The latest numbers for August showed a rise to 3.8%, up off of the low of 3.4% in January 2023. The CPI inflation rate peaked at 9.1% in June 2022, and so if the 2-year lag time works perfectly then that would mean a peak for the unemployment rate in June 2024. You can bet that unemployment will be a big topic in the upcoming presidential debates ahead of the November 2024 election.
The unknown part of this is how much response we will see in the unemployment rate, which is thus far being slow to start its rise. The extra post-Covid stimulus may have been responsible for keeping companies full of cash to keep on their employees, albeit at a cost of having the total federal debt rise by more than $2 trillion versus a year before.
The latest CPI data just released on Sep. 13, 2023 showed CPI rising 3.7% versus a year ago. This is not good news for the future employment prospects 2 years from now, once the 2-year lag time goes by. The Federal Reserve is not even reaching its illegal mandate of 2% inflation, despite raising rates up so high that it has effectively killed the real estate market.
I am not speaking lightly when I say that the Fed's 2% inflation target is illegal. Most people, including Federal Reserve staffers, seem unaware that Congress passed an actual statute back in 1978 mandating that once the inflation rate got back down below 3%, then the Fed's inflation target rate would be "zero per centum".
Now admittedly, it is tough to expect the Fed to accomplish that using the limited tools it has, especially when Congress goes throwing around so much deficit spending to "help" the economy. In that circumstance, it is not the Fed's proper role to adjust its own target illegally to 2% (which it is still not meeting). If Congress is mandating a target that the Fed cannot meet because of Congress' own deficit spending, then the proper action is for the FOMC members to either ask Congress for a different target, or tell Congress that they cannot comply with that law and must resign. I don't expect that to happen any time soon.
But next time you hear anyone talking about "the Fed's 2% inflation target", please kindly inform such people that, by statute, the Fed's statutory target is actually zero. And if we could actually get inflation down to 0%, then that would be good for the jobs market, 2 years later.
Well you sure ended today's w/a real dozy-the 2% inflation target's Illegal. Maybe that Fed Wisper can give some column time to THAT topic. Not holding my breath. You're an incredible wealth of info there Steve!


Comprehensive summary...........
The Phillips Curve, the trade off between Inflation and Recession, is a long held belief.
But there are man periods of time where Economic Growth doesn't cause Inflation.
Productivity is an important factor.
I agree with your Conclusions, basically.
Not sure another 25 has any real significance....Fed should probably and let the Lags catch up.
Inflation is a more difficult problem than Employment.
The Fed can't control US Domestic Oil Production and Refining.
For that we have to look to the Biden Administration and see if they can muster any kind of
Coherent Energy Policy...........that's a big if....
We may a slowing of the Economy, but Bond Rates may not fall because of the Large Amount
of US Gov't Debt that the Biden Administration must sell...and it sounds like it might be a
Buyers Market....
33 Trillion in US Debt.....1.9 Trillion Annual Budget Deficits and 20% of the US Federal Budget in
2030, will be Interest Expense......That's the Road the Biden Admin has us on.
How does that look ???
Well you sure ended today's w/a real dozy-the 2% inflation target's Illegal. Maybe that Fed Wisper can give some column time to THAT topic. Not holding my breath. You're an incredible wealth of info there Steve!