(USTs lower, steeper on avg volumes) while WE slept; more (BAML) 'evidence' on basis trade; a revised ('higher for longer' -CA) rates forecast; an update from JPM, 'trimming duration'
Good morning … as dawn breaks on this side of the globe (eventually, once the storm here passes), we’re being greeted by an ECB SOURCES story from Reuters of a higher inflation profile in 2024 which would then lead one to think about (and price)an ECB HIKE tomorrow...
Reuters: ECB's crucial 2024 projection to put inflation above 3%, source says
… The European Central Bank expects inflation in the 20-nation euro zone to remain above 3% next year, bolstering the case for a tenth consecutive interest rate increase on Thursday, a source with direct knowledge of the discussion told Reuters on Tuesday …
So far, it seems to be a story which is contained, at least as far as markets go (and as far as I can tell with my now far more limited capacities).
Any push of yields higher, for whatever motivations, might be well received as a ‘concession’ into this afternoon’s long bond auction.
Yesterday’s 10yy was just ‘bout like Monday’s 3y …
ZH: 10Y Treasury Auction Prices On The Screws At Highest Yield Since Nov 2007
And while it may not be abundantly clear here / now that 10yy are a ‘screaming buy’, perhaps another leg higher will attract interest in duration from those in Team ‘screaming buy’ … Here' are a couple looks at long bonds
… in BOTH short as well as LONGer term context, you’ll note green lines bottom RIGHT — momentum is at / nearing overSOLD levels lending some sort of further credence TO bonds being at / near ‘screaming buy’ territory … but for now … here is a snapshot OF USTs as of 701a:
… HEREis what this shop says be behind the price action overnight…
… WHILE YOU SLEPT Treasuries are modestly lower with the curve steeper ahead of CPI. Bunds are under-performing (sources say ECB's 2024 inflation projection above 3%- see above) while Gilts have outperformed after a weak July GDP print earlier (link above). DXY is little changed while front WTI futures are higher (+0.65%, see attachments). Asian stocks were mostly lower, EU and UK share markets are all lower (SX5E -0.9%) while ES futures are showing -0.15% here at 6:45am. Our overnight US rates flows saw tepid volumes and little activity during Asian hours. In London's AM session, we've seen better paying interest in the belly while in cash, fast$ has been a seller of 10's (FV block sale mid-morning weighed as well). Overnight Treasury volume was about average overall with 10's and 30's seeing elevated turnover (~140% of ave) ahead of today's bond auction.
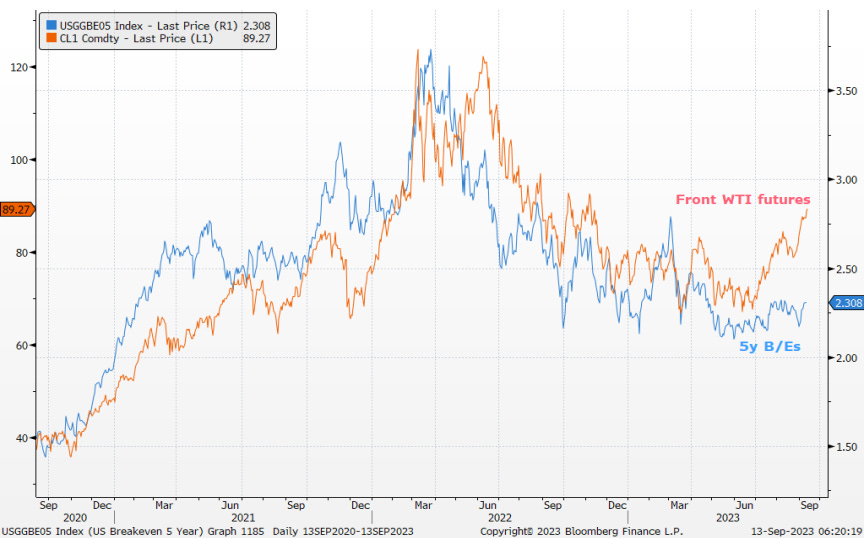
… So the 2.34 range hurdle remains a formidable one for 5y breaks but our next overlay of CL1 and 5y breaks (along with the monthly chart of CL1 just discussed) hints that more tests of resistance in 5y breaks may be likely up ahead? Finally, we wanted to add some charts of either Treasury curves or swaps spreads but persistent, rangebound conditions in each have left the set-ups distinctly un-interesting, at least to us. When we see something interesting, we'll say something.
Interesting visual / concept of BREAKS and EARL to consider ahead of CPI (with some more just below) … and for some MORE of the news you can use » The Morning Hark - 13 Sept 2023 and IGMs Press Picks (who CONTINUES to be sportin’ that new, fresh look) in effort to to help weed thru the noise (some of which can be found over here at Finviz).
From some of the news to some of THE VIEWS you might be able to use… here’s SOME of what Global Wall St is sayin’ …
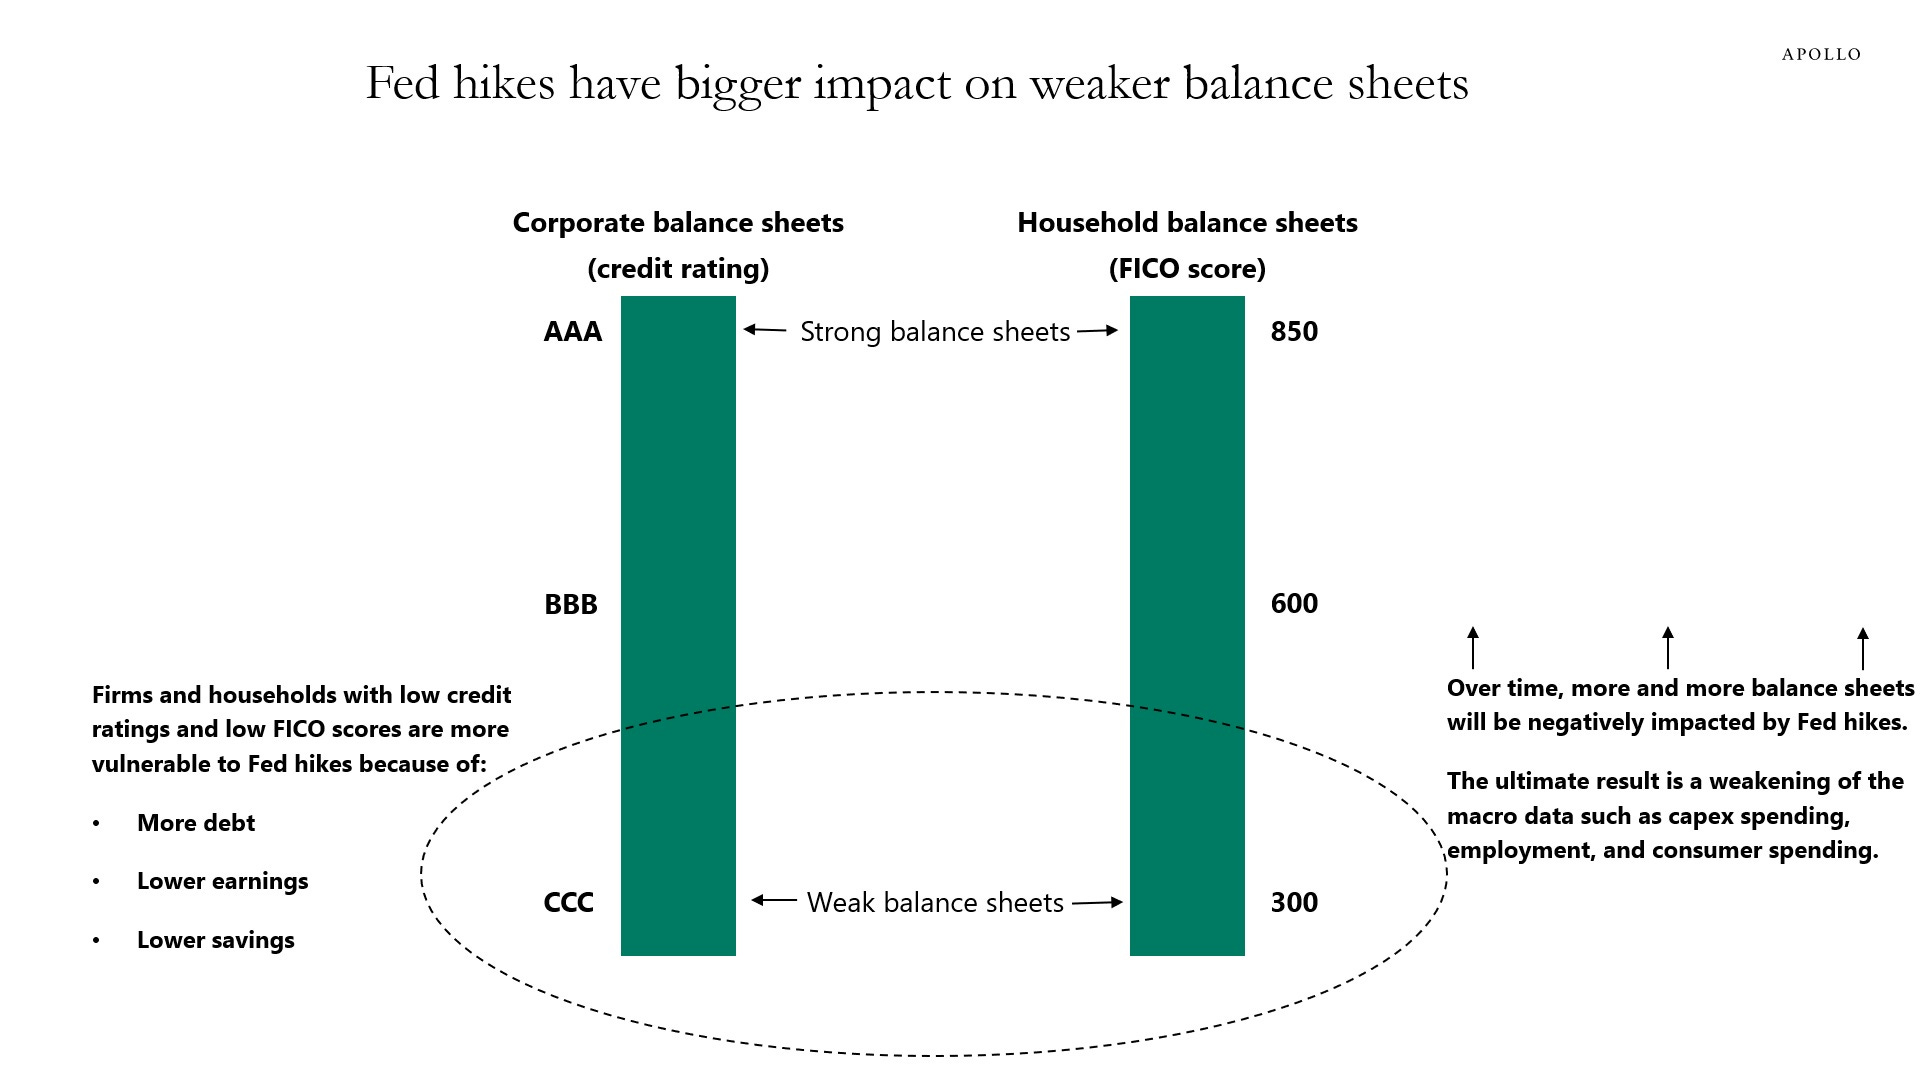
Balance sheets with higher debt, lower earnings, and lower savings will get hit first by Fed hikes, both for consumers and firms, see the first chart below. As this process continues, Fed hikes will gradually impact higher-quality balance sheets over time.
Once the Fed funds rate reaches sufficiently restrictive levels, the macro data will weaken. This is happening now: Delinquency and default rates are increasing for more vulnerable households and firms, and capex spending and nonfarm payrolls are weakening, see the second and third charts below.
This is how monetary policy works, and markets should expect the economic data to weaken further over the coming months as Fed hikes gradually bite harder and harder on consumers and firms.
Questioning the resilience of the foreign bid Flow of funds data for Q2 show the importance of foreign buyers in the market with banks selling and the Fed running down its balance sheet. Recently though, we see limited demand from foreign investors at auctions and net selling from official accounts. The “household” sector remains an important buyer filling in the gap. While some of this bid may reflect demand from individual households, it is also likely another indicator of the growing hedge fund basis trade as we discuss below.
…Q2 FoF shows household & foreign buying … The household sector increased US Treasury holdings by $170bn based on our estimates for valuation change in Q2. While part of this may reflect individual households allocating more to US Treasury securities, it also likely is another piece of evidence pointing to a growing basis trade in the market. As shown in Exhibit 19, household UST holdings previously peaked in mid-2019 with hedge fund UST holdings. As discussed in our report Back to basis, this was the same time that we saw the leveraged hedge fund futures short peak. Similar dynamics appear to be occurring now where hedge funds are seeing a growth in short futures positions alongside asset manager longs.
The US economy has remained resilient, despite aggressive Fed rate hikes since March 2022. As a result, we have revised up our Treasury yield forecast for the balance of 2023, with a 10Y year-end target at 4.00% instead of 3.75% in the prior forecast.
Other factors contributing to the upward revision to our forecast include rising Treasury supply, as well as fears of possibly declining foreign demand if the Bank of Japan makes further yield curve control adjustments.
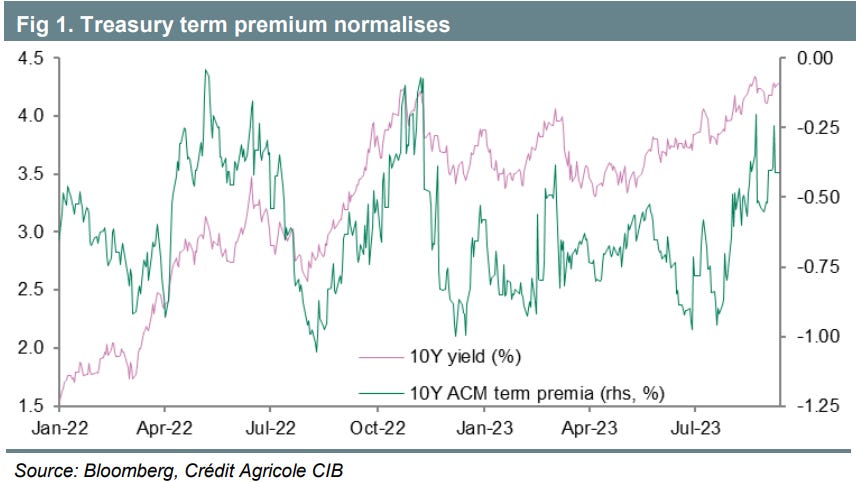
Treasury term premium has normalised amid rising yields, and is no longer depressed, now that the 10Y yield is north of 4.25%. Overall, the market seems to be trading on the long side, as rates look attractive on a historical basis…
… Only by the end of 2024 do we expect 10Y yields to reach 3.5% but the curve should stay modestly inverted, with 2-10Y towards -25bp at year-end (see Figure 6). For investors hurrying into steepening trades now, the negative carry over the next few quarters should not exceed our expected curve steepening, in our view
Goldilocks - US Daily: The Q4 Pothole: Student Loans, Shutdown, and Strikes (linin’ up the scapegoats…putting them in a context where they seem NOT so bad and so, SOFT landing = NO problemo)
Three developments are set to temporarily slow growth in Q4. First, we expect the resumption of student loan payments to subtract 0.5pp from quarterly annualized GDP growth. However, the risks lean toward a smaller effect, as some borrowers might not resume payments right away and some are likely to qualify for the Biden Administration’s income-based repayment plan.
Second, the federal government looks more likely than not to temporarily shut down. A government-wide shutdown would reduce quarterly annualized growth by around 0.2pp for each week it lasted after accounting for modest private sector effects. Our baseline is that a shutdown could last for 2-3 weeks, although a shutdown is not a foregone conclusion and the timing is uncertain.
Third, we estimate that reduced auto production from a potential UAW strike would reduce quarterly annualized growth by 0.05-0.10pp for each week it lasted, if all three companies currently undergoing contract negotiations are impacted. In both the case of a government shutdown and the case of a UAW strike, growth would rise by the same amount it declined in the quarter following their end.
Taken together, we expect quarterly annualized GDP growth to slow from +3.1% in Q3 to +1.3% in Q4 (vs. consensus of +2.9% and +0.6%). We expect the slowdown to be shallow and short-lived, with GDP growth rebounding to +1.9% in Q1 (vs. consensus of +0.1%) as these temporary drags abate and income growth reaccelerates on the back of continued solid job growth and rising real wages.
… What would cause us to turn more positive on markets? If interest rates start being reduced globally, and if we see de-escalation of the war with Russia and easing of tensions with China. However, we see a low chance of either of these scenarios materializing near-term, and think that developments may first need to get worse before they get better. As such, we stay defensive in our model portfolio, with an UW in equities and credit vs. OW in cash and commodities. This month we trim our duration OW, by shifting 1% from government bonds to cash, given the potential for the commodity price surge to feed inflation and extend central banks’ hiking cycles. We also cover our UW in agriculture given ongoing geopolitical and supply risks…
… Most of the year, we have held a negative outlook for risk markets, and over the course of the year we have increased our model portfolio’s allocation to cash. There were two main reasons why we took a negative stance: 1) the unprecedented rise in interest rates, and 2) geopolitical deterioration that has significantly increased tail risks for global markets. As both premises for our cautious outlook turned more negative over the past few months, (a case in point was last week’s headlines on China reportedly banning officials at central government agencies from using or bringing iPhones and other foreign-branded devices into the office) while positioning and valuations increased, we think there is now a higher likelihood of a crisis over the next 6 to 12 months, the severity of which could be higher than market participants anticipate. Risks of an interest rate shock and monetary tightening are clear: consumer credit, real estate globally, funding of startups and small businesses, increase of market volatility that comes with tighter monetary policy, and, eventually, impact on employment. Meanwhile, the pace of recent geopolitical developments hasn’t been seen since the fall of communism and include: a major war with Russia, emergence of BRICS as a major political and economic bloc (Figure 9Econmi ‘etrofgavity’ (red),an BRICSmebrs (lue=orignal mebrs,gn =ewmbrs, dakgry= plicants), major political and economic changes in the Middle East, cracks in global trade and energy security, and increased political and ideological divisions in the West. We would turn more positive if interest rates start being reduced globally in the near future, and if we see de-escalation of the war with Russia, and easing of tensions and economic rapprochement with China. Our negative market view is based on seeing a low chance of either of these scenarios materializing near term – in short, we think that developments may first need to get worse before they get better.
Despite some contradictory economic prints in the US jobs market and China, we are becoming more convinced that the cracks are emerging and that end-of-cycle worries are justified…
Global PMIs reinforce this view…
As for the Chinese economy, we see a broadening of the types of stimulus, but the question remains of whether the impact will be enough to produce a meaningful turnaround…
We are reducing our Bonds OW (from +3% to +2%) in favor of Cash (from +4% to +5%). For many investors, one of the surprises of this summer has been the behavior of the long-end. In the US, 10Y and 30Y Bond yields have re-tested this cycle’s highs even if market expectations for terminal rates remain below Mar 2023 peak. Considering 10Y real yields are around 2% and that we are in the final innings of the hiking cycle, the entry level for Bonds is looking attractive from a medium-term perspective. However, we see some risk of the recent bond bear market persisting. A) Pricing for central bank hikes is below this year’s peak (Figure 12Pricng forteminal rtesiblow thisyear’ pk) and there is very little in terms of incremental hikes currently expected in G4 curves. This means there are some risks around hawkish central bank speak/action; B) Recent inflation surprises have been positive in the Euro Area and considering the spike in Oil prices (25%-30% from early July) , there is room for more surprises elsewhere. C) Some survey data including the NFIB compensation plans index, global PMI input prices/ISM prices paid but also consumer based inflation expectations in the UMich survey have inflected higher. D) From a positioning perspective, it does not look like there is a huge short base yet.
US August consumer price inflation is subject to durable goods deflation and profit-led disinflation, but energy prices will add to the headline inflation rate. The details matter. The fictional owners' equivalent rent price is still pushing up inflation. As no one pays this, middle-income homeowners enjoy a lower inflation reality. Regional variations (high inflation in Florida, deflation in Alaska) may be politically important ahead of 2024 elections.
The annual report on US median incomes showed US households experienced falling real incomes last year. Credit and savings propped up consumption. Most major economies have had negative real wage growth (hardly a sign of strong worker pay bargaining power). Yesterday's data showed UK real median pay is still negative—the average pay seems distorted by a few high earners, and high earners getting pay increases is rarely a cost-push inflation risk…
NFIB Survey Supports an End to Fed Hiking After three straight months of improvement, the NFIB Small Business Optimism Index slipped to 91.3 in August. Dimmer sales prospects and a weaker outlook for business conditions seemed to drive August’s dip, solidifying the index’s 20-month streak below its longer-term historical average. Although this outturn may seem bleak, August’s survey was not all bad news. Small business owners echoed recent trends in national data which reveal that the labor market is finding better balance, supporting our expectation that the Fed is done hiking rates. Yet, plans to raise prices perked up in August, suggesting that the ride back to 2% inflation will be bumpy and monetary policy will likely remain restrictive for some time.
… AND for us visual learners,
Bespoke - Record Yield Curve Inversion (not sure ‘bout this one but this is one of the popular kids so make if it what you want … lotta TIME at a price here, as message goes)
Since Econ 101, you've known that inverted yield curves -- when yields on short-term Treasuries are higher than yields on long-term Treasuries -- have historically been associated with recessions. Well, today we just broke the record (since at least 1962) for the longest streak of trading days with an inverted yield curve using the 10-Year Treasury Note and the 3-Month Treasury Bill.
The chart below shows historical streaks of trading days with an inverted 10yr/3mth yield curve with prior US recessions overlaid in gray. The record streak today broke prior streaks that occurred back in 2007 (209 days) and 1980 (207 days). With the 10yr/3mth yield curve currently inverted by more than 100 basis points (the 10-year is currently yielding 4.27% while the 3-month is yielding 5.42%), this streak shows no signs of ending anytime soon…
Bloomberg OpEd’er Harrison - When an early call is just plain wrong (come for the title and Michael BURY reference, stay for longer-term visual of 10yy)
… But are we talking about a similar once-in-a-generation event like that today? I would say yes, we are. First and foremost, there’s a generational shift in the bond market: After the positive glow from four decades of ever-lower yields, yields are rising again. That has implications for the wider investment landscape simply because it means a (much) higher discount rate on future cash flows.All the trend lines look broken.
In fact, this year we could be in for a third consecutive year of losses by bonds after total return declines in 2021 and 2022. And we haven’t seen rates go up by this much, this fast over the last forty-odd years. For yields to go back to trend anytime soon, the 10-year Treasury bond yield would have to fall to 2% and stay there or below — a far-fetched scenario in a world where US core inflation is still over 4% and unemployment is less than 4%.
That tells you rates will turn from a massive tailwind for stocks to a big headwind going forward. As I recently outlined, over the last 60 years, real interest rates have averaged about 3%, even including the recent 15-year negative real rate regime after the housing bust. We’re just getting back to 2% real yields now. We haven’t seen real rates sustained at that level or even higher since 2007…
… Almost as importantly, crude tends to lead expectations for future inflation. This shouldn’t be so. If anything, higher oil today should mean lower inflation in future because of the base effect. But the relationship remains strong; higher oil prices mean higher inflation expectations.
The oil price is not as important to the global economy as it used to be. But it can still upset all kinds of plans across the world. Nowhere is this more true than in Europe….
WTI (CL1): Price shot higher overnight, breaking past the prior high at $88.07 after OPEC+ forecasted shortfalls for Q4. We think the bias remains to the upside after we broke above key resistance levels two weeks ago.
We think the first level to watch is psychological resistance at $90, though the chart suggests we could see a rise to as much as $93.74 (Oct and Nov 2022 highs).


ahahah. Love that Hedgeye Cartoon
Per Brandon, "Inflation is an asset, you stupid son of a bitch'! Funny how that hot-mic moment got memory-holed ASAP