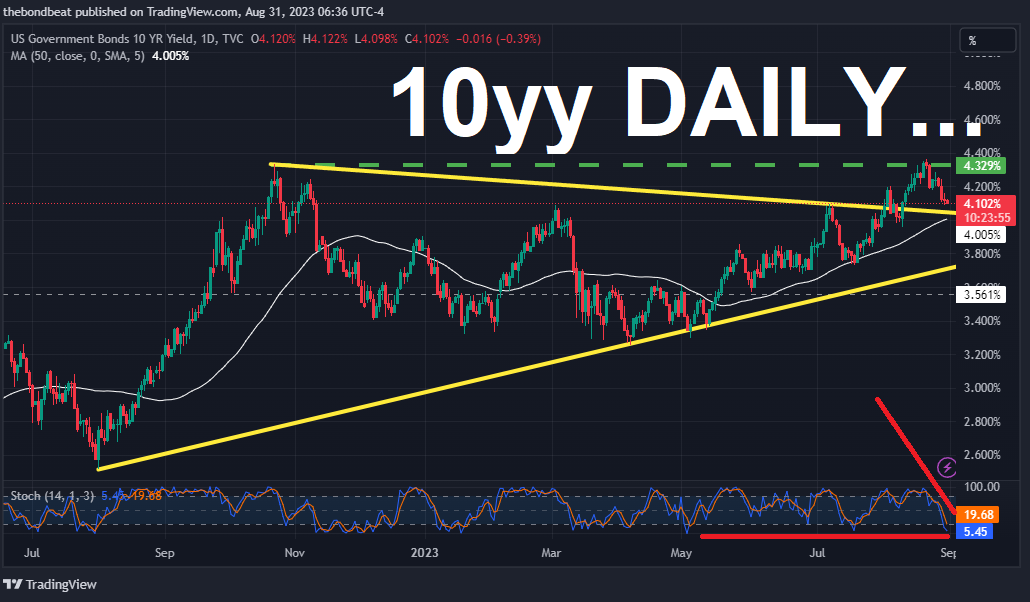
Good morning … 10yrs a ‘screaming buy’ (Ian’s words, NOT mine) and so, ahead of tomorrows NFP and effective early close (not official BUT i’d imagine the Hamptons Hedge to go in effect shortly after data is digested), a look at 10yy as I try to find something relevant to say,
… I’ve left up some of my former guiding TLINES as well as the 50dMA (4.005%) and they seem somewhat relevant … I’ll ALSO NOTE I’m trying to fit ‘screaming buy’ into the narrative here and pause to note momentum (stochastics, bottom panel) are now overBOUGHT … on the approach of upper TLINE (and 50dMA) … MY concerns are addressed if / when you zoom out and look at a WEEKLY visual,
… And so … A ‘screaming buy’ then it may be.
This all makes somewhat MORE sense, too as the narrative continues to (re)emerge … whereby bad news is good,
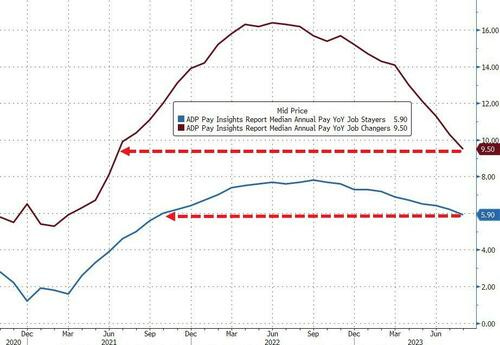
ZH: ADP Employment Report Signals Slowdown In Labor Market, Wage Growth Slows Dramatically (meet the new narrative, same as the old…)
… Wage growth slowed dramatically in August:
Job stayers saw a year-over-year pay increase of 5.9%, the slowest pace of gains since Oct 2021.
For job changers, pay growth slowed to 9.5%.
… here is a snapshot OF USTs as of 720a:
… HEREis what this shop says be behind the price action overnight…
… WHILE YOU SLEPT Treasuries are modestly higher, still underperforming UK Gilts and German Bunds this morning. DXY is higher (+0.3%) while front WTI futures are too (+0.65%). Asian stocks were mixed (Chinese shares -0.5% roughly), EU and UK share markets are little changed while ES futures are little changed too at 7am. Our overnight US rates flows saw light activity with some early real$ buying in the long-end noted as a possible set-up for month-end. Overnight Treasury volume was roughly 75% of average overall.
… The set-up for lower rates remains excellent. What we're waiting for now is to see whether the tactical bull signals now evident across most US rates benchmarks... sustain themselves long enough, or go far enough, to flip the longer-term momentum indicators bullishly too. If that happens, we'll be much more enthused about potential sustainability in the recent rally away from major range supports. The upcoming data/events will no doubt shape whatever outcome unfolds (EG: we stay 'oversold' but pinned near the rate range highs, or rally further).
This morning we picked on Tsy 5yrs to illustrate this point. Our first attachment shows the daily chart of Tsy 5yrs and the solidly bullish, short-term momentum study in the lower panel. The August low yield print near 4.06% may be your resistance. But to rally beyond that, we'd like to see the longer-term momentum studies join the bond party and there's no evidence of that yet- even as the set-up for such appears quite good. Our next attachment zooms out to the medium-term, weekly chart of 5yrs and its associated momentum in the lower panel. 5y rates and weekly momentum do look like they stand on a cliff-edge but a weekly close will be needed to confirm a new, medium-term bull signal... should it emerge. We could be close to such a flip; even tomorrow if data and a sharp rally allow. Zooming out further, the long-term, monthly chart of 5yrs looks similarly set-up (lower panel, circled) for a bull momentum flip but there's no evidence of that yet. We essentially need data, and a further drop in rates, to ripple the bullish tactical signal out to the longer-term studies to really get things going for bonds. Absent that, more time near these long-term rate range highs would seem likely for now. Anyway, this kind of set-up is seen across a broad swath of duration benchmarks at the moment so it's an interesting 'truth or dare' time for bonds here.
anyone see / HEAR the screams … and for some MORE of the news you can use » The Morning Hark - 31 Aug 2023 — in effort to to help weed thru the noise (some of which can be found over here at Finviz).
From some of the news to some of THE VIEWS you might be able to use… here’s SOME of what Global Wall St is sayin’ …
ABNAmro- Cooling US labour market supports Fed pause (a very moderated view of panic BID in bond mkts yest, no?)
Job vacancies have fallen significantly in the US, bolstering the case for both a softer landing for the US economy, and a peak in interest rates…
… Fed policy is now highly data dependent. In the near-term, alongside a continued cooling in the labour market, we also expect August core inflation data (released on 13 September) to be relatively benign. Taken together, this should convince the Committee to keep policy on hold when it next meets on 20-21 September. Beyond then, even with inflation expected to rebound temporarily in the Autumn, we expect a broadly slowing economy to keep rates steady for the next half year. We continue to expect the Fed to start cutting rates from next March, in order to offset the continued rise in real rates due to falling inflation. See our August Global Monthly for more.
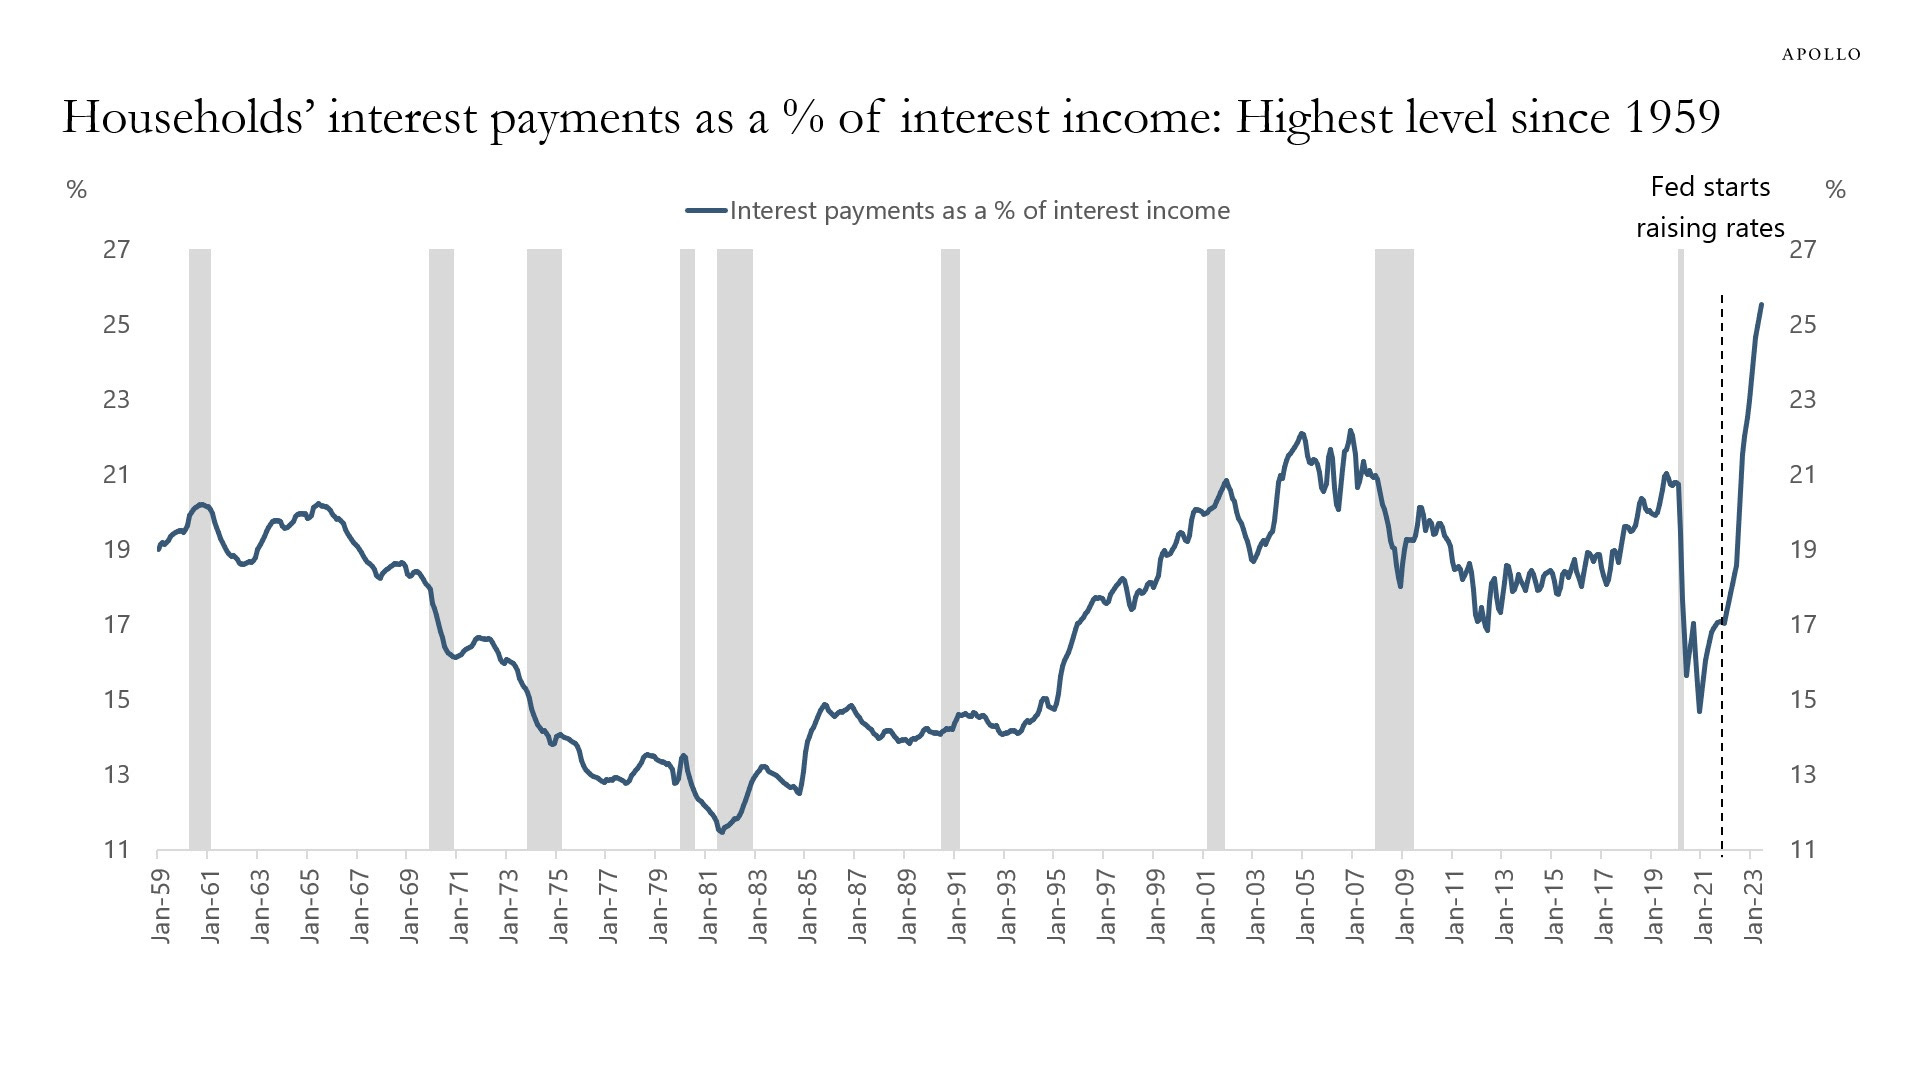
Apollo / Slok - Daily Spark: Interest Payments as a Percentage of Interest Income (as a visual learner when I see this visual — lower left to upper right — it isn’t one that inspires confidence in as far as consumption capability going forward may be concerned…maybe I’m just overthinking things…)
When interest rates increase, the household sector has to pay more for debt.
But when interest rates go up, households also receive higher cash flow on fixed-income assets.
Dividing households’ interest payments with households’ interest income shows that debt servicing costs as a share of interest income are at the highest level since 1959, see chart below.
In other words, both debt servicing costs and interest payments have increased as the Fed has raised interest rates. But debt servicing costs have just increased more.
The second estimate puts Q2 GDP growth at 2.1% q/q saar, 0.3pp lower than the first estimate, driven mainly by a downward revision to private inventories and nonresidential fixed investment. Meanwhile, real GDI rose modestly, after two consecutive quarters of declines.
Barcap - China: August PMI: A mixed bag (hey, less bad = GOOD, right?)
While it stayed in contraction, the manufacturing PMI rose for a third month, with new orders the highest since March. In contrast, the services PMI eased for a fifth month, largely dragged by real estate services and financial sectors. We think the manufacturing PMI has passed its trough, but downward pressure persists.
ADP in August disappointed at 177k vs. 195k expected and prior was revised to 371k from 324k; the lowest print since March. The smallest firms with between 1-19 employees added just 1k jobs while the largest firms with over 500 workers hired 83k workers. Wage gains continued their slide with job stayers dropping to 5.9% from 6.2% (lowest since Sep 2021), and job changers declined to 9.5% from 10.2% (lowest since June 2021). A positive indication of the Fed's pursuit of tamer wage growth and another detail showing the lagged influence of tighter policy.
Yields were slightly higher going into the release after the European inflation data overnight while the curve was drifting steeper. Since the employment figures we've seen a bull steepening response, although we'll caution against drawing too strong a correlation between ADP and the BLS data on Friday. GDP revisions will serve as a minor distraction, but we anticipate the market is entering what we're expecting will be a period of consolidation ahead of payrolls…
BNP - Quant Trade of the Week: Long CSI1000 and 10y US vs Bund compression (it’s that last expression which caught my attention — used to love me UST/BUND trades)
… Initiating 10y UST vs Bund compression: Following Jackson Hole, US yield valuation residuals have started to contract (UST 10y 9bp, 0.9 z-scores too high. In the eurozone, last week’s PMI print showed a sharp turn in momentum in the services sector and resulted in European yields now looking too low (Germany 10y 12bp −2.2 z-scores too low). As a result, 5y and 10y UST spreads to Bobl and Bund now look too high vs MarFA™ Macro fair value and very recently started to converge. The 10y UST vs Bund spread looks 22bp (1.7 z-scores) too high, and the 5y UST vs Bobl spread 20bp (1.4 zscores) too high.
Our strategists also view that the reset in yields has eroded the valuation headwind to owning US duration. We now view selloffs as an opportunity to add long exposure on more Fed-sensitive parts of the curve given cyclical considerations. For more, see US rates: Buy the dip, sell receiver skew on yield reset, dated 28 August)…
… Overall, we initiate a 10y UST vs Bund compression trade targeting 1.43%.
CSFB - China Data: PMI remains contractionary, but China is not on the verge of implosion (consistent message from this shop — like it or NOT, China may have turned the page …)
August manufacturing PMI remains contractionary but increases modestly to 49.7 from 49.3 in July. The August reading is also a tinge above the market consensus of 49.4. We have cautioned our audience recently that consensus on the economic front for China might be getting too pessimistic (link). Although China’s economy is facing many challenges, we maintain the view that China can still achieve its annual growth target of “around 5%”.
Component-wise, with production rebounding to 51.9 from 50.2 and new orders back into expansionary territory (see Figure 1), domestic demand at least paused its weakening trend. To be fair, we continue to expect ongoing downward pressures on China’s household consumption given that the households are entering into a multi-year deleveraging phase (link). (See Figures 3 and 4.) So, China’s economy is not out of the woods, but 2023 will not go down in history as the year of China’s implosion.
By our assessment, household demand will only respond to policies that either directly improve disposable income growth or reverse the expectation of the structural decline to house prices (link), or both. Neither is achievable via existing policies, and the authorities understand that they lack effective tools.
Looking ahead, we do worry about nationwide house price correction in 2024, and if that were to happen, we expect the authorities to step in and tender for the distressed debt of developers, but at a significant discount to par value. We also expect a restructure to some local government debt. However, until the house price correction happens, we expect the authorities to allow further consolidation in the real estate sector, meaning additional defaults by developers are likely. We assign essentially zero probability to the narrative of reflating house price via stimuli (as mentioned earlier, this is unachievable even if authorities wanted to try) or any narrative of bailing out the distressed developers at par value…
FirstTrust- Real GDP Growth in Q2 Was Revised Lower to a 2.1% Annual Rate (whatever happened to all is well?)
… The lower revision to the overall number was due to the cumulative effect of a series of small downward revisions to inventories, business investment, and net exports. More important, today we also received our first look at economy-wide corporate profits for the second quarter, which declined 0.4% versus Q1, and are down 6.5% from a year ago. However, the government includes Federal Reserve profits in these data, and the Fed has recently been generating unprecedented losses. We follow profits excluding those earned (or lost) by the Fed, which were up 1.1% in the second quarter and up 3.8% from a year ago. In effect, the losses by the Fed are the private banking sector’s gain, as the Fed pays banks about 5.4% to hold reserves and do nothing with them. Still, plugging non-Fed profits into our Capitalized profits model suggests stocks are overvalued.Moving forward, we expect declines in corporate profits as the economy continues to re-normalize after the massive fiscal and monetary shocks of 2020- 21. In turn, this will be a headwind for equities. In addition to corporate profits, we also got a Q2 total for Real Gross Domestic Income, an alternative to GDP that is just as accurate. Real GDI grew at only a 0.5% annual rate in Q2 and is down 0.5% versus a year ago, consistent with underlying economic weakness…
BOTTOM LINE: Real GDP growth was revised down by three tenths to +2.1% annualized in the second quarter, below expectations and driven by weaker inventory and net trade contributions. Gross domestic income rebounded modestly following declines in Q4 and Q1. We boosted our Q3 GDP tracking estimate by one tenth to +2.7% (qoq ar) and our Q3 domestic final sales growth forecast by the same amount to +2.8%. We left our month-over-month July core PCE inflation estimate unchanged at +0.21%, now corresponding to a year-over-year rate of +4.20%, and our headline PCE inflation estimate unchanged at +0.21% (mom), corresponding to a year-over-year rate of +3.25%. According to the ADP report, private sector employment rose by 177k in August, 18k below consensus expectations. The August ADP report is consistent with the sequential softness in other alternative employment indicators, and we left our nonfarm payroll forecast unchanged at a below-consensus +149k ahead of Friday’s release. Wholesale inventories declined slightly in July, but beat expectations for a larger decline, while the goods trade deficit widened more than consensus expectations in July. Pending home sales increased 0.9% month-over-month in July, against consensus expectations for a 1.0% decline.
The increase in interest rates in recent months has left equity valuations more challenged.
Based on the Equity Risk Premium (ERP), the S&P 500 Index offers very little additional compensation for equity investors relative to fixed income, which offers some of the most attractive yields in decades.
The ERP is one of the primary reasons that LPL Research has a slight preference for fixed income over equities in its current recommended tactical asset allocation, but consider that valuations have not historically been good short-to-intermediate term timing tools.
LPL Research suggests sourcing a slight fixed income overweight from cash to maintain a neutral equities allocation relative to appropriate benchmarks.
… The ERP compares the earnings yield on the S&P 500 (the inverse of the price-to-earnings ratio, or P/E) to the 10-year US Treasury yield. The inverse of 22 gives us an earnings yield for the S&P 500 of about 4.5%
We can then compare that 4.5% number to the 10-year Treasury yield (not risk free but referred to as a “risk-free rate” in the textbooks). The 10-year yield is trading at 4.11% currently, down from a recent closing high of 4.34% on August 21. Take 4.5% minus 4.11% and you get roughly 0.4%, the current ERP for the S&P 500 as shown in the chart below.
… Asset Allocation Considerations The low ERP is one of the key reasons that LPL Research has a slight preference for fixed income over equities in its current recommended tactical asset allocation. Valuations have not historically been great timing tools over the short-to-intermediate term, but when they are high, they do raise the bar for the economy and corporate America to deliver enough good news to push stocks higher. We see this as a reason to temper enthusiasm for equities, not to be bearish. We remain neutral equities and suggest sourcing a slight fixed income overweight from cash, relative to appropriate benchmarks.
MS - US Economics: Employment Report Preview (still amazes me how much time money and ink is spilled creating NFP PRECAPS while in 24hrs, all narratives can be turned upside down and folks need to start all over again … hey, least there’s job security?)
Further slowing: We forecast August payrolls increased by 155k and private payrolls by 115k . Ex strikers (16k), private payrolls decelerated to 130k from a 185k average in the prior 3 months. We expect payback in average hourly earnings (+0.2% after +0.4%), and no change in the workweek or u-rate.
MS - US Consumer Economics: 4Q Consumption Risks (sorta putting the bond market bid mildly … but wait, gets better … seems like we’re BLAMIN’ BARBIE for econ weakness coming … ?)
Consumer spending in 3Q23 is benefitting from large one-offs in consumer spending on "Barbenheimer", Taylor Swift's "The Eras" tour, and Beyoncé's "Renaissance" tour. The unwinding of these events, combined with the expiration of the student loan moratorium equal 1.4pp downside to real PCE in 4Q23.
Real consumer spending is tracking 1.9% Q/Q annualized growth in 3Q23. We estimate "Barbenheimer", Taylor Swift's "The Eras" tour, and Beyoncé's "Renaissance" tour are combined contributing 0.7pp to consumption growth this quarter.
In 4Q, spending on Barbenheimer will drop away. Taylor Swift's tour in the US ended in August and is now moving international from November 2023- August 2024 (4Q23-3Q24). Beyoncé's tour wraps up at the end of September. While there will be some lingering tailwinds from movie sales in 4Q23, we estimate a 0.6pp hangover effect on consumption in 4Q23…
… Altogether, we estimate the drag to real PCE growth in 4Q23 is -1.4pp from these factors and -1.0pp to real GDP growth. We forecast that on net real PCE growth will contract by -0.6% Q/Q annualized in 4Q23 and real GDP will eke out an increase of 0.1%.
The second estimate of Q2 GDP showed the economy expanded at a 2.1% annualized pace, while still strong, this is a slightly slower pace of growth than first estimated. Data on the income side of the economy suggest a much slower pace of expansion in H1-2023, though real GDP and GDI are diverging at an unusual rate.
… Minor Revisions to Q2 GDP, GDI Still Signals Slower Pace of Activity … Gross domestic income (GDI), which was released for the first time for the second quarter, signals a slower pace of growth through the first half of the year having risen at just a 0.5% annualized pace after contracting for two consecutive quarters. Real GDP and GDI should be equivalent in theory, but usually somewhat differ. On a year-ago basis, the measures have diverged further and signal the widest gap between the two measures on record (chart). This unusually wide gap suggests the two may converge in subsequent data releases.
GDI was held back by corporate profits. Pre-tax profits were a bit worse than anticipated, slipping 0.4% (not annualized), or by $10.6 billion, in Q2. Profits have rolled over--they have now slipped for the fourth consecutive quarter and are about 6.5% off where they stood a year ago. That said, the details paint a somewhat better picture of Q2 profitability. The pullback can be traced to the domestic financial industry specifically, which saw profits slide by nearly $50 billion during the quarter. Nonfinancial domestic profits actually rose $17.1 billion after stumbling the past two quarters. We will get the underlying nonfinancial industries' data in the next estimate of GDP, but these high-level figures suggest some stabilization in underlying profits amid a still resilient pace of spending.
More traditionally recognized measures of profits, like earnings of the S&P 500, have also held up better. Economy-wide profits differ from that of the S&P 500 in accounting methodology and scope, but the two tend to track over time. After-tax profits, without inventory valuation or capital adjustment, tends to follow operating earnings of the S&P 500 most closely. By this measure, economy-wide margins improved in Q2 as did the S&P operating margins (chart). The two measures remain elevated compared to pre-pandemic levels…
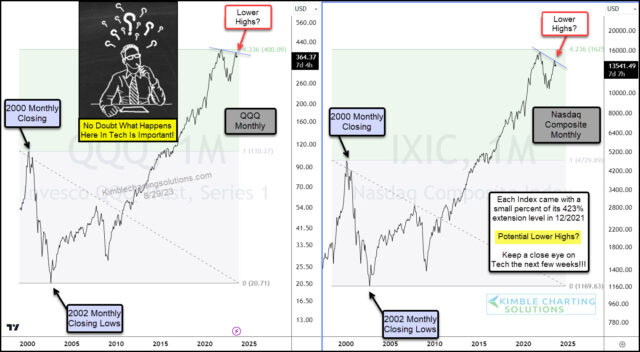
Finally, for those visual learners out there and who buy into the idea that as goes tech so goes rates (and versa vica),
Kimble: Can Tech Stocks Fight Through “Lower Highs” Resistance?
Several stock market indices and sectors are nearing important trading points within various patterns.
But arguably none more important than the major technology indices.
Today we highlight the Nasdaq 100 ETF (QQQ) along with the Nasdaq Composite Index. As you can see, both of these “must follow” charts show the potential for lower highs.
A similar pattern happened in 2000 and was confirmed when new lows were made.
On the other hand, a breakout over falling resistance would be bullish.
Lower highs or breakout, it’s clear that what happens next will be important from this market leader…
Finally, on this day in 2012, we learned a bit more about how Fed thinks of the portfolio balance channel and the mix and interplay of asset classes, as Bernanke delivered this speech at Jackson Hole,
… In using the Federal Reserve's balance sheet as a tool for achieving its mandated objectives of maximum employment and price stability, the FOMC has focused on the acquisition of longer-term securities--specifically, Treasury and agency securities, which are the principal types of securities that the Federal Reserve is permitted to buy under the Federal Reserve Act.3One mechanism through which such purchases are believed to affect the economy is the so-called portfolio balance channel, which is based on the ideas of a number of well-known monetary economists, including James Tobin, Milton Friedman, Franco Modigliani, Karl Brunner, and Allan Meltzer. The key premise underlying this channel is that, for a variety of reasons, different classes of financial assets are not perfect substitutes in investors' portfolios.4 For example, some institutional investors face regulatory restrictions on the types of securities they can hold, retail investors may be reluctant to hold certain types of assets because of high transactions or information costs, and some assets have risk characteristics that are difficult or costly to hedge.
Imperfect substitutability of assets implies that changes in the supplies of various assets available to private investors may affect the prices and yields of those assets. Thus, Federal Reserve purchases of mortgage-backed securities (MBS), for example, should raise the prices and lower the yields of those securities; moreover, as investors rebalance their portfolios by replacing the MBS sold to the Federal Reserve with other assets, the prices of the assets they buy should rise and their yields decline as well. Declining yields and rising asset prices ease overall financial conditions and stimulate economic activity through channels similar to those for conventional monetary policy. Following this logic, Tobin suggested that purchases of longer-term securities by the Federal Reserve during the Great Depression could have helped the U.S. economy recover despite the fact that short-term rates were close to zero, and Friedman argued for large-scale purchases of long-term bonds by the Bank of Japan to help overcome Japan's deflationary trap…5
hit or miss, friends there in UK are on holiday will resume posting (and add the 'new look' tag line if you wish :) ) soon as / IF i start receiving on regular basis!!
All QE or high-Powered money does is increase the price of Assets. But I'm not the man to argue this, I'll now pass the baton to Michael Pento & Murray N. Rothbard....