(USTs little changed on extremely LIGHT volumes) while WE slept; some 'charts for the beach', CPI precaps and a rate cycle 'unlike any other' = different this time?
Good morning … with two auctionsdown and only one LONG bond to go, I gotta ask … #GotBONDS?
Rate stratEgerists still seem to be drinking this very same Kool Aid,
Reuters poll: Bond strategists cling to forecasts for declining U.S. yields
… The median forecast for the 10-year Treasury note yield was 3.60% in six months, a slight upgrade from 3.50% in a July survey, and compared with 4.03% on Wednesday and a cycle high of 4.34% last October, the Aug. 3-9 poll of 41 strategists showed.
But some analysts are showing signs of hesitation about steep falls. The 10-year note yield is still well below the two-year equivalent, usually a sign of impending recession at a time when most of the talk in markets is about the Fed avoiding one.
"We now see more limited scope for yields to fall over coming quarters," said Phoebe White, U.S. rates strategist at J.P. Morgan. They upgraded their year-end 10-year yield forecast to 3.85% from 3.50%.
"A stronger growth trajectory into next year than we previously forecast should allow the Fed to stay on hold for longer, and we now expect just 25bps of easing per quarter beginning in Q3 2024," she said…
That said, here’s a look at 30yy via TradingView with relatively recently redrawn TLINE which we’re breaking back beneath …
Next stop 4%? Let’s not get ahead of ourselves but … Making matters worse (for those who’d want some sort of concession) is momentum (green line bottom RIGHT) has crossed when rates up nearer 4.35% and appear to be set up as a bullish / lower yield input.
A bullish input clearly at play yesterday with regards to the 10yr auction,
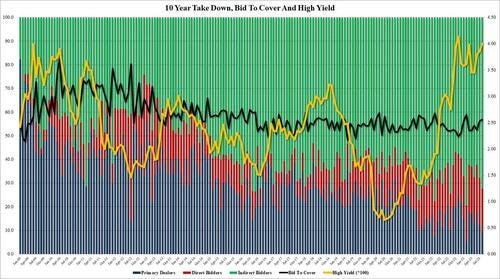
ZH: Yields Slide After Impressive 10Y Auction Sees Most Foreign Buying Since February
… The internals were the most impressive, however, with Indirects awarded 72.2%, up sharply from the 67.7% last month, the most since February and well above the six-auction average of 67.0%. And with Directs taking 18.3%, which was just below the recent average of 19.1%, Dealers were left holding 9.5%, the lowest since February.
… here is a snapshot OF USTs as of 714a:
… HEREis what this shop says be behind the price action overnight…
… WHILE YOU SLEPT Treasuries are little changed, a modest steepening bias seen across core markets ahead of the US CPI data and 30y supply. General positivity abounded in risk-assets overnight, ChiNext Index +0.5%, NKY +0.8% despite the ongoing US-China tech investment spat. FX flows are at ~70% and UST franchise volumes look to be around 60% as we near the US open, high beta currencies outperforming on a weaker USD (DXY -0.4%). SPX futures are sitting +23pts at 7am, 5s30s curve +1.5bps and the spread curve modestly steeper around an unchanged 5y point. Citi Economics forecasts core CPI at 0.196%MoM and headline at 0.3% at 08:30 EDT. Jobless claims are seen to be at 230k.
… and for some MORE of the news you can use » The Morning Hark - 10 Aug 2023 — to help weed thru the noise, this daily compilation is organized and then dumped into your inbox ‘bout 345a and is well worth its weight in gold … IF, on the other hand, yer looking for complete list OF the noise to weed through, head over here TO Finviz.
From some of the news to some of THE VIEWS you might be able to use… here’s SOME of what Global Wall St is sayin’ … just ahead of CPI which will then shake up the narrative marketplace snowglobe …
LPL: Core Bond Inflows Provide Support as the Fed and Banks Step Back
… Per Morningstar data, the chart below shows open-ended intermediate core and core plus bond funds (mutual funds and ETFs) have had strong inflows of over $100 billion during the first half of 2023, representing roughly 80% of total 2023 inflows for taxable bond categories. These inflows come at an opportune time, allowing money managers to support the bond market as two important buyers step back—the Federal Reserve (Fed) and banks. As the Fed continues to run quantitative tightening (QT), it has actively stepped back from Treasury and mortgage-backed securities (MBS) markets. Additionally, elevated front-end rates incentivize investors to pull cash out of bank deposits and allocate to products like money market funds and other cash-like alternatives. Declining deposits equates to lower reserves needed by banks, which equates to banks stepping away from high quality bond markets as well. As two key market participants and their natural bid step back from the market, money managers need to fill in this demand gap. So far in 2023, that hasn’t been a problem given the positive inflows, providing a bid to high quality core bond sectors.
As the chart above shows, high yield credit funds (bonds and bank loans) have seen outflows over the last 18 months. The resilience of high yield credit returns despite investor outflows is a good example of the technical aspects of the bond market. In simplest terms, high yield supply slowed in 2022 and has continued to do so in 2023. According to JPMorgan Market data, 2023 high yield supply is 42% lower than the four year average (excluding 2020). This lower supply helps to offset investor outflows as the market avoids becoming over saturated with high yield debt, which would push yields higher and returns lower for investors. This recent lack of supply of high yield credit is partly explained by the war chest of liquidity high yield issuers built during the ultra-low rate environments of 2020 and 2021. However, roughly $785 billion of high yield bonds are set to mature between 2024 and 2026. This may lead to high yield supply closer to historical averages as issuers re-tap the market, and this supply may become a technical headwind if supply outpaces demand, particularly if economic growth slows.
We expect high quality bond fund inflows to continue as yields have reached levels not seen since 2008 (the Agg recently reached a yield-to-worst of roughly 5%)…
Mixed signals from economic data have triggered a debate on whether monetary policy is sufficiently restrictive. We think it is. We explain our view and discuss key points in the debate.
Our view in two bullets:
We think, like Chair Powell, that policy is in sufficiently restrictive territory.
The effects of monetary policy on economic activity are long-lasting and, therefore, a large part of economic slowdown is yet to come…
… We could be wrong, and we will be closely watching the Fed's canaries in the coal mine (inflation and labor markets) and updating our views accordingly. But based on our analysis, we think a large part of the economic slowdown is yet to come.
… US consumer price inflation for July is due for release. Energy is less of a drag on the headline number. The deflation of durable goods (a continuous trend since December 2022) is likely to subdue the core. Two points beneath the headline hysteria: any decline in owners’ equivalent rent lowers inflation but does not actually benefit anyone’s spending power; remember there is unusual regional divergence, with parts of the US already having sub-2% inflation but Miami experiencing nearly 7%.
Japanese July producer price inflation slowed, more or less as expected. Disinflation forces in Japan come from external factors, but also from relatively subdued wage growth…
US 2yr yields: US 2yr yields have bounced higher off the 55-day MA support at 4.72% on Wednesday. Nevertheless, we continue to be focused on the downside potential. IF we see a decisive close below the 4.72% support (though we prefer to wait for a weekly close to confirm this given recent choppiness), we would complete a 55-200 day MA setup, with intermediate support at the July 2023 lows of 4.60%.
US CPI ahead will be the key factor for markets. In the event of an upside, we see yields likely to enter the 4.80%-4.95% range that we saw since late July.
Chart of the Day: 10yr US Real Yields approach Thursday’s key CPI report on the back of having established a large bullish “reversal day” last Friday after again successfully holding medium-term support at 1.82% from the top of their range from October 2022, with daily RSI also having established a lower peak. Whilst this suggests the conditions for a potential reversal lower in yields are back again, the problem so far is that we have yet to see any resistances of note break. A close below the 55-day average and low of last week at 1.57/1.535% is needed to at least mark a near-term top for a retest of more important resistance at the 200-day average and July low at 1.41/1.355%. Should a weekly close above 1.82% be seen though, this would be seen to mark an important and worrying break higher for risk markets, warning of a rise to 1.98/2.00% initially.
30yr US Yield
30yr US Bond Yields still need to break 4.085% to ease the risk for a test of the 2022 high and long-term retracement support at 4.42/4.46%.
The rise in 30yr US Bond Yields peaked at 4.325% last week but the subsequent pullback remains above resistance from its rising 13-day exponential average, now at 4.12%, never mind price resistance at 4.085%. Whilst above this latter level there is the risk this is just a temporary pullback ahead of fresh weakness back to 4.325%, then a test of what we view as major support at 4.42/4.46% – the 2022 yield high, June 2022 high and the 61.8% retracement of the entire 2000/2020 fall in yields.
Whilst we would look for fresh buyers to show at 4.42/4.46%, should weakness directly extend and a weekly closing break higher be seen this would suggest we can see a further rise in yields to test the series of yield highs posted in 2008, 2009, 2010 and 2011 at 4.80/4.86%.
Below 4.085% though can ease the threat of a further sell-off, clearing the way for a recovery back to resistance next at 4.00/3.985%, with the key rising 55-day average now seen at 3.945%.
Energy prices have risen sharply over the past week following industrial/strike action and this has seen Brent Crude Oil reinforce its existing break above the key 200-day average for the first time since summer last year for a test of key flagged resistance test at the series of highs seem from last December and “neckline” resistance, at $87.49/$89.37. Whilst capped here, the core trend can remain seen sideways.
A weekly close above $89.37 though would in our view see an important base established to suggest the core trend has turned bullish, with just initial resistance then seen at the 38.2% retracement of the 2022/2023 downtrend at $96.48.
With the broader market and investors still focused on concerns with respect to high and persistent inflation, an important base in Brent Crude Oil would raise concerns about not only inflation expectations staying high, but increasing further.
Importantly, as we yet we are not seeing any reaction by Breakevens to this move higher in Oil, and only above the 254bps YTD high in 10yr US Inflation Breakevens would suggest a base has been completed here and a more concerning rise can emerge, which would suggest bond yields themselves can also rise further.
The increased risk of higher Breakevens and Bond Yields though would only become a clear threat and concern should we indeed see Brent Crude break resistance at $89.37 and establish a base. We would also see this as a negative for risk markets in general if this were to be seen.
Concerningly though, strength in NYM Natural Gas suggests an important base may have already been established.
… Downgrades do matter If debt ratings changes don’t matter, then why are there debt ratings? Of course, they matter. They matter for companies, for municipalities, and for governments.
The 2011 US debt downgrade had a meaningful effect on the relative interest costs of US Treasuries and, because debt in the economy prices off government debt, raised the cost of capital for the entire US economy. No one cared because the absolute level of interest rates was low, but such omissions missed the important point that interest costs were unnecessarily high because of Washington dysfunction.
Prior to the 2011 downgrade, the yield spread between US Treasuries and German Bunds vacillated with neither country’s debt considered riskier for any length of time than the others. However, that all changed with 2011’s downgrade. US debt began to trade with a consistent 100- 200 bps higher yield and has done so for the past 12 years.
One could argue how damaging the latest US debt downgrade might be, but it certainly won’t decrease the relative cost of capital for the US economy.
… Something somewhere is fueling global growth Some have called copper “Dr. Copper” because it tends to forecast the economy better than some (perhaps many?) economists. It appears as though Dr. Copper is once again disagreeing with the consensus economic forecast.
Consensus is US and global economic growth is slowing and the US is heading for a nice soft landing of the economy. However, copper prices have been rallying within the context of a what appears to be a multi-year bull market suggesting global growth is accelerating not slowing. Copper remains a critical component in our longer-term themes centered on real productive assets.
Inflation expectations aren’t supporting the “Goldilocks” consensus One might describe the current economic consensus as forecasting a “Goldilocks Economy,” i.e., one in which neither inflation nor growth is too hot nor too cold. That such a consensus has formed is understandable because Goldilocks economies have historically been good ones for financial assets.
Dr. Copper doesn’t appear to be agreeing with consensus, and now the Fed’s favorite measure of inflation expectations (the 5-Year 5-Year Implied Forward Inflation Expectations Rate) has jumped. It likely won’t take much higher inflation expectations for economists to remove their “inflation expectations are well-anchored” commentaries, which would certainly call into question the Goldilocks outcome.
These last two charts are raising a key question for the fall: What does the Fed do if the nominal economy actually accelerates?
All told, despite all your efforts and having made it this far, you are up to speed and well read and prepared FOR CPIMANIA , truth be known that by days end, all the narratives are just as likely to be rewritten as we all head down a completely different path. I’ll eventually be forced to break out my crayons and redraw some TLINES in TradingView in effort to mark a view to market because … well … you know, when the facts change we all must change, right?
I’ll leave you with one final ‘official’ writeup of how this time may in fact be different and should you feel differently, well, in this case please direct any / all concerns TOWARDS Richmond Fed
Following the COVID-19 pandemic, the federal funds effective rate was once again at its lower bound. In March 2022, the FOMC raised rates following a surge in PCE inflation to 6.4 percent. A little over a year later, the federal funds effective rate has increased to more than 5.0 percent. Over that same period, PCE inflation has decreased to 4.4 percent, while the unemployment rate has remained relatively unchanged, going from 3.8 percent to 3.7 percent.
Figure 4 shows all the rate cycles since 1987. The current cycle is the first time over the entire postwar period the FOMC has made significant progress in lowering inflation without an associated increase in the unemployment rate.
… Conclusion
In contrasting the current rate cycle with past episodes, it appears that the FOMC has been uniquely successful thus far in lowering inflation while leaving the unemployment rate at its lowest levels in roughly half a century. Moreover, with the recent pause at the June FOMC meeting, the built-in policy tightening over the last year may bring about further declines in inflation without a dramatic rise in the unemployment rate. This would be a first in the postwar U.S. economic experience.
The FOMC so far has had to strive to lower inflation without a recessionary shock, such as the ones in 1990 and 2008, that helped ease inflationary pressures on prices. However, with little guidance from past rate cycles, the FOMC will have to remain vigilant to avoid missing its target should the economy prove more resilient than anticipated.
AND as CPIMANIA comes to a close after today’s print I’m reminded of this oldy but (not so)goody …
Where that balloon is being constantly re INflated by … Saudi’s and RUSSIA. Don’t believe me?


Brandon better reopen those SPR spigots ASAP, I really don't believe the jobs numbers. FT jobs Down, PT jobs UP. Great charts! Very educational TY!