Good morning / afternoon / evening - please choose whichever one which best describes when ever it may be that YOU are stumbling across this weekends note…
Allow me to begin by ripping the bandaid off and heading TO the web (and ZH) for some NFP SPIN (and snark)
ZH: July Payrolls Miss Expectations At 187K, Follow Big Downward Revisions, But Unemployment Rate Drops And Earnings Come In Hot
ZH: Inside Today's Disastrous Jobs Report: 1 Million Surge In Part-Time Jobs As Full-Timers Crash Amid Staggering Downward Revisions
Bonddad: July jobs report: almost across the board deterioration in leading sectors
CalculatedRISK: July Employment Report: 187 thousand Jobs, 3.5% Unemployment Rate
FirstTrust: Nonfarm Payrolls Increased 187,000 in July
GlassDoor: July Jobs Report: Slow but Steady Wins the Soft Landing
ING: Mixed US jobs data signals September pause
Wells Fargo: July Employment: No FireworksA slower pace of hiring in July showed that the labor market continues to gradually cool. Nonfarm payrolls rose by 187K in July, the second straight sub-200K print, but still plenty strong enough to keep downward pressure on unemployment.
WolfSt: Powell’s Nightmare: Wage Growth, after Signs of Losing Altitude, Re-Accelerates
AND added all up what did we get?
ZH: Dollar & Bond Yields Tumble After 'More Or Less Benign' Payrolls Print
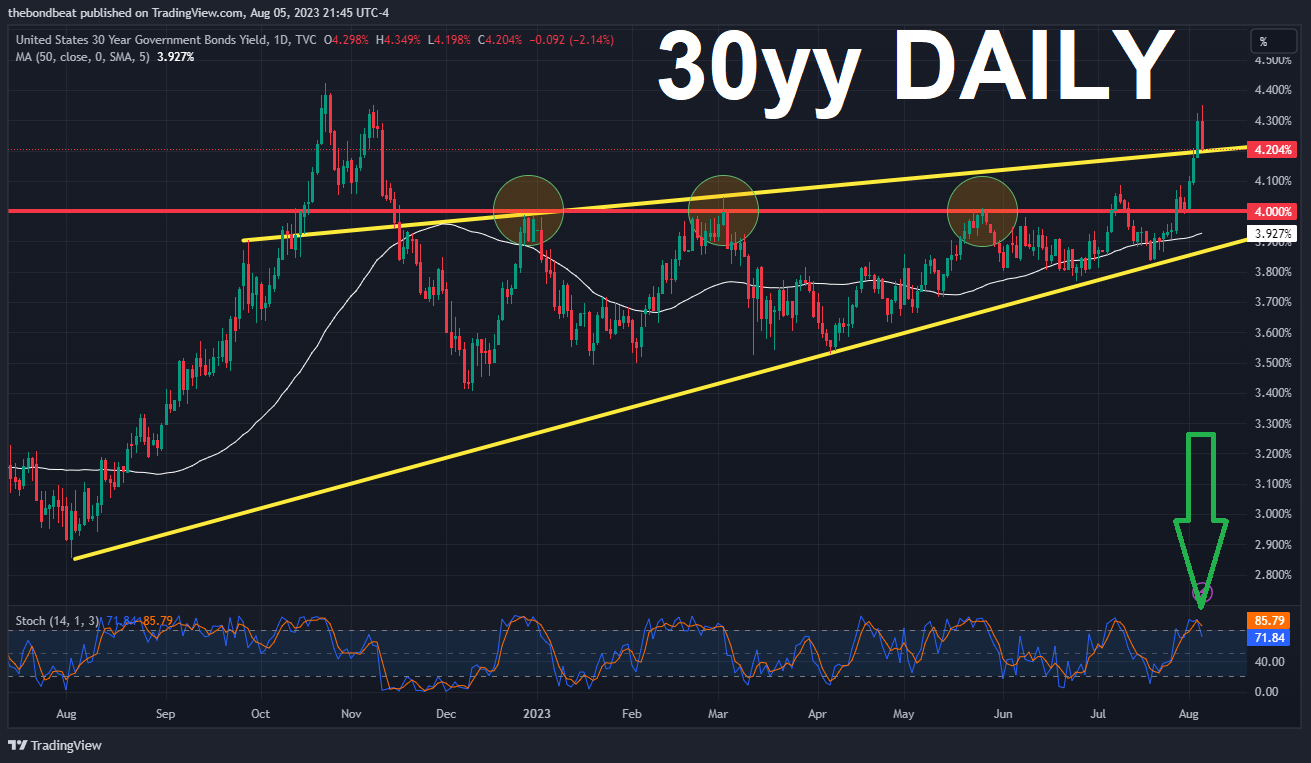
I feel as though I just redrew TLINES and thought outloud about being closer TO buying of some sort of dip …
… Clearly the UPTREND is in place and I’ve had to redraw TLINES several times and I’d frame it this way … the closer we get TO the top of the TLINE (~4.20%) the more I’d look for some sort of shorter-term opportunity to FADE…I’d ALSO be more inclined to hold my nose and BUY if stocks became unglued quickly…Moving to the 10yy perhaps more / most buyable at / near TLINE …
Stocks have not YET become unglued AND we’ve blown up THRU all sorts of levels of support and have since come back down TO these levels …
I do believe I could LIKE long bonds (and 10s) IF they could maintain some of this concession ahead of this weeks duration supply if, for no other reason, that momentum is crossing bullishly (on DAILY)
This is, by NO means, any sorta I TOLD YA SO — cuz I didn’t BUT we’re certainly getting near interesting levels (capitulation) and some out there (BMO, MS) are interested …
And with that in mind … on TO some weekly NARRATIVES where I’d note only a couple / few things this weekend,
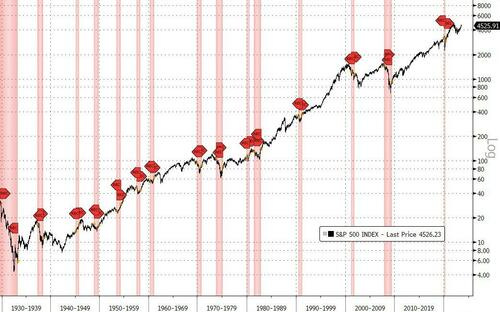
Argus reminds us of August equity seasonals
… our analysis of monthly returns going back to 1980 indicates that August is ahead of only one other month (September) in terms of average return. Yes there have been some hits. The month has a "win percentage" of 55%, and in 2020 the S&P 500 popped 7.3% in the month. But there have been some clunkers as well, including 1981 (-6%), 1990 (-9.4%), 1998 (-14.6%), 2001 (-6.4%), and 2015 (-6.3%). Last year was a bummer, with a 4.2% drop. Generally, August is a quiet month on Wall Street. The second-quarter earnings reports are mostly finished in July, with a few retail and tech stragglers still left to announce results. The IPO market, quiet already this year, often goes into a period of hibernation. Volume tends to be light -- which is perfect for higher volatility.
BMO — likes coming out of this weeks supply LONG but for a trade
…look to reenter a short in the 2-year sector at 4.75% after what we’ll characterize as an overreaction to the payrolls data …
GS weekly RATES TRADER on risk premium being vulnerable to data,
The bulk of this week's selloff occurred during NY morning hours - Cumulative change in UST 30y yields, by timezone; in bp
GS also attempts to DEBUNK worry about decline in money supply
MS weekly, “Narrative Marketplaces” — remain LONG 5s, FFV3H4 flattener and buy Feb50 TIPS a
UBS asks, attempts to answer, ‘how low can we go’10s are 6bps away from being their cheapest since 2009 ahead of next week's CPI and bond auction. The sharp sell off gained speed after the Treasury announced a very large increase in coupon auctions. Assuming those increases are matched at the November refunding, the amount of net duration flowing to private investors will surpass the 2021 pace by February. The selloff has put off-the-run 30yr TIPS above 2%, a real yield that has brought in buyers in the past … Since 1985, 2s10s has steepened more than 50bps eleven times, six bull and five bear. But all of the bear steepeners came when short rates were pinned near 0%, sharply depressing short rate volatility so 2s10s steepened whenever 10s sold off. We think a major bear steepener is unlikely when short rates are high. We like 2s10s steepeners, but think they are proxies for being long 2yr notes.
AND more … much, much more.
Moving along and away FROM highly sought after and often paywalled and Global Wall Street narratives TO a few other things widely available and maybe as useful from the WWW …
AllStarCharts: Weakest Time For Stocks
… Now that even the biggest permabears threw in the towel and started turning more optimistic, we are now entering the most bearish time for stocks:
Seasonal trends were just one of the many reasons why we’ve been so bullish for so long.
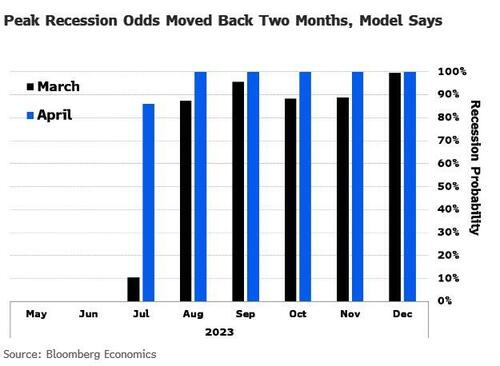
Bloomberg (via ZH): Stocks' Gains Should Not Be Mistaken For Confidence That There's No Recession Imminent
… So, even with selective data-mining/trimming, we find the stock market is a low-conviction (not statistically significant) lead indicator by three months (with large variability).
That’s relevant, given Bloomberg Economics is now validating my call for a US recession beginning in 4Q, which would imply the most likely time for the S&P 500 to peak out is between July and September (July 31 providing this cycle’s peak so far).
That clashes harshly with the soft-landing narrative that has become entrenched in markets, but even this exact economic complacency has dangerous precedent, as Bloomberg’s Chief US Economist Anna Wong highlights…
Bloomberg’s The Weekly Fix: No country has ‘god-given' right to AAA rating
… For all the drama around the US downgrade, it was largely business as usual for bond investors. That includes Warren Buffett, who told CNBC on Thursday that the “only question” is whether Berkshire Hathaway is going to buy another $10 billion of 3- or 6-month Treasury bills next week.
“There are some things people shouldn’t worry about,” Berkshire Hathaway chairman and chief executive Buffett said. “This is one.”
Buffett’s comments came hours after Pershing Square Capital Management Founder Bill Ackman said he is short 30-year Treasuries “in size” — a position that doubles as a hedge against the impact of higher long-term rates on the stock market and a standalone bet.
As an extremely online person, I pointed that fact out on X, the social media platform formerly named Twitter — Buffett is big on bills, while Ackman is shorting duration — with the unfortunate quip “Buffett vs Ackman.” Imagine my surprise when Ackman replied, pointing out that Pershing Square also uses short-dated US paper for cash management purposes:
“We actually agree. Buffett would never buy 30-year Treasurys at anywhere near current yields. His purchases are just cash management using short-term T-bills. We also invest our cash in short term Treasurys.”
Very fair! And an important nuance missing from my original post. But the day only got stranger when Tesla Inc. chief executive and current X owner Elon Musk weighed in with his thoughts on the shortest end of the Treasury curve:
“Yeah, short term T-bills are a no-brainer.”
While a sample size of three isn’t huge, it’s probably safe to say that the shock US downgrade this week hasn’t scared the billionaire set away from T-bills — or average investors, for that matter.
In fact, assets in money-market funds climbed to a fresh record this week of $5.52 trillion, according to data Thursday from the Investment Company Institute. The roughly $29 billion influx was driven primarily by cash moving into government funds, where short-dated paper is yielding north of 5%.
… Catch the Falling Bond
But while cash is hot, the long-end of the Treasury curve has gotten absolutely hammered this week. Long-duration Treasuries are on track for their worst week of 2023, with yields on 30-year bonds rocketing nearly 25 basis points higher this week to about 4.26% — the loftiest levels since November. It’s a similar story for benchmark 10-year notes, which have climbed more than 20 basis points this week.
That’s good news for Ackman’s “in size” short bet against 30-year bonds, and for the likes of Bill Gross as well. The former chief investment officer of Pacific Investment Management Co. took to X to say that he is “overall bearish” on 10-year Treasuries, and that the yield curve may disinvert from the benchmark yield’s ascent.
We’re still a long ways away from positive territory, but the yield curve re-steepening at the hands of the long-bond selloff this week is staggering. The spread between 2-year and 10-year yields is currently negative 73 basis points, versus the negative 105 basis points just last week.
Meanwhile, bond traders are budgeting for further pain at the long-end of the curve. Judging by interest-rate options, investors are paying up in a big way for another leg higher in long-dated yields.
As reported by Bloomberg’s Edward Bolingbroke, a metric that compares demand for bearish put options to demand for bullish call options shows the widest divergence since September for options on CME Group Inc.’s US Treasury Bond Futures contract, which currently tracks a bond that matures in 2039. The gaps are less extreme for options on shorter maturities.
While it had just started to feel like long-duration was the consensus trade, there’s plenty of reasons to be bracing for higher yields right now.
Among them: the US economy is resilient and then some, an eventual Bank of Japan exit from extraordinary easing could mute an important source of bond demand, and the Treasury’s decision to boost auction sizes by more than expected means that a wave of supply is about to hit the bond market.
LPL: Have Treasury Curve Spreads Bottomed?
Key Takeaways:
A busy earnings calendar for equities has largely been overshadowed by volatility in the fixed income market this week.
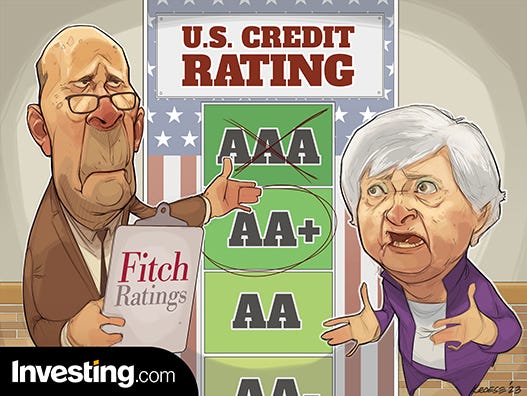
Treasuries stole the spotlight after Fitch downgraded the U.S. credit rating from AAA to AA+, putting added upward pressure on yields. Longer duration Treasuries lagged and a bear steepener curve developed, creating a potential double bottom formation in the closely watched 10-year minus 2-year Treasury curve spread.
Historically, curve spreads have bottomed before five of the last six recessions since 1980, although it took an average of 187 trading days after the bottom for the official recession to start.
Equity market returns following a major bottom in the 10-year minus 2-year Treasury curve spread have historically been positive over the following 12 months. Smaller caps tend to underperform during this period.
… Longer duration Treasuries are underperforming on the week, including the 10-year, whose yield is up over 20 basis points (bps) since last Friday. The jump in 10-year yields triggered a breakout above the March highs at 4.09%, leaving the 4.24%-4.34% range (October/November 2022 highs) as the next major area of overhead resistance. Momentum is also confirming the breakout, including a recent Moving Average Convergence/Divergence (MACD) buy signal and bullish crossover between the 50-day and 200-day moving average (dma).
Volatility on the front end of the curve has been less pronounced, as shorter duration Treasuries are more directly tethered to monetary policy—which remains a higher-for-longer theme. With benchmark 2-year Treasury yields trading nearly unchanged since last Friday, a bear steepener curve has formed as longer-term rates are rising faster than shorter-term rates. As shown on the right below, the recent steepening or dis-inversion of the curve occurred right at support from the March lows, forming a potential double-bottom in the 10-year minus 2-year Treasury curve spread. Technically, a breakout above the declining 200-dma would add to the evidence of the lows being set.
… SUMMARY
Curve spreads have recently steepened after finding support off the March lows, forming a potential double bottom on the closely watched 10-year minus 2-year Treasury curve spread. Technically, a breakout above the declining 200-dma would add to the evidence of the lows being set. While a dis-inversion of the curve often precedes a recession, the lag time between when curve spreads bottom and the start of a recession has averaged 187 trading days. Stocks have also posted positive returns over the following 12 months after a bottom in curve spreads.Yardeni Market Call: Running Into Resistance & Bond Vigilantes
… Meanwhile, the 10-year bond yield has risen above 4.00% in recent days. Better-than-expected economic growth could drive the 10-year TIPS yield up to 2.00% and boost the expected inflation proxy in the bond market as well (charts). A strong employment report on Friday could do that.
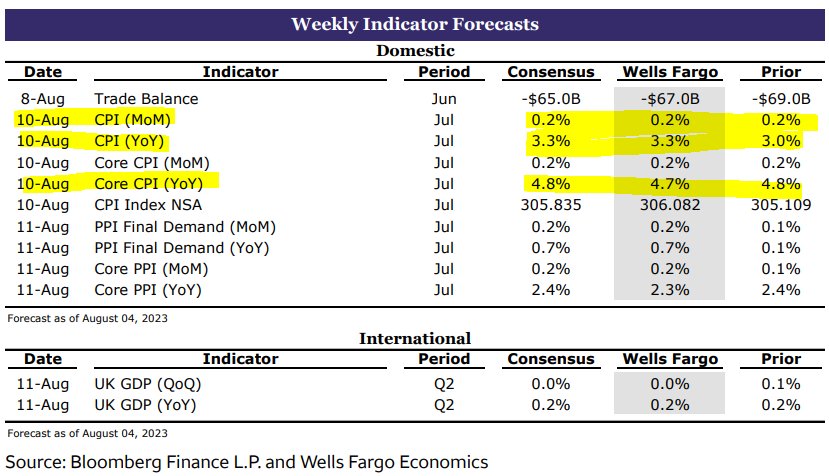
AND for any / all (still)interested in trying to plan your trades and trade your plans in / around FUNduhMENTALs, here are a couple economic calendars and LINKS I used when I was closer to and IN ‘the game’.
First, this from the best in the strategy biz is a LINK thru TO this calendar,
Wells FARGOs version, if you prefer …
… and lets NOT forget EconOday links (among the best available and most useful IMO), GLOBALLY HERE and as far as US domestically (only) HERE …
In closing, here’s one way to define “ARBITRARY”
AND for those in the SOFT LANDING CAMP,
Said another way,
AND … THAT is all for now. Enjoy whatever is left of YOUR weekend …








Great as always Steve!
Bond Breakouts, cool Man! When are all those high-levered bond trade blow-ups from the NIRP & ZIRP yrs going to manifest? And where? Or are there enough Fed 'facilities' to handle the matter? Better yet, create a new 1! Funny no crypto got a 'facility' for 'liquidity'. Thanks!