(USTs mixed, flatter on below avg volumes) while WE slept; CHINA 'flation; duration 'historically oversold' (Bespoke) vs 'new duration supply cycle' (DB); close 10yy long
Good morning … Overnight we’ve learned MORE from China
ZH: China Slides Into Deflation, Despite Jump In Core Print And Unexpected Rebound In Sequential CPI
… Well, we can now say that we were half right. Yes, on one hand, China has no choice but to admit
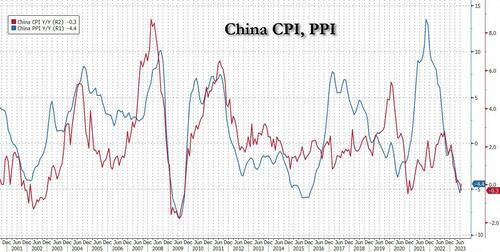
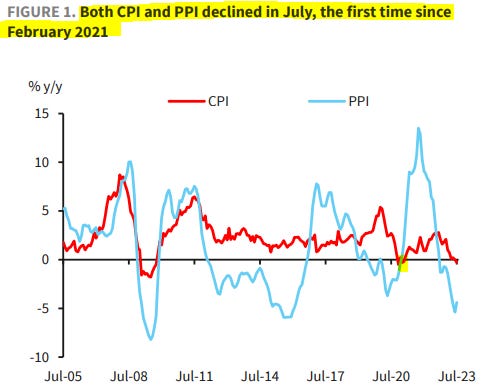
deflation, pardon disinflation (we don't want the Chinese secret police knocking on our door at 3am) had arrived, and sure enough the National Bureau of Statistics, the greatest congregation of goalseek scientists ever gathered, just announced that in July CPI dipped -0.3% Y/Y, down from June's unchanged print but just slightly stronger than the -0.4% Y/Y estimate. At the same time PPI also dropped for the 10th consecutive month, but it appears to have finally hit a bottom and after sliding -5.4% Y/Y in June it dropped ever so slightly less, or -4.4%.In other words, this was the first time since Nov 2020 that both Chinese CPI and PPI printed negative.
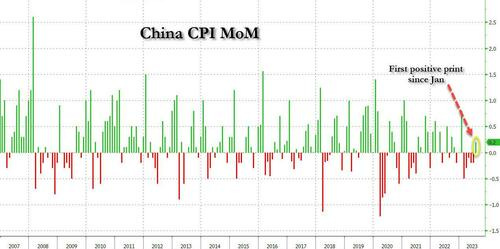
But wait, there's more. Because while China did indeed enter deflation, pardon, disinflation on an annual basis, the sequential number is where the real goalseeking action was: with consensus expecting a drop of -0.1% which would have marked the sixth consecutive monthly decline and the longest stretch on record, after last month's 0.2% decline, Beijing reported that for the first time since February, China experienced sequential inflation of 0.2%.
From that TO … The backdrop to yesterdays trading,
ZH: Quartet Of Carnage Crushes Stocks; Bonds, Bitcoin, & Black Gold Bid
Futures suffered a quartet of carnage into today's US open included a disappointing night of economically-sensitive EPS prints (UPS, CBT, CE, IFF); Chinese trade data bombed, with exports showing the worst decline (-14.5% YoY in July) since Feb 2020, while imports too were crunched (-12.4%) - reflecting weak domestic demand, and iterating ongoing issues with lack of consumption and investment growth in China; Italy's surprise windfall profits tax on banks has spooked EUR banks and broad index; and Moody's cuts 10 US banks (including “super regionals” Capital One, PNC Financial Services Group and Fifth Third Bancorp) on the increased cost of funding and office exposure.
Hmm … Ok SO China mattered yesterday and again overnight into this morning. Got it. Furthermore, this quartet helped persuade folks to become willing and able buyers of 3yy USTs and specifically, those off in far away lands who are dealing with far BIGGER problems than Moodys and Fitch
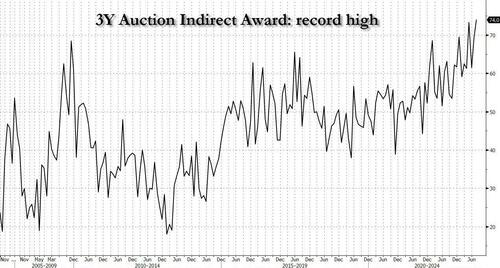
ZH: Record Foreign Demand For Stellar 3Y Treasury Auction
… But it was the internals that were spectacular, with foreign buyers (i.e. Indirects) seemingly untouched by Ackman's latest pleas and the Indirect award - or the percentage of the auction awarded to foreign buyers - was a whopping 74.0%, up from 69.4% and the highest on record!
Leads to the question — will reverse concession get in way of today’s 10yr auction?
Momentum coming off the boil and yields have broken back into triangulated levels (upper bound of which in / around 4%) and would be good / healthy to see time at a price ahead of this afternoons liquidity event. With little in way of US fundamental data ahead of 1pm, you will be watching for ‘usual suspects’ to throw that curve.
Interesting to note — just below — a large French bank NOT waiting around to catch whatever curves are thrown but is, instead, taking a few basis points OFF the table from a recent buy on the dip.
BNP QTOW: Closing tactical UST 10y long
… However, given the extent of the rally and upcoming event risk (US CPI, 10y and 30y auctions), we favour closing the trade at current levels …
While this question remains — who or IF anyone willing to take on 10yy debt today, the answer may be hiding in plain sight as ‘Merica seems ready / willing / able to take on debt of other forms … to whit,
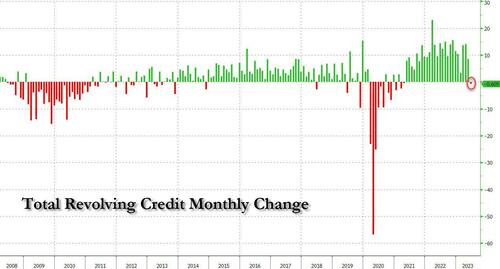
ZH: Credit Card Balances Hit Record Above $1 Trillion, Suffer "Pronounced Worsening" Amid Surge In New Delinquencies
Once a quarter, the Fed publishes its Household Debt and Credit report which provides a (lagging) snapshot of household finances in the previous quarter. And while the report gives little incremental data to those who follow the Fed's monthly Consumer Credit (G.19) statement, which just yesterday revealed the first decline in credit card debt since April 2021...
... it does provide a convenient snapshot of recent trends in Household balance sheets.
With that in mind, here is the punchline of the latest report: as of June 30, the Fed found aggregate household debt balances increased by $16 billion in the second quarter of 2023, a modest 0.1% rise from 2023Q1. Balances now stand at $17.06 trillion and have increased by $2.9 trillion since the end of 2019, just before the pandemic recession…
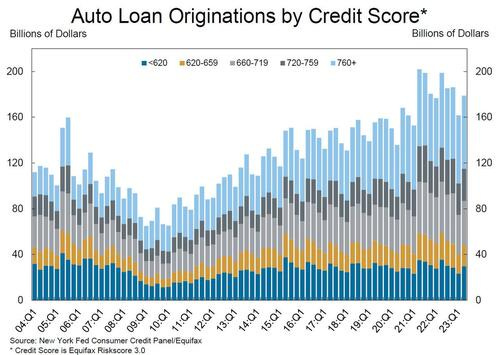
… At the same time, the volume of newly originated auto loans, which includes leases, was $179 billion, largely reflecting high dollar values of originated loans even as the number of newly opened loans remains below pre-pandemic levels.
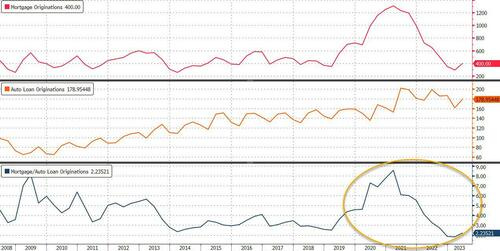
Think about that for a second: the above charts show that while the Fed crushed mortgage originations with the highest interest rates in 40 years, it has had zero impact on auto loan originations. In fact, after peaking at 9 two years ago, the ratio of new mortgages to new auto loans has collapsed to a near record low 2.2. It does beg two questions: i) where are Americans still getting the money to fund all those near record auto loans, and ii) what happens to all those auto loans on various bank books once the payments stop.
The New York Fed also issued an accompanying Liberty Street Economics blog post examining trends in credit card lending and repayment. The blog found that, despite the toll inflation has taken on consumers, there is little evidence of widespread distress on households for now; that's however is about to change...
Going down the list, aggregate limits on credit cards were increased by $90 billion in the second quarter, a 2.0% increase from the previous quarter. As noted above, credit card accounts expanded by 5.48 million to 578.35 million, or roughly 2 credit cards for every adult…
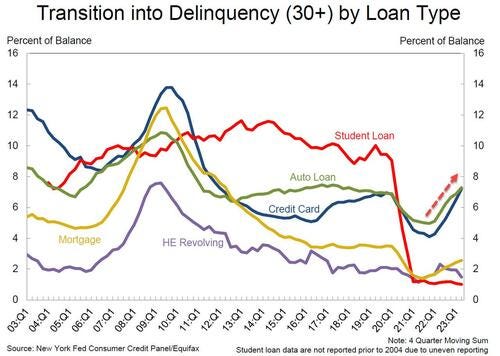
… the bad news is that the share of debt newly transitioning into delinquency increased for credit cards and auto loans has been quietly surging with increases in transition rates of 0.7% and 0.4%, respectively.
And I’ll end my rant on THAT note … sorry. NOT sorry. Highly recommend a full read through of the ZH SNARK as well as FULL REPORT from FRBNY … here is a snapshot OF USTs as of 705a:
… HERE is what this shop says be behind the price action overnight…
… WHILE YOU SLEPT
Treasuries are mixed to slightly flatter as markets hit a data air-pocket before US CPI. China deflationary releases overnight (July CPI -0.3% YoY, PPI -4.4% YoY) saw limited reaction outside some APAC risk-asset positivity, SHPROP +0.6% and KOSPI +1.2%. A bullish tweak to the Italy bank tax announcement yesterday has also seen the FTSE MiB and SX7E bounce back ~2%, while a slightly weaker DXY has seen crude resume its climb over $83.50 with another sharp pop seen in EU natural gas prices (FN1 +12%). With 10y UK and German auctions going off without a hitch, we modest underperformance in core and semi-core EGBs, while volumes in USTs has fallen towards 75-80% of the 30d average on rangey px-action overnight. US swap spreads are also well-behaved after yesterday’s ~10.1bn in IG supply on 9 deals.
… and for some MORE of the news you can use » The Morning Hark - 9 Aug 2023 — to help weed thru the noise, this daily compilation is organized and then dumped into your inbox ‘bout 345a and is well worth its weight in gold … IF, on the other hand, yer looking for complete list OF the noise to weed through, head over here TO Finviz.
From some of the news to some of THE VIEWS you might be able to use… here’s SOME of what Global Wall St is sayin’ … I’m paying close attention TO all things CHINA related (Barclays, CSFB, Yardeni and UBS for example)
Advisors Asset Management: Markets Have Let Their Guard Down, But the Bout with Inflation is Far from Over…
… Based off the most recent economic data, the economy remains strong especially when it comes to the labor market. The unemployment rate currently sits at 3.6% and Job Openings are still coming in over 9 million. According to the Atlanta Fed, the latest Q3 GDP estimates came in at 3.9%, up from 3.5% on July 28. If 3.5%+ GDP ends up being in the cards, it is unlikely that inflation will continue to trend lower. If these expectations come to fruition, we can only assume it will embolden the Fed to remain hawkish and continue to hike and hold for an extended period. Similar once again to the '70s, a lengthened policy stance in restrictive territory will likely be required as Fed officials seem to be aware that a second wave of inflation is possible. One could argue that the '70s had three waves of inflation, and as a result, multiple episodes of restrictive monetary policy.
It appears, based on leading indicators such as commodities, a second wave of inflation may have already begun. Energy, Food and Core are the three categories that make up the broad headline CPI number. When looking at commodities, the most significant factor with “Energy” is illustrated with a chart of the past year showing a consistent downtrend which has partially helped with headline CPI, but there has been a sharp rebound in prices over the past two months. Oil is now trading back around $80 dollars a barrel, pushing the average gas price per gallon at the pump to $ 4.15, the highest since November. Broad commodity prices, some actively traded ETFs are up over 13% since late May. If China decides to enact stimulus measures for their economy, that could put further upward pressure on the space.
… For inflation to continue to come down, the consumer would have to slow spending and we are just not seeing that. As long as the economy remains strong, the Fed will need to remain hawkish to get inflation back to 2%. We have heard Federal Reserve officials, multiple times, mention they are trying to avoid a “stop and go” approach. Jawboning of course, but this further reinforces the Fed’s beliefs that to prevent further “waves,” they will need to “hike and hold” and hold for some time. We believe that the months ahead could unfortunately have some inflation surprises to the upside and spur volatility across financial markets. Couple that with a downgrade of U.S. debt and Christmas might come early for those looking for buying opportunities.
Barclays - China: CPI and PPI likely bottoming out
Headline CPI turned negative for the first time since Feb 2021, while core and services CPI picked up modestly. Overall, outright deflation in CPI and PPI, along with disappointed trade and softer PMIs, reaffirmed weak growth in July. While it is likely to stay soft in H2, we think CPI has likely hit its near-term bottom.
Bespoke - Long End Historically Oversold
… Treasury yields at the long end of the curve are once again rising today with the yield on the 30 year up 3.3 bps as of this writing. That is in the context of what has already been a dramatic move higher in yields of long term Treasuries. As we discussed in Friday's Bespoke report, the ETF tracking longer-dated Treasuries, the iShares 20+ Year US Treasury ETF (TLT), fell 1% or more three days in a row last week (prices fall when yields rise). Meanwhile, that move higher in long end yields has also been observed in other places of the world like Germany, as discussed in today's Morning Lineup.
Given the steep rise in yields and hence a drop in the price of TLT, the ETF is trading at extremely oversold levels. While it has come back slightly and is currently 2.66 standard deviations below its 50-day moving average, at the most oversold reading last Thursday, TLT traded 3.84 standard deviations below its 50-DMA. In its over 20 years of history, that is the most oversold reading on record.As shown above there have only been a handful of other periods in which TLT has fallen at least three standard deviations below its 50-DMA as it did last week. In most circumstances, when an asset reaches such extreme levels of oversold, the thinking is that some upside mean reversion can be expected. However, the exact opposite has played out for TLT historically…
BNP QTOW: Closing tactical UST 10y long
The recent rates rally has seen risk appetite and valuation residuals normalise.
The MarFA™ Macro fair value for UST 10y continues to hover around 3.90%.
However, given the extent of the rally and upcoming event risk (US CPI, 10y and 30y auctions), we favour closing the trade at current levels.
We are therefore closing our tactical UST 10y long for a profit of 15bp.
CSFB - China Data: Deflation arrived as expected
China’s headline inflation fell 0.3%yoy in July from 0.0%yoy in June, compared to the market consensus of -0.4%yoy, being the first negative year-on-year headline CPI reading since February 2021. Core inflation (excl. food and energy) rose 0.8%yoy in July from 0.4%yoy in June. (See Figure 1.) The moderation in headline CPI was partly driven by a high base of food prices last year in July. On the other hand, non-food CPI inflation rose led by rising crude oil prices and services (mostly tourism). (See Figures 2 and 4.) Fuel inflation recovered to -13.2%yoy in July from -17.6%yoy in June and services inflation accelerated due to summer holidays. Tourism CPI spiked 13.1%yoy in July from 6.4%yoy in June owing to the holiday seasonal factors.
In sequential terms, the month-on-month decline in food prices was broad based, including in poultry, pork, eggs, fresh fruits, fresh vegetables. (See Figure 3.) Of note, the price trend for traditional Chinese medicine CPI has been accelerating in the past seven months, registering at 1.1%mom in July from 0.8%mom in June. In our view, services inflation will likely remain robust in the summer holiday season and food prices could see some rebound in August amid the severe flooding. The recent rice export ban from India will likely have limited impact on China’s food inflation amid the inventory stockpiling in the past few years (details in the report).
PPI deflation moderated -4.4%yoy in July from -5.4%yoy in June (Figure 6) owing to some fading of base effects and higher global commodity prices. The continued deflation in PPI along with the soft NBS manufacturing PMI underscores the pressures on manufacturing sector this year.
Going forward, we expect PPI to bottom out by 3Q 2023 given the recent rebound in certain global commodity prices. PPI of upstream sectors could likely rebound on rising prices of crude oil and non-ferrous metals, but we believe, the PPI deflation will persist in the coming months.
Though there could be some encouraging signs in consumption demand during the summer holiday season, we think broader household consumption recovery is still under pressure. The slowdown in growth momentum signals weak domestic demand and a more challenging deflationary environment. We continue to expect the PBoC will provide more monetary policy easing through liquidity measures such as a 25bp RRR cut.
DB - A new duration supply cycle
The supply of duration in the Treasury market is set to rise in a big way. After last week’s refunding announcement, the Treasury will be auctioning off $246bn in nominal coupon securities in August. Adjusting for duration, this supply is worth approximately $185bn in 10yr note equivalents, the most since early 2022 when auction sizes were also large but on their way down. It’s worth noting that the latest Treasury auction increases skewed toward longer maturities, resulting in a bigger duration increase.
US rates is now at the beginning of a new duration supply cycle, which we estimate could run well into 2024. The last cycle boom came in May 2020, when the 20yr bond was added back to the Treasury auction calendar. The yield curve and term premium increased substantially not long after. While Covid and unconventional monetary policy at the time added significant distortions to the market, the impact of duration supply on rates should not be discounted fully. The term premium also displayed similar dynamics to the smaller supply cycle in 2018-2020. The correlation coefficient of changes in duration supply and 10y term premium is 0.48 since 2018.
In recent pieces we have highlighted the connection between global free float and term premia, grounded in a similar framing of the supply-demand shift. On both metrics there would be further upside to the US term premium, which keeps us favoring steepeners.
UBS - Why China’s falling prices are a local affair
China’s July consumer price inflation rate turned negative, joining producer prices in deflation (in year-over-year terms). On official numbers, China ranks behind the US and ahead of the EU in terms of size. Why does China’s deflation not matter more to the rest of the world?
Any country’s consumer price inflation is a local affair. The biggest part of consumer prices are domestic labor costs. Countries have different items with different weights in their consumer price calculations—so what drives inflation in one country may be of little importance in another. While producer prices might be assumed to influence China’s export prices, the relationship is loose—and China’s export prices have a limited relationship to consumer prices in other countries (US labor generally gets most of the price a US consumer pays for a Chinese import).
US banks reported an increase in losses on lending in the second quarter. The rise means losses are now more normal, stressing the “landing” part of the soft landing. It suggests that the availability of savings is now more limited. This is more likely to affect lower income households, who have less spending power...
Wells Fargo - Home Stretch: How Untapped Equity Could Sustain the Consumer
As excess household savings dry up and as consumer credit is both more expensive and harder to get, households have become more reliant on income growth. But many households today have the benefit of a second line of defense to support spending should the need arise. Homeowners have more equity in their homes today than they did at any point in the 35 years between 1987 and 2022. Yes, higher rates make borrowing more expensive, but a home loan generally carries far lower interest than credit card debt, especially after accounting for the tax deductibility of interest on a mortgage. Even if households do not borrow another nickel, there is scope for the refinancing that has already occurred to help sustain consumer spending.
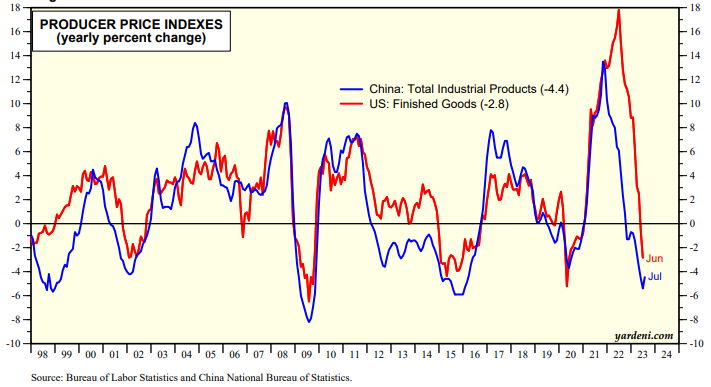
Yardeni - China Exporting Deflation to US
The US doesn't have to experience a recession to bring inflation down if China's export prices are falling because China is already in a recession. Consider the following:
(1) This evening we learned that China's CPI fell 0.3% y/y during July, the first such drop since February 2021. The PPI fell 4.4% over the same period (chart).
(2) The CPI inflation rate excluding food in the US tracked the comparable Chinese measure from late 2008 through early 2020, before the pandemic started (chart). They've diverged significantly since then with the former well exceeding the latter. China's measure was unchanged y/y through July. The US measure was 2.7% through June. It would be quite a surprise if they converge again somewhere in the middle, maybe.
(3) There is even a closer fit between the Chinese and US PPI inflation rates (chart). The latter will be released on Friday for July. It was down 2.8% during June. It probably fell deeper into deflation territory during July.
And finally, this mornings edition of I THINK THEY ARE TRYING TO TELL US SOMETHING,
FRBSF Working Papers - Monetary Transmission through Bank Securities Portfolios
Abstract
We study the transmission of monetary policy through bank securities portfolios for the United States using granular supervisory data on bank securities, hedging positions, and corporate credit. We find that banks that experienced larger market value losses on their securities during the monetary tightening cycle in 2022 extended relatively less credit to firms. Such a spillover effect was stronger for (i) available-for-sale securities, (ii) unhedged securities, (iii) low-capitalized banks, and (iv) banks that have to include unrealized gains and losses on their available-for-sale securities in their regulatory capital. Our findings provide evidence for a forceful transmission channel of monetary policy that is shaped by the regulatory framework of the banking system.
In other words, what we think they think works, they now have a paper saying it does … Monetary policy channel (portfolio balance model — more from 1979 HERE) alive and kicking and monetary policy — working with a lag — will continue to BLUNT INFLATION.
And speaking of the ‘flation, CPIMANIA starts in 3, 2, 1 …
AND … THAT is all for now. Off to the day job…







Investing.com does have some good comics. Will anything top, after Trump signed the CARES Act, their comic of Trump, Powell, and The Mnuchin, riding in their helicopter, showering the masses with the bag o' money? Any chance we can get a repost of that Big Steve? Thanks!
https://www.investing.com/analysis/comics/fiscal-policy-stimulus-fight-coronavirus-386