(USTs bull flattening on ~190% of 30d avg volumes)while WE slept (China data); mtg rates + gas prices = PAIN; "Pain Trade Is For A Steeper Yield Curve"; "Bond v Stock Barometer"
Good morning … Weak data overnight (China) has given bond markets a(nother)BID.
This presents a ‘challenge’ as an increasing amount of Treasury supply will have to be digested. At the same time, it gives us all something to talk about in as far as what exactly we’re importing from China (de / dis - inflation) and so, is the Fed ultimately going to be ‘winning’ on all fronts?
With Yellen and the Dept of Tsy about to put the FUN back in reFUNding, a look at this afternoon’s upcoming 3yr liquidity event as rates have a BID this morning …
… Momentum has shape shifted from overSOLD to now moving towards overbought (not quite there yet) AND as 3yy are approaching 50dMA (4.389) — resistance?? Zooming OUT a touch, looking at 3yy MONTHLY,
(note MOMENTUM here overSOLD — green arrow, bottom RIGHT — and this can / will resolve in a couple ways — time at a price OR a bullish cross and yields will DROP — something to consider depending upon which of the narratives you are currently subscribed…)
Here’s a note caught MY eyes which leans towards the Camp Recession, consumer PAIN and so, slower growth and ultimately, lower prices (? i think ) so … a Fed WINNING?
This from Bespoke on PAIN POINTS
Two of the biggest pain points for US consumers are mortgage rates and gas prices. When we combine the two by simply adding the average 30-year fixed mortgage rate to the average cost of a gallon of gas, you can see below that this "pain" reading has just ticked back up to 20+ year highs. Bankrate.com's national average 30-year fixed mortgage rate rose to 7.38% at the end of last week. At the same time, AAA's national average for a gallon of regular unleaded gas ticked up to $3.83. Gas prices are now at their highest levels since last October, while mortgage rates haven't been this high in 23 years.
Said another way, ‘What’s your prediction for the fight’?
AND with the idea of PAIN in mind (see below for what it might / COULD mean as far as setup in BOND markets) … here is a snapshot OF USTs as of 705a:
… HERE is what this shop says be behind the price action overnight…
… WHILE YOU SLEPT
Treasuries are bull-flattening alongside a core market short-squeeze, dismal China trade data compounded by Italy bank tax news (see Citi round-up here) and US bank credit downgrades from rating agency. The 30y JGB auction was also quite strong (highest bid-cover in 17-months), suggestive of budding real$ demand. APAC risk sold off (ex-Japan) with SHCOMP -0.4% and HSI -1.8%, while Eurostoxx are leading downside with SX7E -3.7% and the DAX -1.1%. S&P futures are -24pts here at 7am, while US 2s10s is 5.5bps flatter. DXY is +0.5%, while commodities are having a rough go: CL -1.5%, HG -2.2%, BCOMAG -1%. UST volumes are running ~190% the 30d average.
… and for some MORE of the news you can use » The Morning Hark - 8 Aug 2023 — to help weed thru the noise (some of which can be found over here at Finviz).
From some of the news to some of THE VIEWS you might be able to use… here’s what Global Wall St is sayin’ …
Argus Daily: Stock Valuations Push Higher
Our bond/stock asset-allocation model is indicating that bonds are the asset class offering the most value at the current market juncture, as interest rates have risen over the past few quarters and stocks have recovered some ground. But stocks are not yet seriously overvalued. Our model takes into account levels and forecasts of short-term and long-term government and corporate fixed-income yields, inflation, stock prices, GDP, and corporate earnings, among other factors. The model output is expressed in terms of standard deviations to the mean, or sigma. The mean reading from the model, going back to 1960, is a modest premium for stocks of 0.15 sigma, with a standard deviation of 1.0. The current valuation level is a 0.80 sigma premium for stocks, which is inside the normal range but up from 0.50 at the beginning of the year. Other measures also show reasonable valuations for stocks. The current forward P/E ratio for the S&P 500 is 18x our 2024 estimate, within the normal range of 10-21 and down from 22 a year ago. And the current S&P 500 dividend yield of 1.5%, while below the historical average of 2.9%, is up from 1.2% as recently as 2021. Based on current valuation levels, as well as our interest rate and earnings forecasts, we have called for a recovery in stock prices in 2023 and have boosted our year-end S&P 500 target to 4,600. Our recommended asset-allocation model for moderate accounts is 67% growth assets, including 65% equities and 2% alternatives; and 33% fixed income, with a focus on opportunistic segments of the bond market.
Barcap China: July trade: Insufficient demand lingering
Weaker-than-estimated exports and a big miss in imports, along with modest PMI prints, and high-frequency auto and property sales data, paint a gloomy picture for the economic recovery entering Q3. We look for stepped-up, targeted policy responses from the government to boost demand and lift sentiment.
Bloomberg (via ZH): Pain Trade Is For A Steeper Yield Curve
Authored by Simon White, Bloomberg macro strategist,Friday’s jobs data sparked a relief rally in bonds and a flatter yield curve, but the pain trade is still for higher yields and a steeper curve – the lesser-spotted bear steepener – with this week’s CPI a potential catalyst.
Last week was a turbulent one for bonds, but the continued softening in payrolls data served to remind the market that supply and fiscal-profligacy fears have to be counter-balanced with an economy that’s in its late-cycle stages.
After the data, 10-year yields took the elevator back down to sub-4.05% after briefly going above 4.20%. They have since clambered back to 4.12%, but their next cue is likely to come from Thursday’s CPI report. Headline is expected to nudge back up to 3.3% (from 3% last month), mainly due to base effects, and core is expected to hold steady at 4.8%.
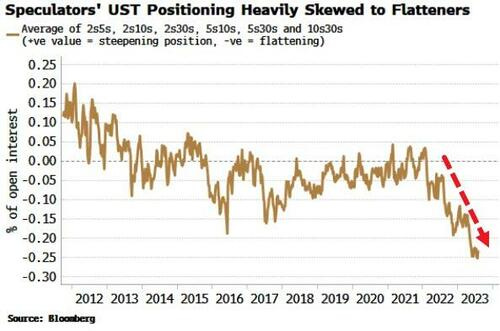
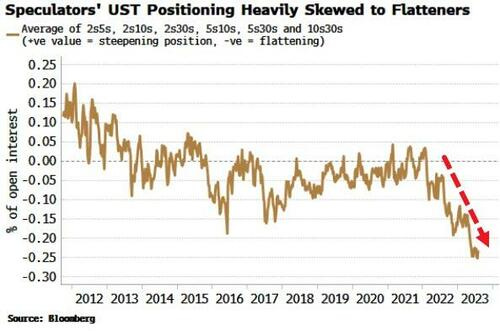
Still, stronger-than-expected data probably means higher yields in a market more acutely alert to inflation (and therefore supply) risks. As with last week, term premium would likely drive the move, meaning a curve steepening. After relentlessly flattening for the last two years, the pain trade is for a steeper curve. Implicit positioning of speculators from the COT report shows there is a heavy skew to a flatter curve.
The negative carry for most flatteners remains punitive (for 2s10s USTs it’s ~83bps over a year), but the large upside potential from supply/inflation worries and the covering of positions begins to make that look less insurmountable.
Finally, the Bundesbank’s decision to stop paying interest on domestic government deposits - which initially pushed short-term
German
bonds higher this morning - highlights the broader issue of central banks paying interest on reserves when they are superabundant.
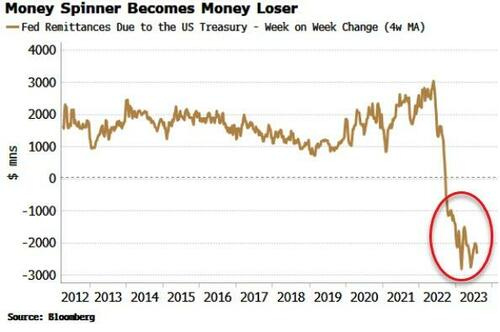
In the days of QE and 0% interest rates, the ECB and Fed at al. remitted money to their treasuries from the income on their bond portfolios.
But now that is reversed as bond income is dwarfed by the cost of paying interest on trillions of bank reserves. Take the Fed, whose debt to the Treasury is now accruing at over $2 billion each week.
This is something that will become more politically contentious, especially as economies continue to slow and cost-of-living pressures bite further.
CitiFX discussing some WARNING SIGNS
… A rally across the curve
US 2yr Yields: Last Friday, they broke past the bottom of the range (4.81%) upon which it has been in for the past 10 trading sessions.
It has done this whilst posting a significant bearish outside day.
All in all, it suggests the path of least resistance is for lower yields. For more context, check out CitiFX Techs- Chart of the Day: End in 2yr yield range?
US 10yr Yields: It closed week below the 4.08% (76.4% Fibonacci retracement from the recent low to high) - 4.09% (March 23’ and July 23’ highs) pivot level.
Additionally, it did so by posting a significant bearish outside day.
Importantly, on the weekly chart, it posted a clear shooting star - bringing it below the pivot line. In the past, weekly shooting stars have led to multi-week rallies in 10’s.
DBs US Economic Perspectives - Getting real about rate cuts: Four scenarios for '24 rate reductions
In his press conference following the July FOMC meeting, Chair Powell was quizzed about the conditions under which the Fed would cut rates. While he was, expectedly, non-committal on the quantitative thresholds to trigger these decisions, he continued to view preventing real rates from rising sharply as inflation falls as a key consideration for rate cuts.
We consider what policy rules would imply for the timing and pace of rate cuts in 2024 under different economic scenarios. The four scenarios we consider are: (1) DB's house view for a mild recession starting in Q4 2023; (2) The Fed's median forecast from the June SEP; (3) An immaculate disinflation where inflation drops precipitously without strain in the labor market; and (4) A no landing scenario where inflation remains high and the labor market tight.
Our policy rule analysis finds a pretty consistent message: Absent a no landing-type scenario, the Fed is likely to begin to cut rates in the first half of 2024 and that significant rate reductions could follow over the remainder of the year. Under the no landing scenario, the Fed could well hold rates above 5% into 2025. We conclude by discussing whether these signals from policy rules should be relied upon in the current economic environment.
… Rate cuts in the immaculate disinflation scenario, in which the unemployment rate rises to around 4% at most, could prove more contentious for the Committee. Powell and his colleagues have provided the logic for cuts under this scenario: If the Fed does not cut rates as inflation falls, they could become passively more restrictive as the real fed funds rate rises. Therefore, to avoid becoming overly restrictive, the Fed would cut rates to maintain an appropriate policy stance.
While this logic is compelling, it may also be incomplete. If growth and the labor market remain resilient, with the unemployment rate staying at or below the Fed's long-run view of the unemployment rate of 4%, the Fed would have to choose between cutting rates to follow inflation lower even if the economy is not showing stresses versus maintaining some additional monetary firepower to be able to respond to an actual growth shock at some later date. Under this scenario, at the very least we would expect the Fed to respond by cutting rates later and less aggressively than implied by the policy rules.
DB on Forward steepeners during Fed pauses
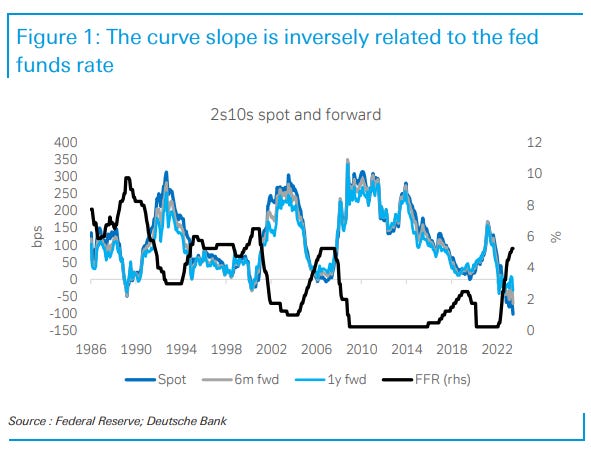
This piece examines the historical performance of forward 2s10s steepeners during Fed pauses following hiking cycles.
While there aren’t many modern post-Volcker cycles to draw on, the analysis yields a few interesting if unsurprising results: (i) returns to forward steepeners during Fed pauses have been high on average but variable; (ii) forward steepeners through Fed pauses have almost never realized losses on a hold-to-maturity basis, and; (iii) all of the returns to forward steepeners have come from the long front-end leg, as the Fed has historically eased by more than markets were ex ante pricing.
This third point underscores that forward steepeners today are primarily leveraged to the path of Fed policy over the next few years, and in particular whether the Fed winds up cutting more than market pricing. The market is pricing more cuts than it ever has historically, but we forecast the fed funds rate to come in materially below current OIS rates in 2024-2025, supporting our recommended forward 2s10s SOFR steepener. We also expect structural factors to boost long-end term premia and contribute to a steeper curve…
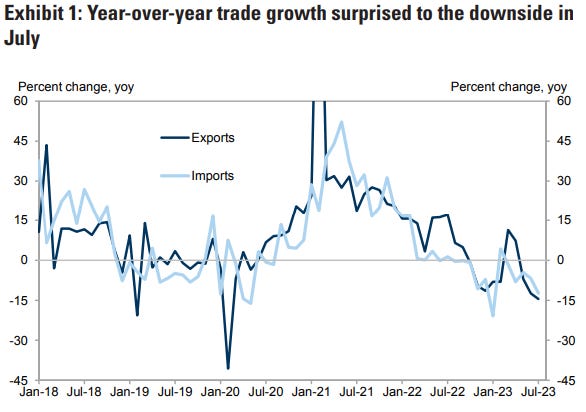
GS China: Trade data surprised to the downside again in July
Bottom line: Both export and import value declined sharply in July in year-over-year terms, below the consensus forecast. The weakness in exports was broad-based across major trading partners and products, suggesting soft external demand. The import value of commodities declined somewhat on a year-over-year basis, partially due to a high base of commodity prices last year. China's trade surplus rose further in July (US$80.6bn vs. US$70.6bn in June).
ING: US consumer spending remains vulnerable to credit dynamics
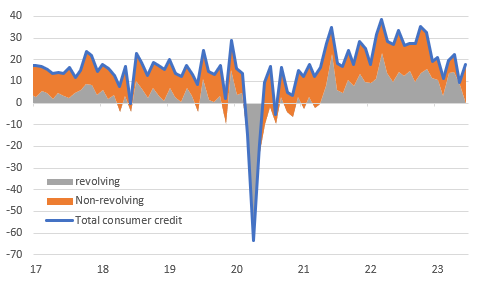
Consumer credit grew more than expected in June, led by car loans, but credit card spending contracted as borrowing costs hit record highs. With banks increasingly reluctant to finance consumer credit and with consumer spending responsible for two-thirds of economic activity, consumption expenditure looks set to come under intensifying pressure
Consumer credit on a softening trend
The June US consumer credit data, published by the Federal Reserve, is stronger than expected, rising $17.8bn to stand at a total of $4.977tn. The consensus was looking for a $13bn increase while there was an upward revision to borrowing in May of around $2bn. Nonetheless, the trend is one of softening growth in consumer credit, particularly for revolving credit, which is predominantly credit card borrowing.Monthly change in US consumer credit ($bn)
…While households are likely to continue to run down savings, the excess that was built up during the pandemic will be exhausted by the end of this year based on the trend seen in the past four quarters. Moreover, the latest Federal Reserve Senior Loan Officer Opinion survey showed banks increasingly unwilling to make consumer loans and as the chart below shows, there is a strong 12M lead for this survey in terms of predicting the path ahead for consumer credit.
Fed's SLOOS survey points to steep downturn in consumer credit
UBS: Three reasons trade is slowing
The US offers June trade data today. China already published July trade numbers—they were weaker than expected, and the first quarter’s trade data was revised lower. Economists have been suspicious about China’s first quarter export data (China’s reported exports were not matched by other countries’ imports). Revising the numbers now suggests weaker first quarter GDP.
The slowing of trade (except for cars and mobile phones) reflects three trends. First, there is a soft economic landing, which means demand volumes will slow (and prices are subject to disinflation). Second, there is a switch from spending on goods to spending on services—some of the demand surge in 2021–2 was cannibalizing demand from future years. Third, deglobalization (political barriers to trade) and localization (more efficient to produce near consumers) are changing trade patterns. Mexico overtook China as the US’s largest trading partner this year.
Slowing demand was evident in the UK’s July BRC retail sales data, which fell in real terms (although wet weather will not have helped). Japan’s household spending fell more than expected in June, with real wage growth still negative.
ZH: Consumers Finally Crack: Shocking Drop In June Credit Card Debt Marks End Of Spending Binge
AND … from the intertubes, a couple things on POSITIONS which I found somewhat informative,
Hedgopia: CoT: Peek Into Future Through Futures, How Hedge Funds Are Positioned
No sooner did the 10-year treasury yield break out of 4.09 percent, which resisted rally attempts in February and early July, than it went back under by the end of the week, touching as high as 4.21 percent intraday Friday but finishing the session at 4.06 percent. Last October’s high of 4.33 percent, therefore, stands; from that high, yields dropped to subsequently bottom at 3.25 percent in April.
Despite Friday’s intraday reversal, the 10-year has been chirping along for a while now. The long end of the yield curve is not on the same page with fed funds futures, where traders are not only betting that the fed funds rate has peaked with last month’s 25-basis-point hike to a range of 525 basis points to 550 basis points but also that the Federal Reserve would begin to cut next March and that the benchmark rates would end 2024 between 400 basis points and 425 basis points.
For the central bank to lower rates with that aggression, the economy needs to meaningfully decelerate from here or even enter recession. The 10-year yield is nowhere near as pessimistic. Bond bears are probably also paying attention to the budget deficit and the accompanying need to issue more debt, even as the Fed is reducing its holdings of these securities (more on this here).
This explains why non-commercials continue to sit on boatloads of net shorts in 10-year note futures. The supply-demand dynamics favor them, with the caveat that at some point this will all be in the price. A takeout of 4.09 percent, followed by a higher high past last October’s high will have meaningfully changed the odds in their favor. Until then, the risk in the quarters ahead is that fed funds futures traders will have nailed it – which then would have helped pull the 10-year yield lower.
ZH: Hedge Funds Added To Record Treasury Shorts Ahead Of Yield Plunge, JPM 'Tactically Long' 5Y Bond
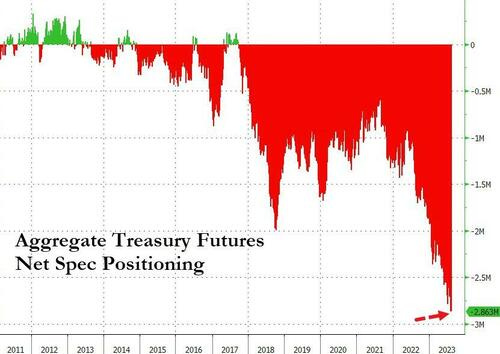
… The aggregate Treasury Bond futures position pushed to a new record short across the whole curve...
Right before yields puked Friday...
But, as Bloomberg notes, there is a big divergence between hedgies and traditional investors.
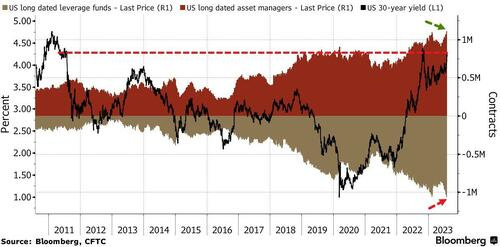
Leveraged fund increased net-short positions of longer-maturity Treasuries derivatives to the most since figures going back to 2010, according to an aggregate of Commodity Futures Trading Commission data for the week to Aug. 1.
Asset managers took opposite bets, taking their own net-bullish positions to an all-time high.
ZH goes on to talk about CALL VOLUMES on TLT (visual, etc) … an interesting and thought provoking note IMO … as those of us (like me) now attempting to play along from home watching not only what they SAY the think but also what THEY do and where they are putting their money … Like FLATTENERS for example …
… Additionally, as we highlighted earlier, stronger-than-expected data probably means higher yields in a market more acutely alert to inflation (and therefore supply) risks. As with last week, term premium would likely drive the move, meaning a curve steepening. After relentlessly flattening for the last two years, the pain trade is for a steeper curve. Implicit positioning of speculators from the COT report shows there is a heavy skew to a flatter curve.
The negative carry for most flatteners remains punitive (for 2s10s USTs it’s ~83bps over a year), but the large upside potential from supply/inflation worries and the covering of positions begins to make that look less insurmountable.
Ahead of Thursdays CPI some ‘official’ inflation speak via a FRBSF Economic Letter,
FRBSF Economic Letter: Where Is Shelter Inflation Headed?
Shelter inflation has remained high even as other components of inflation have fallen. However, various market indicators, including house prices and rents, suggest that the housing market has slowed significantly with the rise in interest rates. Forecasting models that combine several measures of local shelter and rent inflation can help explain how recent trends might affect the path of future shelter inflation. The models indicate that shelter inflation is likely to slow significantly over the next 18 months, consistent with the evolving effects of interest rate hikes on housing markets.
… The dashed line in Figure 3 presents our baseline forecast of year-over-year shelter inflation over the next 18 months based on the average of cumulative shelter inflation forecasts at the CBSA level. Blue shading shows the area in which 95% of the model’s out-of-sample forecast errors fall, indicating the range of confidence regarding the accuracy of our model estimates. The solid line plots actual year-over-year shelter inflation.
Our baseline forecast suggests that year-over-year shelter inflation will continue to slow through late 2024 and may even turn negative by mid-2024. This would represent a sharp turnaround in shelter inflation, with important implications for the behavior of overall inflation…
Finally and in addition TO NFP recaps and victory laps, some ‘official’ stories of the labor market,
St Louis FREDs Stories about the labor market
Who is employed, who is unemployed, and who’s not in the labor force? Data that answer these questions are reported by the US Bureau of Labor Statistics (BLS) using the Current Population Survey (CPS) conducted by the US Census. FRED has monthly data on the CPS starting on January 1, 1948, which translates into 906 data points between that date and July 1, 2023. Today, we use that happenstance to celebrate this, our 906th FRED Blog post. Yes, we are that data-nerdy.
Take a look back and you’ll see that the FRED Blog has tapped into many of the 8,449 data series from the Household Survey of the CPS to tell the stories behind those numbers. Here’s a sample, including the FRED graph above for the unemployment rate, the most popular series among them on FRED:
Civilian Labor Force: Are labor supply and labor demand out of balance?
Civilian Labor Force Participation Rate: Labor force participation rates of armed forces veterans
Employment: Employment growth after the macro disruptions of COVID and World War II
Employment Population Ratio: What’s the story behind who’s working?
Unemployment Level: Ceasing emergency federal unemployment benefits: A look at the latest state-level data
Unemployment Rate: Comparing unemployment rates by race: The Great Recession vs. COVID-19
Not in Labor Force: A greater number of workers still remain outside the labor force
Labor Force Participation Rate: A closer look at labor in
the U.S.
Multiple Jobholders: Moonlighting in the spotlight
Duration of Unemployment: The unusual duration of unemployment
Losers and Leavers: Unemployed Job Leavers: A Meaningful Gauge of Confidence in the Job Market? (from the BLS)
Entrants and Reentrants: Labor Market Exit and Re-Entry: Is the United States Poised for a Rebound in the Labor Force Participation Rate? (from the Boston Fed)
Labor Force Status Flows: How labor market flows changed
Stay tuned to the FRED Blog as we continue to tap into the CPS to tell interesting stories about the labor market.
AND … that’s ALMOST all for me today … here’s look at ME trying to target a market for free FI markets related newsletter ….
… THAT is all for now. Off to the day job…


