Good morning … Yesterday was another rough one and sifting through all sorts of data feeds this morning, seeing all sorts of visuals and RoCs showing worst day EVER or in several years for this or that specific security. Taking a step back and not looking at the broadest of pictures (thoughts / prayers with those up in Lewiston, ME as well as remaining with those in harms way in Israel), and focusing on markets …
… It was a bruising day yesterday for 60/40 portfolios as 10yr US yields rose +13.2bps with the S&P 500 -1.43% and the NASDAQ -2.43% (the worst drop since Feb and -10.7% from YTD highs in July) after the previous night’s tech results were digested. The sell-off continues overnight in Asia trading. The ECB meeting, Q3 US GDP and Amazon’s results after the bell are the highlights today. -DBs Jim REID
… more from Jim below and with this bit in mind, I cannot help but ask if anyone else named Bill might wish to come forward and suggest a short is covered OR perhaps a long has been initiated? Anyone? Bueller … Bueller…
Well, 2s were mediocre (or SOLID, you choose) and that set the table for 5s …
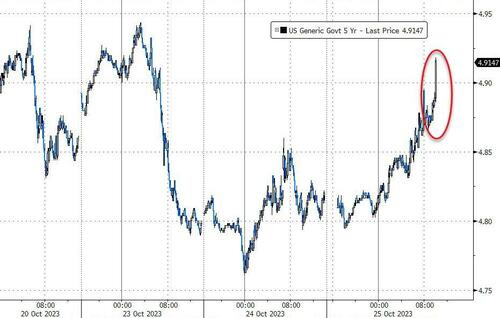
ZH: Yields Jump After Gruesome 5Y Auction Prices With Biggest Tail In 15 Months
… The auction was so ugly, the bond market was rocked wider with the 10Y rising as high as 4.95%, and fast approaching the key level of 5.00% where yields halted their retreat earlier this week.
… to say NO BUENO might be understatement so I won’t even ask you for your opinion OF what this means for this afternoons 7s …
Trend in place MOST of this year and with my now much more limited capabilities, attempt here (above) to show a couple ‘regressed’ degrees of this trend. We’re middling and with moment (stochastics, bottom panel) nearer oversold than overbought BUT far from a BUY signal … hard to say anything other than there’s some amount of HOPE recent highs (5.027%) north of 5% would then attract buyers. That would mean, though, there is still NEED for some sort of … concession.
Will today’s auction be a LUCKY 7s or, well, not so much so? Perhaps this mornings DATA will help with the bond math …
Bloomberg - US GDP Data to Show Temporary Boost from Summer-Spending Frenzy
Business investment probably slowed, Bloomberg Economics says
Consumers may soon feel the impact of higher interest rates
US economic activity probably expanded at a nearly 5% annualized rate over the last three months amid a bevy of temporary tailwinds, according to Bloomberg Economics.
The first official look at gross domestic product for the July-to-September period, due Thursday from the Bureau of Economic Analysis, is set to show strength in consumer spending alongside slower growth in business investment, Bloomberg economist Eliza Winger said Wednesday in a preview of the numbers.
… Bloomberg Economics projects a shallow recession will begin in the fourth quarter. Their 4.9% prediction for the third-quarter report comes in above the 4.5% median estimate in a Bloomberg survey of outside forecasters.
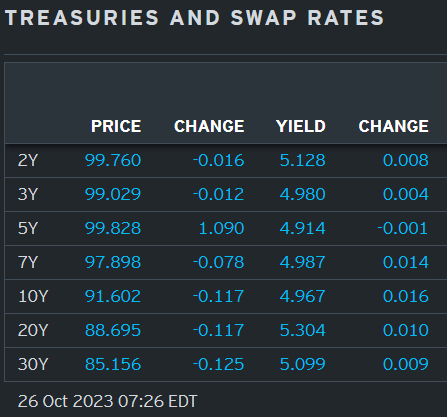
… here is a snapshot OF USTs as of 726a:
… HEREis what ANOTHER shop says be behind the price action overnight…with morning commentary titled, “Take 5%”
… Overnight Flows Treasuries were little changed overnight with a modest bid in the belly of the curve. Overnight volumes were near the norms with cash trading at 97% of the 10-day moving-average. 10s were the most active issue, taking a 36% marketshare while 5s were second at 33%. 2s and 3s combined to take 18% at 10% and 8%, respectively. 7s managed 8%, 20s 1%, and 30s 5%.
… and for some MORE of the news you can use » The Morning Hark - 26 Oct 2023 in effort to to help weed thru the noise (some of which can be found over here at Finviz).
Moving from some of the news to some of THE VIEWS you might be able to use… here’s SOME of what Global Wall St is sayin’ (in a similar sorta way you’ll find content if you pay for ZH PREMIUM … except different … I think, as they seem to be selling others research and I’ve never been quite sure how they can do that … anyways, another time …)
Apollo- Inflation Reaccelerating in Recent Months (ruh roh RelRoy)
Key measures of inflation have reaccelerated in recent months, and supercore inflation at 4% is too high compared with the Fed’s 2% inflation target, see charts below.
The bottom line is that it is too early for the Fed to declare victory over inflation, and the Fed needs to slow down the economy further to get inflation under control.
The implication for investors is that the Fed will keep rates high until nonfarm payrolls go negative, because that is what is needed to get inflation under control, and this fact is generally underappreciated in markets.
Barclays - US Economics Research: September new home sales show surprising jump (surprise, surprise, surprise … at least for any / all still thinking rate CUTS coming soon — i mean they’ll be coming … WHEN not IF … unless of course, they’ve repealed the business cycle?)
September new home sales increased 12.3% m/m to 759k, alongside a 1k upward revision to the prior month. The print highlights resilient demand amid elevated mortgage rates. Meanwhile, the median new home price declined alongside a drop in months' supply to 6.9 months.
Barclays US Economics: FCI-g: Fed's model shows underwhelming effects of higher yields (so … NOT YET tight enough … full steam ahead on future HIKE PRICING?)
The Fed's new FCI-g indicator, which weights indicators by their estimated importance to the GDP, suggests that policy is restrictive, but that the drag has likely peaked. More notably, the indicator shows a surprisingly modest implied drag on activity from tighter financial conditions, despite the steeper yield curve.
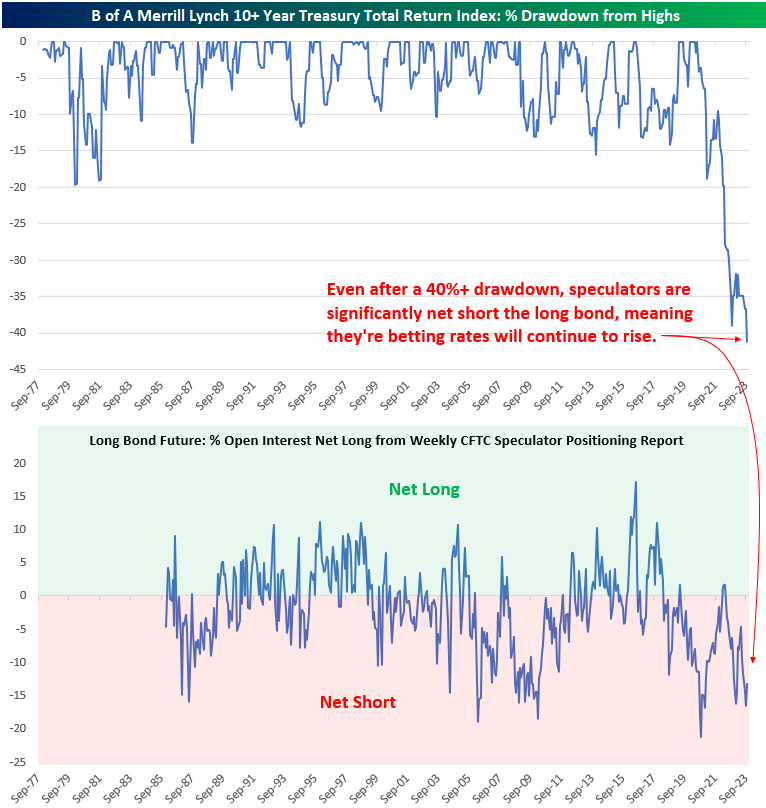
Bespoke- Long Bond Blues (goes from the blues TO bloodbath real quick … and while i’m a sucker for longer term moves in CONTEXT, only showing SPECULATORS, well, seems to be missing something … there are 2 sides to EVERY trade — still are, right? — AND there are asset managers and leveraged guys / gals out there so … to the point here those WITH a Terminal and economic workbench access happy and free to shape shift the narrative … what do I know … and NOT saying it’s been a walk in the park for FI — it hasn’t — am just mentioning couple / few things which stand out to me here … )
Bond Bloodbath
As shown in the first chart below, long-term Treasuries have just had by far their steepest drawdown of the last 45+ years. Talk about pain in an area that's typically considered "safe" relative to other asset classes. At this point, the long bond is back to levels last seen at the turn of the millennium.
As Treasuries trade lower and lower on a seemingly daily basis, speculators continue to press their bets that prices will drop even further based on open interest data released by the CFTC. As shown in the second chart below, instead of seeing a shift from net short to net long as the long bond has collapsed in price this year, speculators remain heavily tilted to the short side.
At some point when this sell-off in bonds sees a short-term bottom, the subsequent rally could be accentuated by all these short bets needing to be covered.
… It was a bruising day yesterday for 60/40 portfolios as 10yr US yields rose +13.2bps with the S&P 500 -1.43% and the NASDAQ -2.43% (the worst drop since Feb and -10.7% from YTD highs in July) after the previous night’s tech results were digested. The sell-off continues overnight in Asia trading. The ECB meeting, Q3 US GDP and Amazon’s results after the bell are the highlights today…
… If we start with the rates move, the long-end led the sell-off, as 30yr Treasury yields gained +14.8bps to 5.09% -- which is within a couple of bps of their 16-year closing high seen last week. 2yr yields were up a marginal +0.7bps. The 2s10s curve steepened +12.5bps, and the 2s30s by +13.7bps, with the spread of the latter a whisper away from zero again at -3.9bps having traded above zero for the first time in over a year intra-day on Friday. It hasn’t closed above it since last August. The latest refunding announcement occurs next week with fears over increased auction sizes creating some of the issues yesterday including a weak 5yr auction at 6pm London time which cemented the last leg of the sell-off last night …
FirstTrust- New Single-Family Home Sales Increased 12.3% in September (love the slipping in of M2 data)
… Implications: New home sales posted the largest monthly gain in more than a year in September, beating even the most optimistic forecast of any economics group. Today’s gain adds to the upward trend in sales in the past year, which are now 39.8% above the low in July of 2022. However, they still remain well below the pandemic highs of 2020. The main issue with the US housing market remains affordability. Assuming a 20% down payment, the rise in mortgage rates since the Federal Reserve began its current tightening cycle amounts to a 30% increase in monthly payments on a new 30-year mortgage for the median new home. With 30- year mortgage rates currently sitting above 7.5% for the first time in two decades, financing costs remain a headwind. The good news for potential buyers is that the median sales price of new homes has fallen by 15.7% from the peak late last year. However, it’s important to note that this drop in median prices is likely due to the mix of homes on the market including more lower priced options as developers complete smaller properties. Supply has also put more downward pressure on new homes than existing homes … One problem with assessing housing activity is that the Federal Reserve held interest rates artificially low for more than a decade … We also got data on the M2 money supply yesterday which declined 0.3% in September and is down 3.6% from a year ago. Monetary policy operates with a lag, and we are likely to feel the negative economic effects of these declines in the months ahead…
GavekalResearch- An Update On Three Key Prices: US Interest Rates (as always, when privy to reading this shop’s notes / thoughts, worth a moment to pause and click)
1) The forced seller crushing bond prices
2) Where will the money come from to buy bonds?
… Money is not likely to leave the warm comfort of bank deposits/money market funds, until either:
1) The US economy shows some serious sign of economic stress (though one issue there will be the resulting additional surge in debt supply). 2) The US government starts to sound at least mildly interested in the idea of controlling its spending. 3) Long bond yields are meaningfully above short-term rates (at least 50bp, but perhaps more like 100bp).
Of these three scenarios, #3 seems most likely. In such a case, bonds will sell off until the long end of the curve offers a high enough yields to coax investors out of money market funds and into long-dated treasuries. If the trend is duly your friend, the trend for long-dated yields seems to be higher.
3) Are high yields the cure to high yields? 4) The financial effects of collapsing “risk free” asset prices 5) Will a recession save bonds, or is it different this time?
… Conclusion Even though bonds are very oversold, it seems likely that yields will continue to creep up. Sure, Fed policymakers have recently hinted that the tightening of financial conditions means they may be done raising rates. So the short end, at least for now, seems anchored. But the long end seems likely to continue selling off until the US economy falls apart, the government embraces a more restrained fiscal policy (no sign of that yet), or the Fed follows the trail blazed by the Bank of England in September 2022 and goes back to buying the long end of its domestic bond market. The trigger for such an about face by the Fed would be mounting problems at financial intermediaries—a development which can occur suddenly, as was seen with SVB. This is especially the case, when balance sheets are already full of holes.
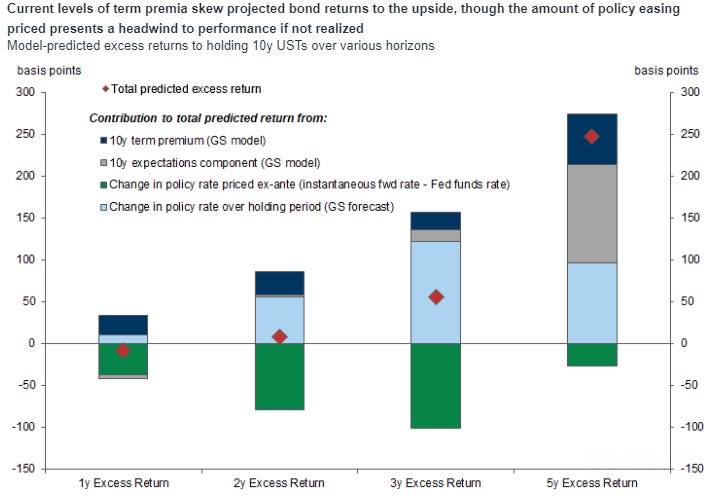
Goldilocks - Rising term premium a boost to bond returns (sounds like nows time to BUY … covering a short = buying but to get FLAT … I know, lets wait ‘til we here fromB-squared when THEY’ve bought THEN we can all pile in?)
■ Several yield decomposition models suggest that there has been a large increase in bond risk premium in long-end yields amidst the recent sharp selloff. In today’s Global Markets Daily, we examine the implications of increases in term premia on future excess returns.
■ We find that a 100bp increase in 10y term premium, which is roughly what models suggest have occurred over the past few months, is associated with roughly a 20-60bp boost to 10y UST excess returns across one- to five-year holding periods, all else equal.
■ The risk/reward to owning US duration looks increasingly attractive, particularly for investors that have three-year or longer investment horizons. But particularly at shorter horizons, the easing that is currently already priced could prove to be a headwind to the positive excess returns implied by current term premium levels if actual Fed cuts fall short of this pricing.
Goldilocks - New Home Sales Sharply Above Expectations in September; Boosting Q3 GDP Tracking to +4.7% (everything coming up roses … unless yer looking for recession and rate CUTS … hmmm)
BOTTOM LINE: New home sales rebounded by substantially more than expected in September. We boosted our Q3 GDP tracking estimate by one tenth to +4.7% (qoq ar) and our domestic final sales growth forecast by the same amount to +3.3% ahead of tomorrow’s advance release.
JEFF- November Refunding Preview: Expect Another Bump in Nominal Coupons, But Maybe Smaller Than You Think (lets hope … )
Key Points ■ We expect that Treasury will bump up nominal coupon auction sizes by $2B per month for 2s and $1B per month for 3s, 5s, and 7s in the coming quarter, and bump 10- and 30-year new issues and reopenings up by a flat $2B each. We also expect a $1B increase in 20-year bond actions, a $2B shift higher for FRNs, and no changes for TIPS. ■ Treasury was very aggressive in increasing coupon auction sizes in August. It is important to keep in mind that the adjustments this month are in addition to those increases, so we think expectations for further increases should be dialed back ■ Treasury has been issuing a tremendous amount of bills since the debt ceiling was suspended in early June. The market has absorbed them well, and can continue to support this pace of issuance. ■ Borrowing projections will likely be revised somewhat lower, given Treasury's strong tax receipts to begin Q4. ■ The survey circulated ahead of this FOMC meeting asked another round of questions about the buyback program and about long-term expectations for auction sizes. We do not think that Treasury will have much to report back to us on these topics for this quarter.
UBS- New home sales & mortgage apps diverge further (despite / because rates …)
New Home Sales more than reversed its previous month's decline… Mortgage applications set another record low…
The US releases the first guess of third-quarter GDP—less than half the data used in the final estimate is available today. Recent UK and European GDP revisions have changed their growth narratives in recent years. Historically, first estimates are revised over one percentage point (up or down), so today’s number is not precise.
GDP should show middle-income US households supporting a soft landing scenario. However, economic experiences within the US are increasingly divergent. Homeowners fare better than renters. Consumers in Florida face far higher inflation than in New York. These differences from the average represented by GDP may matter politically.
The ECB meets. Fifty one out of fifty one surveyed economists expect no change in policy (and that many economists could not possibly be wrong). We have, obviously, heard a lot from ECB President Lagarde of late—it is doubtful whether the press conference will change perceptions.
US President Biden warned China not to attack the Philippines, which might focus international attention on the region. The US House of Representatives has finally elected someone as speaker. The current speaker has to negotiate a deal between different Republican views in the house and the Democrat-controlled senate to keep the government open.
Wells Fargo - New Home Sales Soar in September (despite rates … impressive)
Summary New Home Sales Resilient to Rising Mortgage Rates Amid mounting housing market unaffordability, new home sales are still rising on trend as builders successfully employ price discounts and mortgage rate buydowns to sell homes. New home sales advanced 12.3% in September, the largest monthly jump in over a year. This outturn delays concerns of an imminent slowdown. However, the sharp rise in mortgage rates in recent weeks will likely test the new home market, limiting builders' abilities to sustain the same level of financial incentives.
… Despite new home resilience to date, the upturn in mortgage rates in recent weeks threatens to cool demand. The average 30-year fixed mortgage rate has spent 10 consecutive weeks above 7.0% according to Freddie Mac. At 7.6% last week, upward momentum in bond yields and increased risk has propelled mortgage rates to their highest level since 2000.
… And from Global Wall Street inbox TO the WWW,
Bloomberg- People thought we were headed for a soft landing in 2006 too (I HATE when he / they do this … you know, remembering stuff … I used to be able to do this too … ah, the bad ‘ole days…)
The 2000s saw the Federal Reserve raise interest rates to a high level and then hold them indefinitely. It was not until the Fed held rates that the economic reaction came.
The last time the Federal Reserve raised its benchmark interest rate and held it there for a considerable period was in 2006 and 2007. That episode ended in calamity. This time may be different. After all, with the benefit of hindsight, policy makers can do better. But you can’t count on that outcome.
… Where do we go from here? … Now is when the damage gets done, though. We saw that in 2006. After the recession scare in the middle of the year, growth rebounded in 2007. And stocks rallied right until the very end.
All the while, however, the long and variable lags of monetary policy were working to bring down the housing market and the US economy with it. And so, it wasn’t until 2008 that we saw a dip in quarterly GDP figures.
Here’s the thing. We’ve already been through that. The Fed and other policy makers presumably know the history and are ready to respond…
Bloomberg- Yields Might Have Long Way To Go To Seduce Buyers (MLIVEs Simon White is growing on me … for better or sometimes, even worse)
US households are becoming the buyer of last resort in Treasuries, meaning yields may need to rise by as much as 1.5 percentage points to meet the sector’s elevated and rising inflation expectations.
The world is once again having to acclimatize to higher rates. US 10-year yields this week rose above 5% for the first time since 2007. But they may need to climb even further to clear the market as other sectors continue reduce their Treasury exposure, leaving households as the only net buyer.
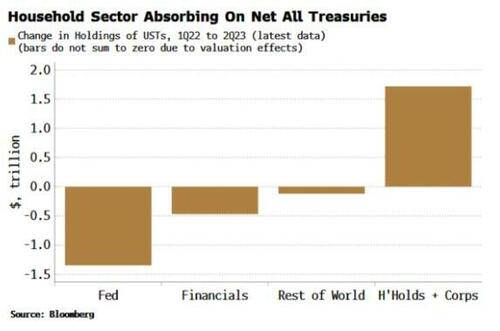
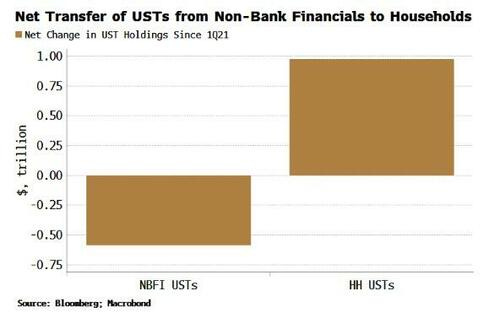
For every seller, there must be a buyer. The Federal Reserve, financial firms and the rest of the world have all been net sellers of USTs since last year, leaving the household sector (including the corporate sector it de facto owns) to pick up the slack.
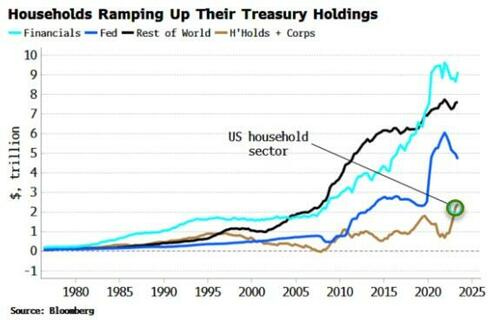
Households have historically been the smallest holder of Treasuries, but in the space of less than two years they have increased their holdings by $1.7 trillion, taking them to a new high of $2.4 trillion. The way things are going, households may end up owning a lot more yet – but they’re likely to demand a greater yield than currently on offer to compensate for the risks.
In the years just before the pandemic, all sectors other than households were happily hoovering up Treasuries. But now they’re reducing their duration exposure in the face of the fastest Fed rate-hiking cycle yet seen.
Most obviously, the Fed is no longer a buyer, with its UST holdings falling $1.3 trillion from their peak as part of its quantitative-tightening program.
There is little sign the Fed won’t carry on with the current pace of QT, especially with reserves still more than $1 trillion above most estimates of their lowest comfortable level.
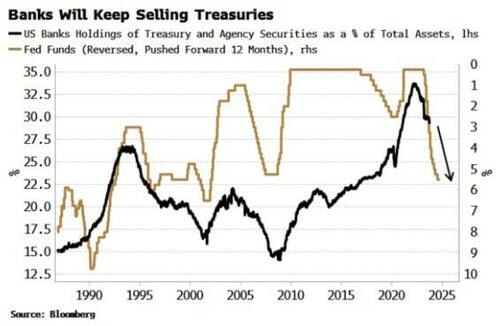
US banks, too, have been reducing their exposure to duration through Treasuries. Before the Fed started hiking, Treasury holdings of banks had reached all-time highs. But banks typically row back on their UST exposure when rates rise. As the chart below shows, they are likely to continue to shed Treasuries well into next year.
US Treasuries have also lost their allure to overseas buyers. High short-term rates and an inverted yield curve have made US yields after FX hedging costs very unattractive to erstwhile large buyers like Japan. Further, non-Western-aligned countries are becoming more reluctant to hold US government debt in case they face Russia’s fate and see their FX reserves frozen.
But where there is the greatest potential for large-scale Treasury divestment is in the non-bank financial sector. Asset managers, mutual funds and other multi-asset investors have no essential need for Treasuries. But they became increasingly attractive to them as portfolio and recession hedges as long as their correlation to stocks was negative.
However, stocks and bonds are reverting to co-moving together now that the inflation genie is out of the bottle. Investors not bound by liability-matching needs may question owning Treasuries if they are no longer enhancing risk-adjusted returns or are unlikely to work as a recession hedge.
Since 2021, non-bank financials’ UST holdings have dropped by almost $600 billion, accounting for over 60% of the net rise in the household sector’s holdings. The positive stock-bond correlation hints households may end up taking on a lot more of unwanted Treasury debt currently held in 60/40-like portfolios.
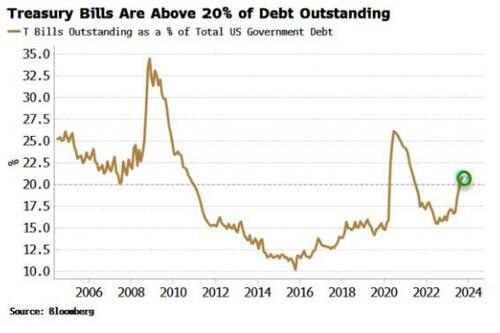
Recent rises in yields have been driven by term premium – a sign that the market is becoming increasingly wary of supply and therefore inflation risks. But cushioning the blow has been the RRP facility. The Treasury has been skewing its issuance toward bills this year, and as their yield is higher than the RRP (and as we gradually get closer to the point where the Fed will eventually cut rates), money market funds (MMFs) have been transferring funds from the RRP to bills.
But bills are now above 20% of total Federal debt outstanding, around the upper bound of where the Treasury has aimed to cap bill issuance in the past. Future auctions will increasingly skew toward bonds and away from bills.
As that trend continues, the RRP will provide less of a cushion as MMFs are unable to invest directly in longer-term debt (even if they can indirectly through repo).
The Fed, banks, multi-asset investors and overseas buyers are unlikely to provide much support, leaving the household sector as the marginal buyer and therefore the setter of the clearing price.
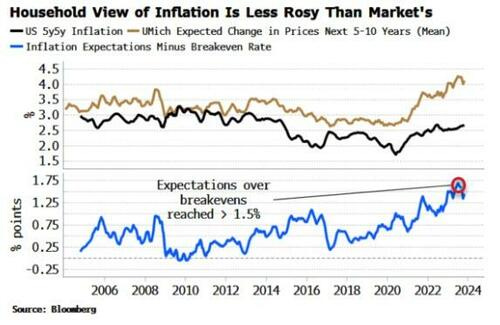
But what is that price? That largely depends on the outlook for inflation. The market has been remarkably sanguine in its inflation outlook this cycle, despite the highest consumer price growth seen for several decades. The 5y5y forward inflation breakeven rate has risen from around 2% in 2019 to 2.75%.
The household sector is much less optimistic. Shorter-term inflation expectations, based off the University of Michigan survey, are almost back to their pre-pandemic levels, but longer-term expectations – pivotal for bond yields – remain elevated.
As the chart below shows, the gap between households’ and the market’s inflation expectations has widened to at least 15-year highs, with a recent peak of more than 1.5 percentage points.
Heightened inflation has been with us more than two years now, and households will increasingly be growing wise to money illusion.
Regardless of whether they have as nuanced an understanding as the market of inflation-duration risks, they are likely to demand more yield compensation than the market is currently offering, with a rough-and-ready estimate - given by the excess of the household sector’s anticipated long-term inflation above breakevens - of 1-1.5 percentage points over time, or perhaps even more if bond and inflation volatility remain high.
It’s not about who’s ultimately right on inflation, but who’s left - and at the moment that’s US households.
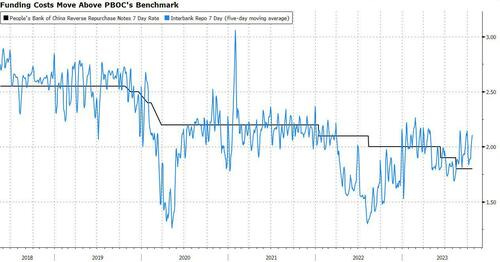
Bloomberg - Washington Isn't Alone In Flooding The Market With Government Bonds: Beijing Is Doing It Too
… So the consensus is looking for the PBOC to lower the RRR, unleashing more cash into the banking system, and potentially lower interest rates. Standard Chartered’s economists now call for 50bp cut in RRR by year-end, versus no reduction seen previously. Economists at Goldman Sachs expect a 25bp cut in RRR and a 10bp reduction in the policy rate in the fourth quarter.
Yields on 10-year bonds have increased 16 basis points since the PBOC’s last rate cut in August. If the PBOC pumps more liquidity into the market, it may put a lid on rising yields.
So the consensus is looking for the PBOC to lower the RRR, unleashing more cash into the banking system, and potentially lower interest rates. Standard Chartered’s economists now call for 50bp cut in RRR by year-end, versus no reduction seen previously. Economists at Goldman Sachs expect a 25bp cut in RRR and a 10bp reduction in the policy rate in the fourth quarter.
Yields on 10-year bonds have increased 16 basis points since the PBOC’s last rate cut in August. If the PBOC pumps more liquidity into the market, it may put a lid on rising yields.
Bloomberg - Bonds as Diversifiers Aren’t Dead — Just Dormant
Stock-bond correlations are positive again, making many observers question conventional investing wisdom.
Stocks and bonds are moving in lockstep once again, triggering more agita about what it all means. Before we get carried away anew with declarations about how “the investing world is forever changing,” it’s worth remembering how fluid the relationship has proved over the past couple of years — and how another twist is always just around the corner.
To review: 10-year Treasury notes were negatively — or minimally — correlated with the S&P 500 Index for most of the 21st century, and the investing public had generally accepted that some mix of stocks and bonds was the optimal way to manage risk. Then last year, correlations surged into meaningfully positive territory (both went down simultaneously), tanking the storied 60/40 portfolio (60% stocks, 40% bonds) and leading many observers to question the conventional wisdom about portfolio construction.
Studies of stock-bond correlations often use slow-moving multi-year look-back windows to analyze the relationship between the two asset classes. Here I’ve used rolling 60-day periods to put the data under a microscope, revealing that the relationship has been ever-evolving of late and is not as sticky as it seems. Consider this timeline…
… Reported inflation has been consistently moderating for the past year, and forecasts now project that year-over-year inflation — as measured by the core personal consumption expenditures deflator — probably moderated to about 3.7% in September. If you think (as I mostly do) that inflation is a fading aberration, then you must also think the same of the positive stock-bond relationship — and, thus, the consternation about the place of bonds in portfolios is overdone. Remember, bonds will continue to act as diversifiers so long as the positive correlation doesn’t get too close to 1.
Whatever the case, markets are likely to deliver at least a few more twists and turns before the great correlation debate is finally settled. That’s the one clear lesson of the past year and change.
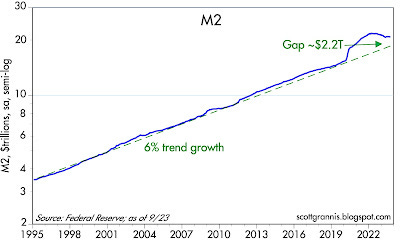
Calafia Beach Pundit - M2 update: continued disinflation (former WAMCO chief econ now on the beach and still apparently has a Terminal…)
With this post I provide continued coverage of the all-important M2 money variable that almost no one, including the Fed, has bothered to pay attention to for the past several years. Click here to see my first post (October '20) highlighting the extraordinary growth of M2 and why it wasn't inflationary. Click here to see my first warning (March '21) that rapid M2 growth threatened a significant increase in inflation. Click here to see my first prediction (May '22) that slowing M2 growth presaged declining inflation.
I'm happy to report that M2 continues to decline, thus ensuring continued disinflation. It's still early to worry about deflation, but it could happen if the Fed waits too long to start cutting interest rates.
Chart #1 shows the level of M2 compared to its 6% trend rate of growth which began in 1995. (Note the use of a semi-log scale for the y-axis, which displays a constant rate of growth as a straight line.) At the peak of the M2 "bulge" in December '21, M2 exceeded its trend by about $4.8 trillion. The "gap" has now shrunk by more than half, and currently stands at about $2.2 trillion. The gap has shrunk due to 1) soaring interest rates, which have slowed loan growth, and 2) declining demand for money, which has fueled spending and higher prices…
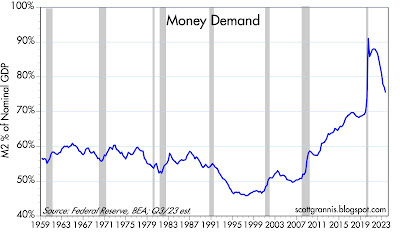
… Chart #5 is another way of looking at "money demand" on an economy-wide scale. It's simply the ratio of M2 to nominal GDP, and as such, it's a proxy for how much of our annual incomes we collectively prefer to hold in currency, bank checking and savings accounts, and retail money market funds. Money demand surged with the Covid shutdowns, rising fears, and great uncertainty, then collapsed as the economy returned to normal and the price level rose. According to this chart (and Chart #1) there is still an excess of M2, but its inflationary potential has been largely neutralized by the Fed's aggressive rate hikes. (Higher interest rates encourage people to hold higher money balances than they normally would, instead of spending them down.)
FRBNY— Research Update: Corporate Bond Market Distress Index (everyone lovin’ some tightening of conditions…ESPECIALLY when they don’t appear to be impacting … conditions …)
October 2023 Update
Though financial conditions have tightened over the course of October, corporate bond market functioning appears healthy. The end-of-month market-level CMDI is below its historical 40th percentile.
Market functioning in both the high-yield and investment-grade sectors likewise remains within historical norms.
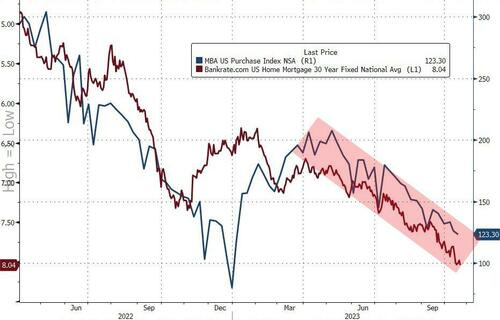
ZH: New Home Sales Exploded In September, As Homebuilders Eat Soaring Mortgage Costs
… Some background color before the big number - The Mortgage Bankers Association's index of home-purchase applications tumbled 2.2% WoW to 127 - the lowest level since 1995 - as mortgage rates hit 8% for the first time in 23 years.
AND … I’m nearly done. On this day in 1985 — NO not where ‘flation or RATES were BUT perhaps a valuable analog to explore,
All these broken models and patterns, I can't help but think we're Lab Rats caught in a maze, searching vainly for the cheese. Let's hope that cheese doesn't have a Nuclear Glow when it's finally found!


Outstanding Article !!!!
I will take the "Over" on the size of the Treasury's Refunding......It will be ENORMOUS !!!
Money Supply is interesting. Looks like it is Regressing to the Mean...a ways to go.
Those Home Purchase Appl. numbers are Extraordinary......LOW...
What a MESS.......
We'll get through it.....
Agree with your conclusions.....Short of a Recession...Short of a Regional, WW3 war...
Rates go higher....above 5 %
Thanks for your expertise.....
All these broken models and patterns, I can't help but think we're Lab Rats caught in a maze, searching vainly for the cheese. Let's hope that cheese doesn't have a Nuclear Glow when it's finally found!