(USTs bull steepened overnight on strong volumes)while WE slept; "Asset managers are still bullish on duration, but less so than 3 months ago" and ... ReSale TALES
Good morning … ReSale TALES beat (more on that below) and set the table for a terrific Tuesday … I’ll pause and reiterate how very often these figures — priced as FACTS here / now — are REVISED — thereby earning nickname …
I suppose the data was SO good it was BAD enough (for stonks) and so, it was GOOD for bonds, as initial / knee jerk reaction was for USTs to be BOUGHT cuz, you know, stocks got the joke — rate CUTS may NOT be so … um … imminent?
Whatever the case (bad = good = bad), knee-jerk reaction has seen momentum cross (bullishly — 5yy noted YEST) and outright levels of yield which drew interest.
Stepping back a bit and looking at 5yy DAILY (line), you’ll note 4.38% appearing to be a level of interest …
I’ve attempted to loosely correlate this level with what appears to be turning points of momentum … these turning points were NOT long lasting BUT do appear at times when there are some basis points to be earned…from longs.
Rate CUTS or not…
But that was then and this is now … well, sorta. TICS late yesterday, from JUNE (near another time which saw yields 'peak’)
ZH: Foreigners Were Behind June S&P Breakout With Record Purchase Of $120 Billion In US Stocks
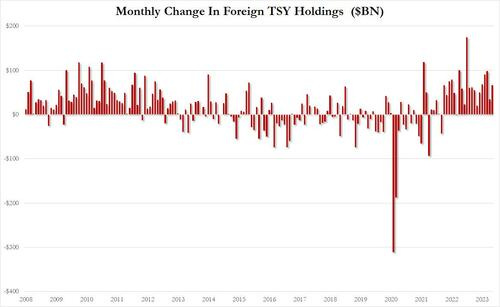
… But it wasn't just corporate stocks: foreigners also bought a whopping $66.4BN in US Treasuries...
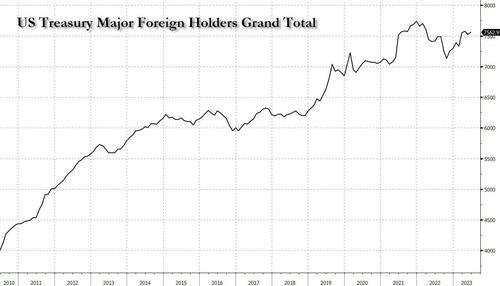
… And while the June grand total of foreign Treasury holdings hit a 16 month high of $7.563 trillion, mostly thanks to buying by Japan, the UK, Ireland, and others...
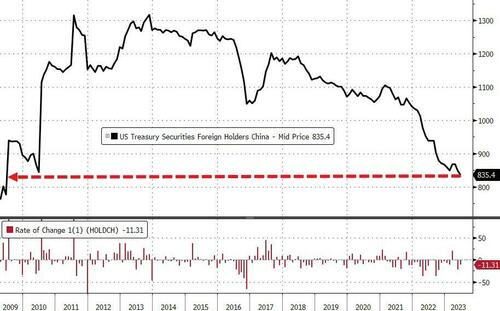
... China's relentless selling continued, and brought the country's total TSY holdings to $835.4BN, the lowest level since 2009.
FULL STOP. I’d note China’s been selling off holdings of USTs since 2013 and while I’m sure someone somewhere would LIKE for this to be shared as new, shocking NEWS, well, it just isn’t. Make something more of it if you wish but please be careful of the narratives marketplace (MS noted HERE)
… here is a snapshot OF USTs as of 725a:
… HEREis what ANOTHER shop says be behind the price action overnight…in morning commentary, “Every Minutes Counts”
… Overnight Flows The bull steepening overnight benefited from solid volumes with cash trading at 101% of the 10-day moving average. 5s were by far the most active issue with an impressive 46% marketshare with 10s well behind taking just 20%. The front-end claimed 23% with 2s and 3s garnering 12% and 11%, respectively. 7s managed 7%, 20s were awarded just 1% and 30s rounded out the curve with a 3% allocation.
Retail sales surged 0.7% m/m in July, with nonstore retailers propelling outsized gains in the control group amid broader strength. Although today's readings put consumers on more solid footing in Q3 than we had thought, payback effects from July's Amazon Prime Day will also likely weigh on sales in August and September.
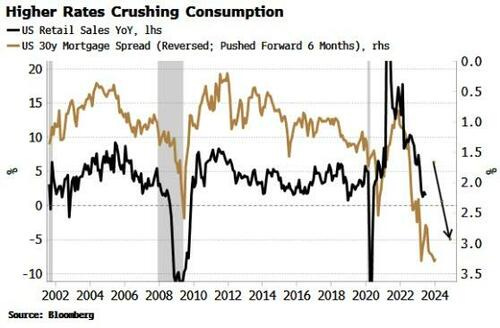
The recent rise in yields will push mortgage rates higher which, along with consumer credit that has already been tightening, will squeeze consumption further. Higher-duration consumer discretionary and retailing stocks are likely to underperform.
With US rates nudging 2008 highs, the outlook for yield-sensitive consumption is darkening. Higher yields are leading to higher mortgage rates. This is not a fait accompli as it also depends on the mortgage spread, but the correlation between yields and spreads has become much less negative, and thus it is reasonable to expect higher yields will bring higher mortgage rates.
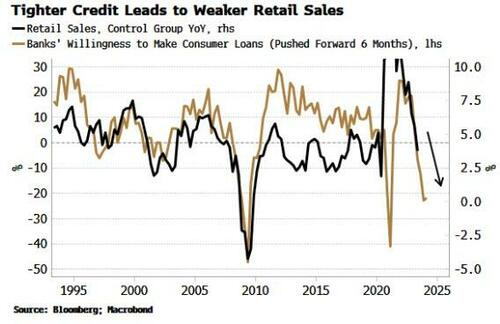
As the chart below shows, this points to further weakness in retail sales.
We’ll get July’s retail sales data later today. July is expected to show a small month-on-month improvement on June’s data, but as the chart above shows, the trend is manifestly lower.
A further headwind for consumption is from tighter credit. Credit did not tighten as much as expected in the wake of SVB’s failure, but the truth of the matter is that credit had already begun to be squeezed.
We can see that banks have become considerably less willing to make consumer loans over the last year, and this points to further downside in retail sales.
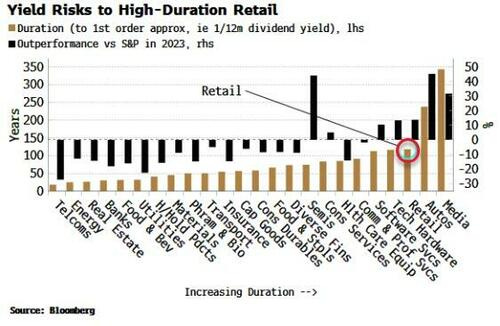
This outlook is not constructive for retail stocks. They are the fourth best performing US sector (GICS 2 sectors) year to date, after autos, semis and media. Moreover, the retail sector is high duration, and thus more exposed to higher rates.
Protection is relatively cheap though, with the XRT (retail ETF) having the highest put skew among the GICS 2 sectors.
BMO - Retail Sales Beat, Control Group Stronger, Initial UST Dip Bought (not sure how this is good for Team Soft Landing but … that is what they are sayin’…)
Retail sales in July outpaced estimates at 0.7% MoM vs. 0.4% MoM expected and prior was revised higher to 0.3% MoM from 0.2% MoM. The strength was broadbased with ex-auto and gas also above estimates at 1.0% MoM vs. 0.4% MoM expected and 0.4% MoM prior, and most importantly for consumption estimates within Q3 GDP forecasts, the control group was significantly stronger at 1.0% MoM vs. 0.5% MoM seen. A strong look at spending in July, and another piece of information that will bolster soft landing conviction. … Treasuries extended the overnight selloff into the data with the UK wage numbers overshadowing the PBOC's surprise rate cut in driving the price action into retail sales. The kneejerk selloff filled the opening gap we'd been watching as support in 10s, but that dip has been bought initially to leave rates effectively unchanged versus pre-data levels. The NAHB housing market index will be a minor distraction later this morning as the market evaluates how far the selloff can run before the minutes release tomorrow afternoon.
DB - Investors still want duration, just not as much (always fancied the SMRA duration survey but never really able to mess with it on my own via BBG and loved reading others interpret data, especially with a visual)
Over the past few months, institutional asset managers have pared back their demand for duration, although they remain somewhat bullish. Two popular positioning metrics have been trending lower since reaching their peaks in early May. In futures positioning data, asset manager net longs as a percentage of open interest fell from 30.7% to 28.8%, which still sits above their last 3-year average of 20%. In survey data, the SMRA asset-weighted index came down from a record 100.9 in May to 100.5 last week. An index level above 100 indicates a bullish outlook.
The positioning pullback came as a period of very strong and steady inflows into long-term government bond funds earlier this year started to reverse more recently. The 10y UST yield has risen 85 bps higher since May and is currently close to establishing a new post-GFC high.
In our 10y fair value model, after adjusting for various factors that drive the level of yields, the positioning variable has contributed between -10bps and +20bps to yields over the past year. Currently, bullish asset manager positions are estimated to be depressing 10y yields by about 5bps.
FirstTRUST - Data Watch - Retail Sales Rose 0.7% in July (HOPE … for some bad news in the pipeline … springs eternally?)
Implications: Consumer spending remained strong in July … In the last twelve months, overall retail sales are up 3.2%, basically matching inflation meaning “real” retail sales are unchanged. Our view remains that the tightening in monetary policy since last year will eventually deliver a recession in the next twelve months. Expect some deterioration in retail sales later this year.
■ The recent rise in bond risk premia has fueled a bear steepening episode in the US. Under our baseline soft landing scenario, we do not believe this move can extend. In today’s Daily, we discuss the impact of supply and macro uncertainty on bond risk premium
■ Our estimates of the impact of supply on yields are both smaller and more gradual than many investors fear. The overall upward trajectory for the stock of debt should raise 10y yields by about 40-80bp over time, all else equal, and near term repricing over the next few years is likely to be about half those levels.
■ Other than supply, declining macro uncertainty (proxied here by lower rate volatility) should exert downward pressure on risk premia. Overall, we do not expect material upward repricing of real risk premia over the next few months, or if it were to occur, that it would sustain for long.
■ The risks to our view are two-fold. First, if the economy does enter a recession, the countercyclical nature of risk premia implies a significant increase from current levels. Second, if the Fed proves reluctant or unable to maintain tight policy in the face of stickier-than-expected inflation and tight labor markets, investors may begin to demand more inflation risk premia.
Retail sales provided another upside data surprise and indicates a 3% annualised GDP growth rate is possible for the third quarter. However, higher consumer borrowing costs, reduced credit availability, the exhausting of pandemic-era savings and the restart of student loan repayments pose major challenges for fourth quarter activity
LPL - Prime Day Boosted Sales (answers to ReSale TALES strength hiding in plain sight … as goes AMZN so goes the entire US economy?)
KEY TAKEAWAYS
Amazon Prime Day in mid-July temporarily boosted overall spending last month.
Auto sales revenue fell in July as vehicle prices declined, which provided a bit of a respite for consumers.
It seems that online promotions and excess savings buoyed retail activity in July but consumers are quickly depleting those excess reserves and using credit to support spending habits.
Today’s retail sales data do not support any material change in expectations for the next Federal Reserve (Fed) meeting. We expect the Fed to pause next month as inflation eased in recent months.
… Today’s retail sales report is mostly focused on goods spending so the Personal Consumption Expenditures (PCE) report in a few weeks will likely show the strong appetite for services. Looking ahead, investors should be mindful of the early warning signs that should show waning demand for services such as travel and hospitality.
SUMMARY It seems that online promotions and excess savings buoyed retail activity in July but consumers are quickly depleting those excess reserves and starting to use credit to support spending habits. Yields on both 2-year and 10-year Treasuries moved a bit following this morning’s report but the sales data do not support any material change in expectations for the next Fed meeting. We expect the Fed to pause next month as inflation eased in recent months.
NatWEST - Japan: Home is where the yield is (this one may NOT be on ReSale Tales BUT clearly important especially as it relates directly TO one of the largest holders / BUYERS of USTs …)
The Japanese have been big investors in foreign bonds over the past decade. Are unattractive FX-hedged returns and the changing landscape in Japanese monetary policy catalysts for a big shift in demand?
The Japanese send most of their money to America. The start of this hiking cycle saw Japanese banks and lifers move cash out of their foreign investments. But flows in 2023 have been different. “Cheap” USTs have been bought this year, although demand for European debt has been stagnant.
Japanese investment is likely to flow out of Europe, but only gradually. We expect this years’ stagnant demand for European bonds to continue, but don’t expect strong selling flows. Realising losses on portfolios will be unappealing. Redemptions will likely be the trigger to shift out of European assets.
Somehow rising delinquencies, higher consumer financing costs and the erosion of pandemic-era savings comprised the perfect formula for an expectation-crushing 0.7% increase in July retail sales...and for an added flex, the gain comes despite upward revisions to prior monthly data.
…Upside Potential for Q3 PCE... If the Resilience Can Be Sustained Retail sales rose 0.7% in July after modest upward revisions to June. To say the July data surprised to the upside is an understatement when you consider that the 1.0% gain in the control group measure, which feeds directly into the BEA's calculation of goods spending in its GDP accounting, beat all 28 forecast expectations tallied by Bloomberg. In short, these data present upside risk to our call for real personal consumption expenditures to expand at a 1.8% annualized rate in Q3, and thus GDP (chart).
… Not All Retailers Are Flourishing While today's number are undoubtedly better than expected, to some extent retail sales is missing what underlying retailers are feeling. Consider the fact that retail sales fell in four out of five months between November and March before going on a four-month run of gains between April and July. At a macro-level, that indicates consumer resilience. Goods consumption is holding up even as services spending has taken up an increasing share of household's wallets. But for most retailers, it's year-over-year comparisons that matter. Retailers that sell their wares online and bars & restaurants are doing very well by this measure, but nearly half (five of 13) of retailers have seen sales slip below where they stood a year ago when adjusted for inflation, which instead speaks to the weakening demand profile often experienced by many retailers today
Yardeni - For the Bulls, The Suspense Is Hard to Bear (nice to see a piece about BULLS with first reference being BOND MARKET … and specifically 10yy above 4% as if there are magical, mystical powers … don’t get me wrong, I firmly believe nothing happens without a consequence and if Earl prices would cooperate, Fed could very well be winning as well as any / all brave / stoopid enough to buy long bonds … but I digress)
The Bond Vigilantes kept the suspense going today. They closed the 10-year Treasury bond yield at 4.22% (chart). It's widely feared that if it rises above 4.25% (i.e., last year's high), the next stop could be 4.50% and even 5.00% if the yield curve disinverts with the long end rising up to meet the short end.
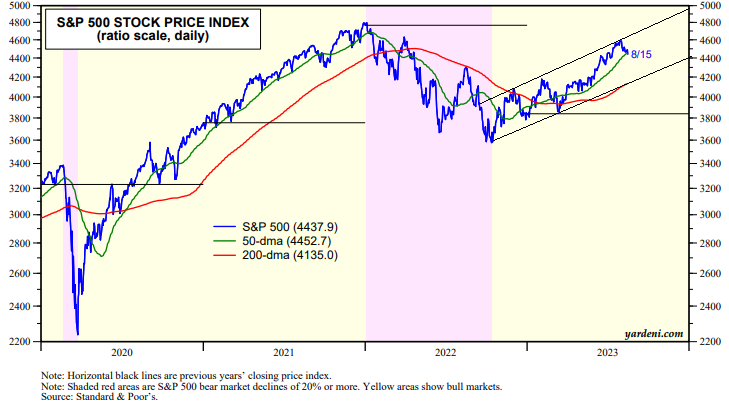
The stock market has been on edge ever since the yield crossed back above 4.00% at the start of the month. The S&P 500 is down 3.3% from its July 31 high for the year (chart). It fell below its 50-dma today. A bounce off the 200-dma still looks possible without violating the market's bullish channel since the bull market started on October 12.
Why didn't the yield vault over 4.25% this morning when July's retail sales came out with a much-stronger-than-anticipated gain of 0.7%? A slew of data out of China suggested that the Chinese economy is in trouble and exporting deflation to the US. Also this morning, Fitch warned it may have to downgrade dozens of banks including JP Morgan. If commercial real estate (CRE) mortgage rates continue to rise along with bond yields, there will be lots more CRE loan defaults. Minneapolis Federal Reserve President Neel Kashkari said that capital requirements should be raised for banks with more than $100 billion in assets…
Finally, something ELSE from the intertubes which may have some funTERtainment value,
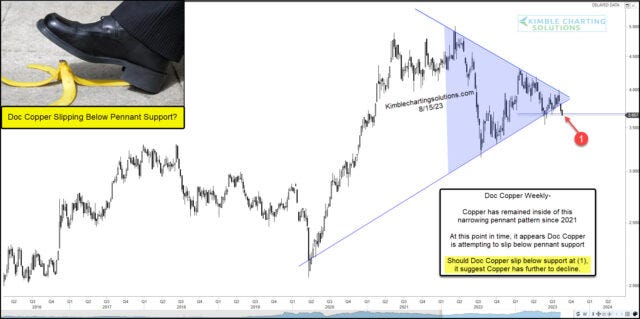
Although copper isn’t the economic bellwether that it was 50 years ago, it is still an important barometer of economic activity.
As you can see in today’s chart, Copper fell sharply into the 2020 coronavirus crash before racing higher and rallying just as sharply with the economic recovery into late 2021.
BUT, copper has struggled since then, falling sharply into 2022 before recovering some.
Today’s “weekly” chart of Doc Copper highlights the pennant pattern that formed since that peak. It also shows that Copper is attempting to break below pennant support at (1).
Should it break below support at (1), it would suggest Doc Copper has further to go on the downside. It may also suggest further economic stagnation on the horizon…
OFF to watch Thing 3s first scrimmage (and OUT Friday for more of the same — may or may NOT have a post early — will try but feel free to reach out for refund if you wish :) ) … THAT is all for now. Off to the day job…