Good morning … With developments overnight in China, here’s an excerpt from The Morning Hark (15 Aug)
Weaker set of Chinese data: Ind Prod YoY 3.7% vs exp 4.3%, Retail Sales YoY 2.5% vs exp 4.0% … This was accompanied with "surprise" easing by PBoC, 15bps MLF cut to 2.5%, the biggest drop since 2020 (ZeroHedge, FT, ING, WSJ). The 7day repo was also cut 10bps to 1.8%. This will aid debt refunding, but it is not the big bang fiscal policy shift that the mkt is looking for to change the direction of the overall growth story.
More on China just below. For here / now worth noting it seems to me that somethings are breaking … take, for example, the markets REACTION FUNCTION whereby in ‘normal’ times, we’d see a risk off move and flight TO quality (USTs) but now, perhaps in wake of recent FITCH ‘news’, things are different.
Right. I said it. It’s different this time.
Stocks AND bonds are down overnight and there’s not an end in sight. I noted momentum — overSOLD — yesterday — and here is a shorter-term look at 5yy (with very same message,
Momentum starting to make 5yy look interesting — not YET the screaming BUY but certainly interested in preparing to cover short … ? Will be watching in / around 4.50% (prior ‘cheaps’) closely and for now … here is a snapshot OF USTs as of 654a:
… HEREis what this shop says be behind the price action overnight…
… WHILE YOU SLEPT Treasuries are back to bear-steepening, the PBOC’s MLF/7d RR cuts in response to weak activity data shrugged off with higher UK wages and the Japan GDP beat in focus. DM long-end yields are testing cycle highs in unison, EGB peripherals underperforming (10y Italy +12.5bp) on heavy EGB supply to come this week as well as further jumpiness seen in EU nat gas futures (TZT +5.5%). APAC region risk-off (ex-Japan) saw the Chinext -0.7%, HSI -1%, with the EuroStoxx sympathetically weak (VG -1.3%). S&P futures are showing -0.6% here at 6:30am, USD-crosses weak against EUR and GBP (+0.3%, +0.2%, respectively), though USDCNH is tracking to new monthly highs (CNH -0.5%). With US 10y real yields also notching new cycle highs, precious metals are on the back-foot with XAG -0.8% and tasting the June lows near $22.11. BCOMIN is -1.1%, with copper futures -1.7%. Volumes have noticeably picked up in London hours with SOFR swap receiving interest seen in 5y space vs payers in 10-30y sectors, the spread curve mildly steeper as a result. Volumes around 140% the 30d average.
Big downside surprises in retail sales, fixed asset investment, and IP confirm weakening demand amid deepening property woes and subdued consumption. We cut our 2023 GDP growth forecast further, to 4.5%, in view of faster-than-expected housing market deterioration. We expect more PBoC easing with RRR and policy rate cuts
CSFB - House View - China Data: Let's go back to 5.1% (they did tell us so…)
As some of our readers might recall, we started the year with an annual growth forecast for China GDP of 5.1% (link), noticeably below consensus at the time. After the modest positive surprise in Q1, we mechanically adjusted our forecast up to 5.2%, while sticking to our below-consensus narrative. Now, with today's release of July's monthly data packet, we decided to revise our annual forecast back to 5.1%. Just like before, a revision of this size to annual GDP is hardly remarkable, but we want to recognize that some of the downside risks that we have highlighted within the last 12 months appear to be materializing during Q3.
Starting with the short-term risks, we anticipated severe flooding this season earlier in the summer (link). Now we see that industrial production has indeed been affected. (See Figures 4 and 5.)
Onto the more structural concerns, underwhelming household demand based on our skepticism of the excessive savings narrative (link), high youth unemployment rate (link), households entering into a multiyear effort to reduce net borrowing (link), and a structural decline to house price and hence ongoing consolidation to the real estate sector (link) are all in motion. Some of these are technically unverified by official data. For instance, the youth unemployment rate series has apparently been suspended. So we want to be clear that these are only downside risks that we expect to be materializing and we might be wrong with our expectations.
However, if we turn out to be correct, then our readers should be increasingly concerned about a substantial house price correction within the next 12 months (link), and along with this come the heightened default concerns of LGFV and local government default risk (link), and the shadow banking components tied to the real estate sector.
On the positive side, we are not too worried about China's formal banking sector and believe that authorities can achieve the annual growth target of around 5%.
DB - China Macro - More policy easing needed to achieve 5% growth
The PBOC cut its 1-year MLF policy rate by 15bps on Tuesday. The market had expected no change, while we had expected a 10bps rate cut. The PBOC decided to go for a bigger move at a time when China's growth momentum is slowing further. After today's official data release, we estimate China's GDP growth slowed to 5.2% in July from 5.6% in June, owing to soft domestic demand and in particular retail sales and fixed asset investment. The economy's biggest challenge still comes from the property sector, where a further drop in housing sales and bank loans has elevated the stress on property developers. Considering these challenges, we have revised down our Q3 GDP forecast by 0.4ppt, to 0.8% QoQ and 4.4% YoY.
We believe additional policy support is necessary for the government to achieve its 5% growth target. The Politburo meeting in late-July marked a turning point in macro policy stance. We expect the PBOC to ease further by cutting RRR by 25bps in Q3 and cutting the MLF rate by another 15bps in Q4. We also expect more meaningful property sector easing and PBOC lending to support credit growth, and a change in fiscal stance to boost public spending. Our revised GDP growth forecast assumes that policy support will help raise QoQ growth to >1% from Q4 onwards; annual GDP growth is forecasted at 5% in 2023 and 4.7% in 2024 (was 5.3% and 5%, respectively). The biggest downside risk, which we think policymakers will work hard to prevent, is a free-falling property market leading to a full-fledged crisis.
We estimate China's GDP growth slowed to 5.2% YoY in July from 5.6% in June
DB - US Inflation Outlook: Softer CPI supports pause prospects (pause = done forever, unless i’ve missed the memo, but seems to me the idea behind most if not all 95p chartbook here … )
The July CPI data came in largely as anticipated with both headline and core rising by 0.2% from June. While the composition of the data was broadly in line with our expectations, airfares again surprised significantly to the downside, posting a second consecutive 8.1% decline. Taken together, the year-over-year rate for headline ticked up two-tenths to 3.2%, while core fell by 16bps to 4.7% (just shy of rounding down to 4.6%). That being said, airfares in the PPI were meaningfully firmer, up 2.6%, and portfolio management prices grew by 7.4%, both of which will factor into the July core PCE, the Fed’s preferred inflation gauge. This relative strength suggests that core PCE should come in a little hotter than core CPI did, rising by a stronger 0.2% rate in July. Should that prediction hit the mark, the year-over-year rate for core PCE would rise by a tenth to 4.1%.
These recent inflation datapoints are consistent with our expectations that the Fed will not raise rates any further. That said, while the inflation data in isolation are encouraging from the Fed's perspective, there are several more data points ahead of the September 20 FOMC meeting – including another employment and CPI report.
As the data largely came in close to our expectations, we made few changes to our forecast. As a reminder, our initial expectations for the August CPI data are that surging gas prices will push headline inflation meaningfully above core, namely an 0.61% increase in the former versus an 0.23% increase in the latter. Our longer term forecasts for core CPI Q4/Q4 rates are 3.6%, 2.5% and 2.5% for 2023-2025, while the core PCE forecasts are 3.6%, 2.2%, and 2.2%. The analogous forecasts for headline are 3.2%, 2.1% and 2.2% for CPI and 3.4%, 1.8%, and 1.9% for PCE.
… Inflation to run well above Fed’s target through 2023. Moderate overshoot through 2024
Goldilocks - China: July activity data broadly missed (low) expectations; PBOC cut rates (sure sounds like a soft landing to me … more on this in just a moment…)
Bottom line: July activity data broadly missed market (low) expectations. Industrial production growth slowed in July amid falling export growth, weighed on by slower output growth in electric machinery & equipment and automobiles. Retail sales and the Services Industry Output Index both reported lower year-on-year growth in July, on unfavorable base effects. Fixed asset investment growth also dropped in July, due mainly to slower infrastructure and property investment growth on the back of challenging weather conditions, slow government bond issuance, and still-tight funding conditions for private developers. Property-related activity remained depressed in July, with a continued, significant divergence between new home starts and completions. Following the PBOC's surprise policy rate cuts today, we expect 1-year and 5-year LPRs to be lowered by 15bps on 21 August, and now believe there could be further monetary easing through the remainder of this year, including two RRR cuts (25bps in September and another 25bps in Q4) and another 10bps policy rate cut (in Q4). Relative to our earlier forecasts, which envisaged one RRR cut in Q3 and one policy rate cut in Q4, this implies one additional 25bps RRR cut and one additional 10bps policy rate cut in H2. Further demand-side stimulus (e.g., additional LGSB quota, faster fiscal expenditure, more housing easing in large cities) will be needed as well to more effectively boost growth and confidence.
Goldilocks - Global Views: Runway in Sight (save you the few mins — it’s gonna be different this time, SOFT LANDING heck, might as well call for NO landing — all is well, nothing to see here, back to your cars, shows over…)
Although most forecasters still predict a recession, we think the runway for a soft landing is in sight. US economic activity remains resilient, the labor market rebalancing is making progress, and the recent CPI and PCE data suggest that disinflation may now be running slightly ahead of schedule. While DM hiking cycles are in their final innings—and the Fed is likely done—our rate views remain mostly hawkish to the forwards as we expect central banks to cut only gradually toward neutral in the absence of a recession. We expect both long-term rates and oil prices to stabilize around their new, higher levels, helping risk assets regain their footing in coming months.
WisdomTree - Prof. Siegel: Someone at the Fed is Paying Attention (when yer relying on ‘someone’ — FRBSF — to be seeing / thinking what yer thinking — namely dis-inflation — it’s NOT time to stop worrying, imo)
Last week the big news of the week was the inflation data—with both the CPI and PPI releases.
The CPI and PPI came in extremely close to expectations and continue to show a moderation in inflation. Using our real time data for housing, the data are even better, with our measure of core CPI inflation utilizing real time housing data dropping to 1.5% from 1.7% last month year-over-year—while the official core CPI still prints at 4.7% driven by 7.7% shelter inflation. The San Francisco Fed wrote a paper on the trends in inflation that forecasts the official BLS shelter inflation could go negative later in 2024—confirming all that I have been saying of the biases in the official stats. It is good to see someone at the Fed is paying attention!
The PPI was a little hotter than expected but interestingly 40% of the increase came from a rise in asset management prices. The long-term trend is clearly for lower priced asset management solutions (like ETFs) gaining share at the expense of higher cost solutions. I would look for this datum to get revised down in the future.
The odds set in the Fed Funds Futures markets show a very low probability of a September increase in the Fed Funds Rate. The market is not giving up on a hike later in November, but we have a lot of time for the data to come in. The primary data to watch week to week is the jobless claims as the earliest indicator of softness in the labor market. We did have an unexpected jump there last week, but one week means little, especially in the summer. We will be looking closely this week.
We continue to have firmness in commodity prices. This removes one of the positive trends in inflation and might concern the Fed—although their primary focus is on the core numbers. Right now, the headline numbers are cooler than the core numbers, but that could reverse if recent trends hold with oil hitting the upper end of its range.
The economy remains strong, and we still don't see any deterioration in the economic reports. As we get through August and September, as people come back from their vacations and see the credit card debt has built up, sometimes we might see a cutback in spending. I don't think that would hit until late September.
I should also comment about labor costs—particularly with the outsized huge demands of the United Auto Workers (UAW) union. The demands from the UAW, if they're totally implemented, which is unlikely since it's a bargaining position, would be 10s of billions of dollars for those companies. Tesla is not a union shop, and the market weight of Tesla far exceeds the market share of Ford and GM in terms of how this impacts the S&P 500. But the UAW demands are symbolic of a trend we’ve discussed many times. Workers have fallen behind inflation. They did not have cost of living clauses and now are asking for a catchup in wages. Of course, they're pointing out the huge salaries of CEOs, but the big driver is to catch up to past unexpected inflation.
To overcome these higher wage costs, we will need to see better productivity. And here the data have come in quite well—just as I predicted it would. Better productivity trends are very positive for the economy. Even with a softening labor market, we could still get GDP growing at a rapid rate.
For the markets, I don’t see any motivation for major trend changes. Momentum is trending higher and likely to keep that way. There’s still some disbelief about a rally, which means it would keep going. Earnings came in very well for the second quarter, without any huge warnings about profit deterioration for the third quarter. The Nasdaq and higher priced stocks have faced some rotational pressures with the 10-year Treasury’s rise over 4%. That is natural and I believe the resilience of the market does favor value stocks. If we see those jobless games begin to rise significantly that will put a damper on any further rise.
There will be a lot more data before the September 20th meeting. But I think Powell is getting the message we don’t need to squeeze the economy much more to get inflation under control.
Yardeni - Bond Vigilantes Running Into Some Resistance (what seemed like it was gonna be a good read, turned out to hit a brick PAY wall … sorry … BUT, reference to ‘The bond bulls — INCLUDING US, FOR NOW — catches one’s eyes, no?)
The 10-year US Treasury bond yield continues to run into resistance around 4.25%, which was last year's high (chart). The bond bears led by the Bond Vigilantes would like to see the yield rise well above that level to demonstrate that they are unhappy with the government's profligate fiscal policies. The bond bulls--including us, for now--see the current level as an attractive one if inflation continues to moderate and more Fed officials talk about lowering the federal funds rate next year if this happens.
AND for us visual learners, our inner techNAmentalists, as well as a few OTHER random items from the intertubes,
High “risk free” Treasury yields make dividend yields look downright puny right now. As shown below, three years ago in August 2020, the S&P’s dividend yield of 1.79% was more than 45 bps higher than the highest yield on the Treasury curve (the 30-year at 1.33%), and every Treasury note with a duration shorter than 5 years had a yield below 0.20%! At the time, the "TINA" (there is no alternative) trade was in full effect.
Fast forward to today and the S&P’s dividend yield of 1.55% is 260 basis points (2.6 percentage points) lower than the lowest point on the Treasury curve right now (the 10-year at 4.15%). The 6-month T-Bill yielding 5.49% is close to 4 percentage points higher than the S&P’s dividend yield. Investors have gone from TINA to TIAA indeed.
… More than $1.8 billion came out of the $39 billion iShares 20+ Year Treasury Bond ETF (ticker TLT) last week, the most since March 2020, data compiled by Bloomberg show. The fund's price had dropped more than 3% the week prior and another 1.2% in the five-day stretch ending Friday …
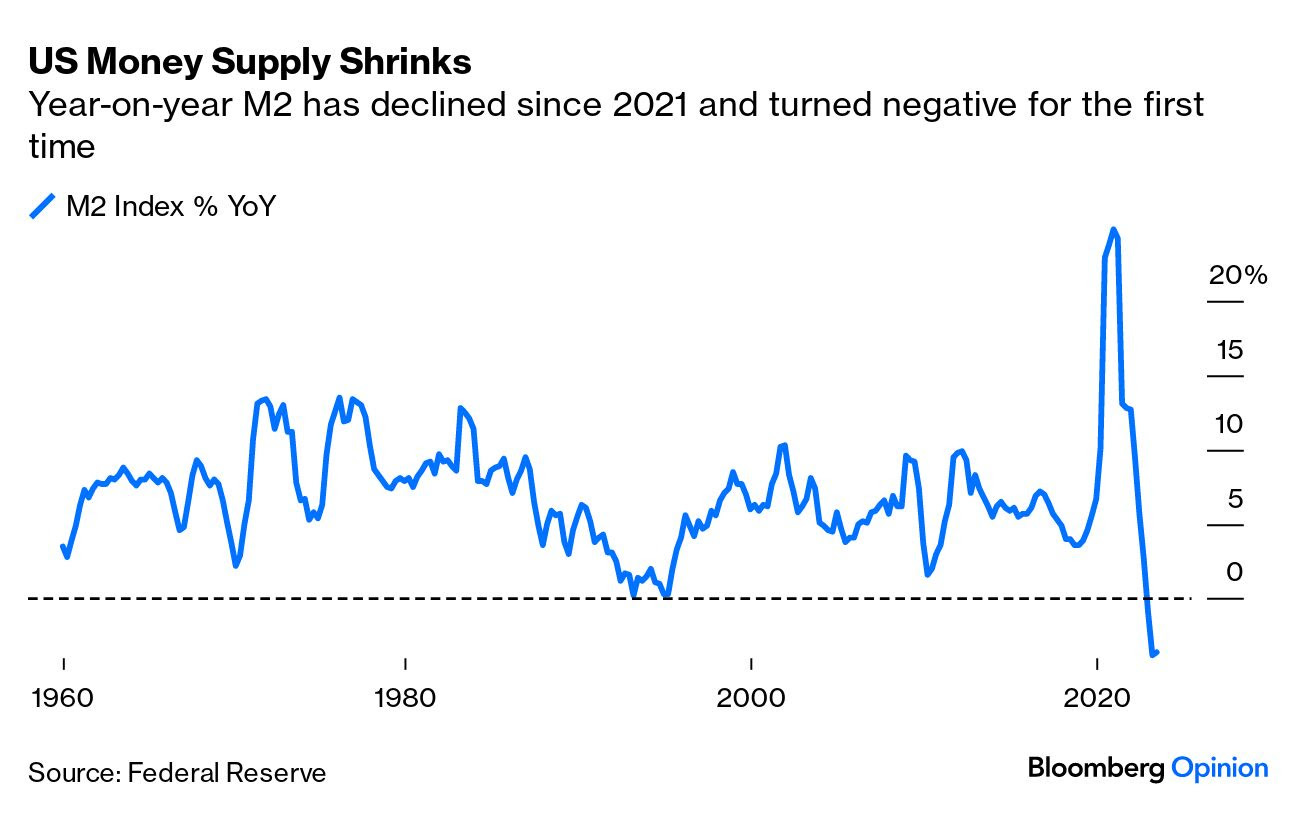
Liquidity is drying up. So says almost everyone. But what is liquidity, and does it really matter?
At the risk of oversimplifying, liquidity can be viewed as access to cash, which impacts the ease of trading in a certain market. It’s contentious, and experts we’ve spoken to over the past month have used different analogies, butliquidity is often likened to pipes. There isn’t just a single big one that we can turn on and off. They come in various sizes, some with stronger flows than others thereby affecting how influential they are. With pipes, if you’re talking about them at all, the chances are that something’s already gone wrong and you’re calling the plumber; the same is true of market liquidity.
Let’s first look at broadly defined money supply, or M2, the “pipe” that investors look at most. M2 measures M1 (currency and coins held by private banks, travelers’ checks, etc.), the money in US stocks, deposits under $100,000, and shares in retail money market mutual funds, according to the definition of the Federal Reserve Bank of St. Louis.
The following graph shows the year-on-year change, which has tumbled and gone negative for the first time since the series started in 1959. This explains why investors have been talking about a drain in liquidity:
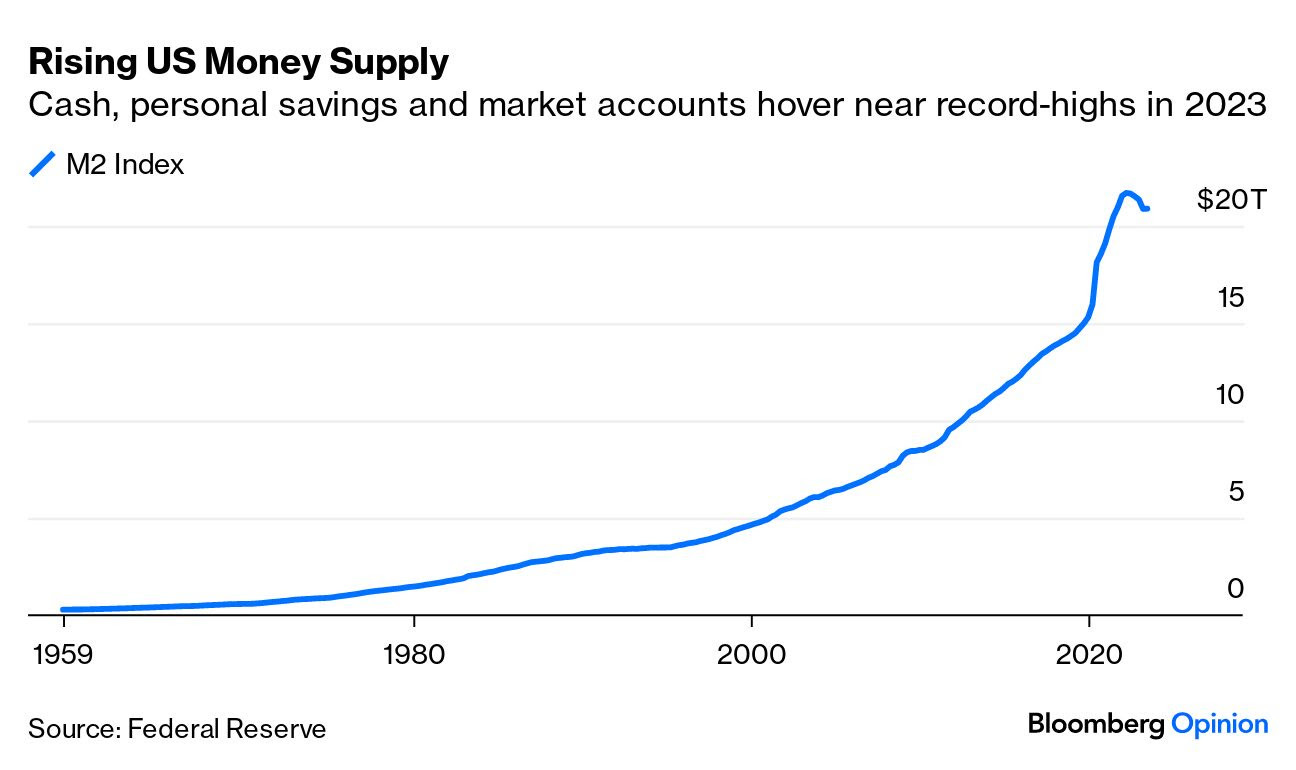
But what matters most? Yes, the supply has shrunk over the last 12 months, but that’s after the massive increase in the early months of the pandemic. In total, M2 is still hovering near all-time highs. Should we care about the percentage flow, or the total amount or stock of money?
… For others, liquidity drives everything. Mike Howell of Crossborder Capital, which publishes several indexes of global liquidity, says flatly that “if the money is anywhere, it has to be somewhere.” His measure bears out the contention that over time “bad things happen when liquidity tightens and global risk markets have duly wobbled”:
… Where does all this leave us? The money supply growth numbers aren’t as terrifying as they first look. But it’s beyond denying that over history, swings in liquidity have driven some major market accidents, and there are other factors that could dry up the market. Or put very simply — we do need to talk about the plumbing, and that in itself is cause for vigilance.
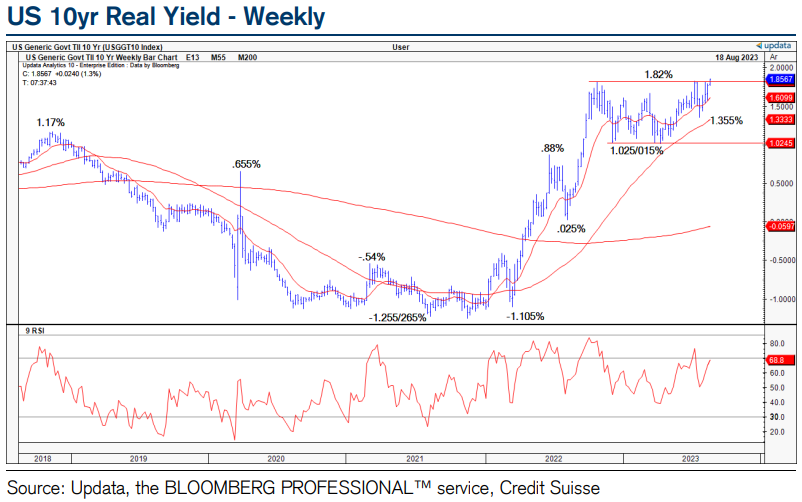
CSFB Technical Analysis - Fixed Income Tactical Outlook
Chart of the Day: 10yr US Real Yields have surged above key support from their top of their long-term range at 1.82%. Assuming we see a sustained close above here, this would mark the completion of a large and important bearish continuation pattern to warn of a further and we think meaningful rise in yields. We would see next support at 1.98/2.00%, then 2.15/2.21%. Concerningly though, the “measured objective” from the pattern would be seen set some way higher than this…
…and our concern with respect to rising Real Yields is that this would also be negative for different asset classes, and we think likely “risk off”. We already maintain a tactical negative outlook for the S&P 500, and we think this would reinforce this view further for a test of its 63-day average, currently at 4387, but more likely support at 4328/02. It would also suggest we should see further USD strength.
10yr US Bond Yields stay seen on course to test long-term support at 4.27/4.405%, and probably towards the upper end of this zone.
30yr US Bond Yield are also seen on course to test their key long-term support at 4.42/4.46%.
… Whilst we would look for fresh buyers to show at 4.42/4.46%, should weakness directly extend and a weekly closing break higher be seen this would suggest we can see a further rise in yields to test the series of yield highs posted in 2008, 2009, 2010 and 2011 at 4.80/4.86% ..
German 10yr Bond Yields above 2.645/2.675% suggests the broad converging range is being resolved higher for the completion of a large bearish “triangle” continuation pattern.
CSFB Technical Analysis - Equities Tactical Outlook (focuses our attention on a far away land in a distant, unrelated to BONDS, galaxy … Taiwan semis)
Chart of the Day: The sharp sell-off in the Taiwan SE today has seen key support from the 16594 July removed to mark the completion of a near-term top. This suggests the outlook for the next 2-4 weeks has turned negative and we look for further weakness to 15968 next, then the 38.2% retracement of the 2022/2023 uptrend and 200-day average at 15617/477.
Nasdaq 100 is similarly expected to see a test of its 63-day average, now at 14872. (for those of us who are still thinking about tech stocks as they relate TO yields directly … Yahoo“Tech stocks have a yield problem…)”
Continue to think of the Ten Year Treasury Yield $TNX as one of the most important (if not the most important) charts of 2023. Still very much a rising rate environment which does not usually bode well for growth stocks. Higher highs and higher lows = uptrend.
This does NOT “guarantee” a low or bottoming process for bonds. BUT, FWIW 10-week average of 2-year T-Note trader sentiment recently hit the lowest level it’s ever recorded. Time to be looking for a bottom?
The U.S. Dollar has been in a choppy rising trend higher since bottoming in 2007/2008.
You can see that rising channel in today’s long-term chart (above).
BUT King Dollar has been under pressure in recent months. So if the U.S. Dollar wants to keep climbing into year-end, it will likely need a jump-start soon! If not, it may continue to weaken and provide a tailwind to precious metals like gold and silver…
… This is a huge spot for King Dollar. A bounce higher would keep the currency in the upper half of the rising channel, while a break lower would open the door for further downside while providing a tailwind for gold, silver, and the miners.
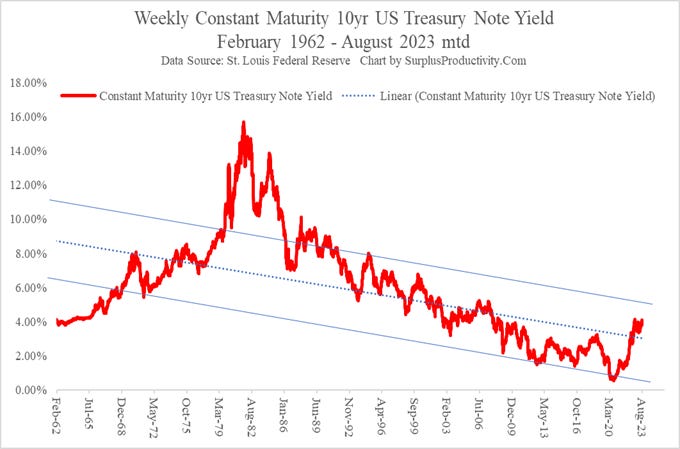
Surplus Productivity’s Paul Winghart - You Need Lines In Order To Read Between. (offers up some long-term TLINE eyecandy not completely unlike what John Authers noted yest — HERE)
… We tend to shy away from homing in one particular yield, not only because we respect the art and science of technical analysis too much, but also because we believe that yields are insightful when comparing and contrasting them to other yields, typically of the same quality. That’s a long way to say that we prefer sp|READ|s because whenever you have to infer something important you always have to “read between the lines” (see what we did there?). Nevertheless, a lot of other economic content providers don’t feel this way and, in the hopes of driving views, are more than happy to sacrifice the integrity of the information for a quick click. Therefore, we thought we would very quickly provide not one chart with one line but three charts with three lines in order to drive our point. Notice the data is exactly the same on all three charts so the question isn’t necessarily which one will you choose to look at but rather should be why did we use the constraints that we did? To give you some insight into how we approach these things, here are some questions we’d ask ourselves.
Weekly 10yr CMT yield with a linear trend line and channel.


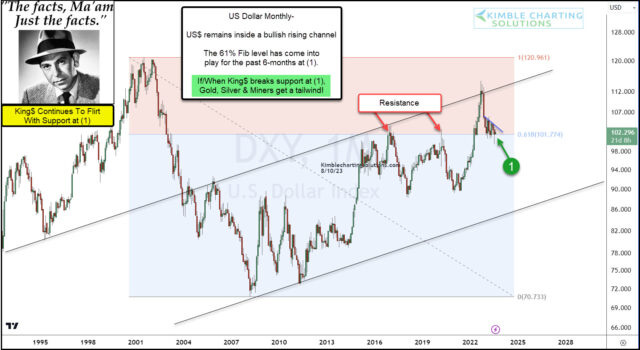

With the BRICS summit Aug 24th, huge spot indeed for King Dolla!