o/n; vigilantes; 5s10s Fed'version
Good morning.
10s vs 2.16/18 seems to have held. For now…With FOMC behind us (and one ‘vol event’ moving from unknown to KNOWN) and a (5s10s)curve inversion now something more than a few of the markets cool kids are talkin’ about (see below), global markets are once again free to (re) focus back TO geopolitical landscape.
Ahead of the FOMC meeting, a short note and (longer-term) visual of 30yy in some hit inboxes asking a very good question,
Jesse Felder’s Report: Are The Bond Vigilantes Back?
The long-term chart of the 30-year treasury yield may now be the most important chart in the world. For the past 30 years or so, the yield on the long bond has formed a fairly neat channel that has only been violated relatively briefly at times. The drop below 1%, at the height of the Covid panic, tested the lower end of that channel. Since then, it has reversed higher and now appears poised to test the upper end. This area also coincides with key horizontal resistance at 2.5% that dates back to the lows put in at the height of the Great Financial Crisis.
In reversing from its low two years ago, the 30-year yield has also formed a pretty clear inverted head and shoulders pattern so it appears we are at a crucial spot for the multi-decade bond bull market. A reversal lower here for the long bond yield would suggest that the bull market remains intact; a breakout higher, however, would suggest it has finally come to an end. It would also indicate that, after a very long hiatus, the bond vigilantes may have returned and are determined to pressure a Federal Reserve that has fallen further behind the curve than ever before.
QUICK VIEW: It would seem to ME that vigilantes have in fact woken up to high and rising gas prices (blame Putin or whoever else politically fits your desire) and may, in fact, be pushing things (stocks as well as global rates) around here. Whether or not the combo of vigilantes, the USs admin (I’ll let you decide if you are happy with current course of our leadership), Putin, global central bankers all combine to create (another)perfect storm (2018 or perhaps worse, 1937) and collectively BREAK SOMETHING. It seems more to ME to be more than likely that is what this first 24hrs POST FOMC are saying and I’d think that supports the longer-end of the curve.
An aggressive global central banking community in effort to bend — dare I say FLATTEN — the DEMAND CURVE to achieve this goal.
From what point that may be, is the $64,000 question. Clearly having missed this move higher (in theory, as I’m no longer in a seat of relative consequence) feeling only slightly better buy following along with the curve flattening move more than a few have / continue to suggest.
On said curve flattening AND whatever you think it does/doesn’t signal, ZH and DBs Jim REID
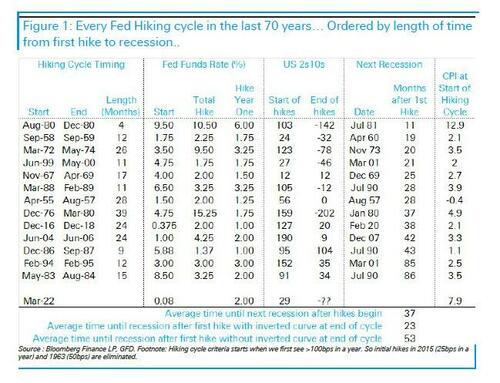
All Hiking Cycles That Invert The Curve Lead To Recessions Within 1 To 3 Years
… That said, the table from DB below shows the details of every Fed hiking cycle over the last 70 years alongside the time to recession, yield curve shape, and inflation at the first hike. Reid has ordered this by length of time from first hike to recession to demonstrate that the quickest recessions following hikes were associated with an inverted curve by the time the Fed stopped hiking.As shown, on average it takes around three years from the first Fed hike to recession. However all but one of the recessions inside 37 months (essentially three years) occurred when the 2s10s curve inverted before the hiking cycle ended. With all the recessions that started later than that, none of them had an inverted curve when the hiking cycle ended. In fact, hiking cycles that ended with the curve in positive territory saw the next recession hit 53 months on average after the first rate hike, whereas the next recession for hiking cycles that ended with an inverted curve started on average in 23 months, just under two years. All these cycles eventually saw an inverted curve but this happened after the Fed stopped hiking…
Ok then … I promise to get back TO FOMC in a moment but for now, here’s what happened o/n,
WHILE YOU SLEPT
Treasuries are higher and the curve flatter, continuing yesterday's late-r day trends. DXY is lower (-0.32%) while front WTI futures have rebounded sharply (+4.4%). Asian stocks were sharply higher following yesterday's NY rally (NKY +3.5%, Hang Seng +7%), EU and UK share markets are mixed while ES futures are showing -0.2% here at 7:10am. Our overnight US rates flows saw a straight-line rally during Asian hours led by the 5-10y sector of the curve. Our desk also noted heavy buying in US credit from the region that allowed 30yrs to somewhat keep pace with intermediates. Real$ names also bought the front end after yesterday's hold near 2% 2yrs in NY. Overnight Treasury volume was solid at about 135% of average overall with 20's (245% ahead of next week's auction), 2's (179%) and 30's (155%) seeing some relatively elevated turnover…… " I think if the Fed continues to anchor the long end with its guidance on the neutral policy rate, it is almost certain that the curve will invert." @TimDuy …
… The 30y bond chart that highlights 2.44% is all we have as an attachment for you this morning. We could show a host of curve charts breaking down and testing/breaking their 2018 lows and such. Instead, our interest in curves is more for that time when we begin to get indications that the brushfire of flattening has begun to burn out. We could see those indications soon, or not, and we'll have to see how it goes. In the meantime, I just need a full day to graze the pictures to seek potential trend opportunities after yesterday's ructions. I'll share findings with Ed who may post them this afternoon if he chooses….
For even MORE, BMOs morning thoughts (Just 18.5 bp to go...)
… Overnight Events
* Japanese Core Machine Orders, Jan – declined -2.0% MoM vs. -2.0% forecast and +3.1% Dec. YoY unchanged at 5.1% vs. 8.7% consensus.* MoF data showed Japanese investors were net sellers of -$1.4 bn in overseas notes and bonds during the week ended March 11 versus sales in the prior week of -$3.1 bn. Six week moving-average increased to -$4.1 bn vs. -$4.7 bn prior.
Overnight Flows
Treasuries rallied overnight as the post-FOMC dip-buying theme has come to fruition. The long-end of the curve benefited the most from the bid. Overnight volumes were elevated with cash trading at 108% of the 10-day moving-average. 5s were the most active issue, taking a 29% marketshare while 10s were second at 25%. 2s and 3s combined for take 32% at 20% and 12%, respectively. 7s managed 6%, 20s 1%, and 30s 6%. We’ve seen better buying in 10s and 30s.
… and for some MORE of the news you can use » IGMs Press Picks for today (17 March) to help weed thru the noise (some of which can be found over here at Finviz).
In as far as what happened yesterday, these charts from John Auther’s morning commentary (The Day the Fed, Putin and Xi Threw in the Towel) caught my eye,
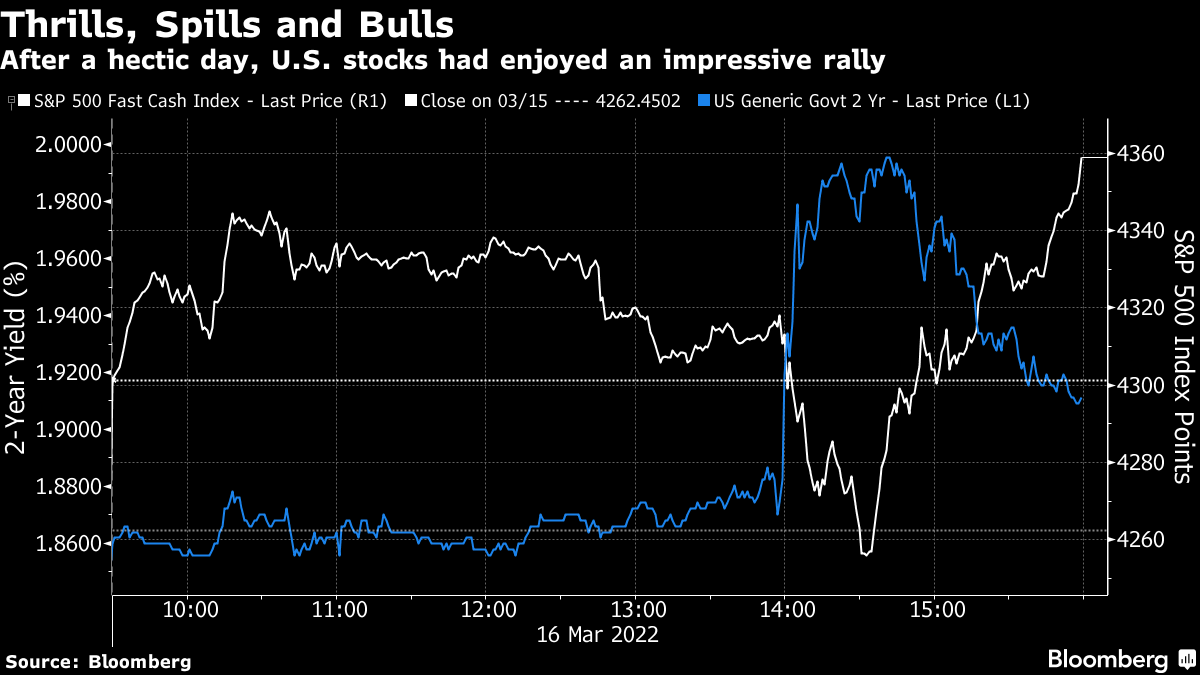
… Even though the rate hike had been very well telegraphed in advance (unlike, for example, the shocking hike of 1994 that provoked a bear market in bonds), the initial reaction made this the most extreme reaction to the beginning of tightening cycle. But by the close, bond yields had given up much of their gains. That reversal was mirrored by an even more emphatic volte-face for the stock market:
The S&P 500 had tumbled to show a loss by 2:30 p.m., the beginning of the press conference. By the close, it was at its high for the day, and had just had the best two-day rise in two years. This chart would be easy to explain if Powell had offered any dovish hints to the news media…
… The inconsistencies in the Fed’s projections, and arguably the desperation with which Powell insisted that the economy was strong, might be said to support this. Put simply, the notion is that investors took a look at yields at 2% and thought, “This can’t possibly work.” The moment of revulsion, or realizing that the market was bound to collapse under its own logic, had been reached. People taking this line could support the yield curve. This is how the spread of 10- over five-year Treasury yields has moved this century:
In the wake of the Fed’s announcement, the relationship inverted, meaning that five-year bonds yielded more than the 10-year; the dreaded “inverted yield curve.” It was the first time this relationship had inverted since early 2007, shortly before the beginning of the credit crisis. Whenever the yield curve inverts, it tends to function as an early warning for a recession, suggesting that in the medium term rates will have to fall. Any inversion is a worrying sign, although one between five and 10 years, in the so-called “belly” of the curve, is not as alarming as an inversion between three-month or two-year yields and the 10-year yield.
The argument is that any sign of a yield curve inversion will force the Fed to abandon its tightening. Yield curve inversions make life hard for banks, which make their profits from the difference between short- and long-term rates. In the face of a curve inversion, over history, the Fed has been forced to desist. So, there is an argument that stock investors saw that the bond market was already effectively saying that the Fed couldn’t get what it wanted, and so started to buy stocks as a bet that rates wouldn’t rise that much…
For somewhat MORE and in the hindsight being 20/20 category, Goldilocks
Then there’s THIS from JEF
Happy Saint Patricks (anniv of his death in this day in the year of 461) Day!
… that’s all for now. Off to the day job…


