o/n; Bear sold TO JPM; the day c19 nearly broke mkts
Good morning … On this day in 2008 Bear collapses, sold TO JPM (History.com) and in 2020 …
… A downdraft in bonds was now a rout …
For more, WSJ detailing March 16, 2020:
The Day Coronavirus Nearly Broke the Financial Markets
The March 16 stock crash was part of a broader liquidity crisis that threatened the viability of America’s companies and municipalities… But that Monday, investors no longer believed certain money funds were cash-like at all. As they pulled their money out, managers struggled to sell bonds to meet redemptions.
In theory, there should have been some give in the system. U.S. regulators had rewritten the rules on money funds in the wake of the 2008 financial crisis, replacing their fixed, $1 price with a floating one that moved with the value of their holdings. The changes headed off the panic that could ensue when a fund’s price “breaks the buck,” as one prominent fund had in 2008.
But the rules couldn’t stop a panicked assault like this one. Rumors circulated that some of State Street’s rivals would be forced to prop up their funds. Within days, both Goldman Sachs Group Inc. and Bank of New York Mellon Corp. stepped in to buy assets from their money funds. Both firms declined to comment…
On this memorable morning, we’re waking up TO a risk ON tone — stocks UP, yields UP — where HOPE for peace in Ukr/Russia situation lives on — FT HERE,
This ‘risk on’ tone ALSO being bolstered overnight by CHINA PLEDGING SUPPORT - RTRS,
China will roll out policies favourable for capital markets, vice premier says
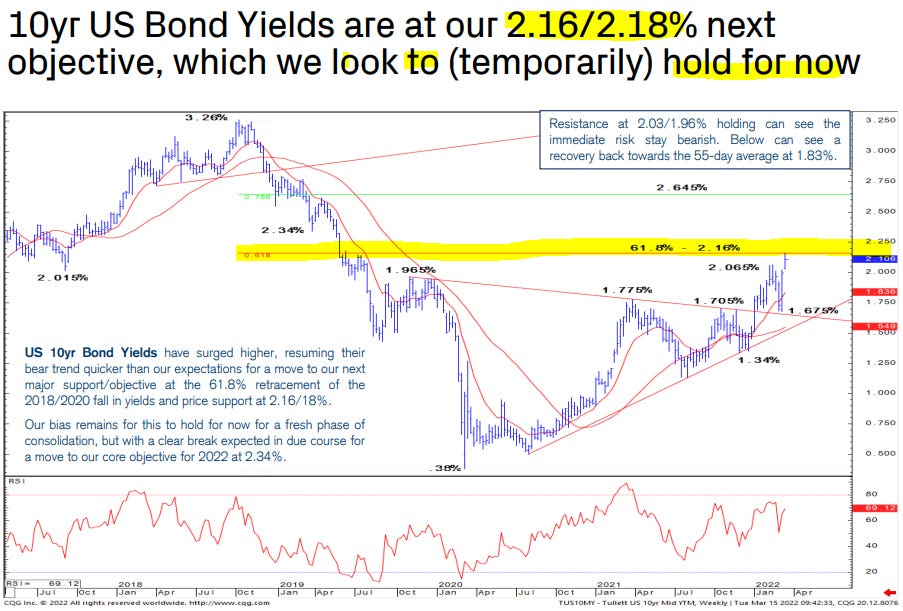
It is with this in mind, 10yy right at what looks to be ‘support’ (2.16% — see below), we’ll jump in TO what occurred,
WHILE YOU SLEPT
Treasuries are modestly lower in a belly-led move ahead of the FOMC and amid stronger stocks and early signs of compromise in the Ukraine-Russia negotiations (see above). DXY is lower (-0.45%) while front WTI futures are FLAT (off earlier highs on the 6:10am comment from the Kremlin) this morning. Asian stocks were paced higher by huge up-moves in Chinese shares (Hang Seng +9%, HS China Ent +12.5%) after supportive government comments, EU and UK share markets are all 1% (FTSE 100) to 3.25% (SX5E) higher while ES futures are showing +1.3% here at 6:45am. Our overnight US rates flows saw a tight range in Asian hours with slightly better buying seen in the belly this morning. Overnight Treasury volume was a bit below average overall (~90%) with 7's again seeing some decent relative average turnover at 132% overnight.… Our second attachment is a look at Japan's net foreign bond flows where the country has been a net seller since roughly the middle of January. This morning's last attachment is an updated look at the 3y1y - 1y1y OIS curve which got to near -40bp inverted just a few closes ago. So the market seems a little 'palms-out' on the idea of a soft landing being achieved...
… and for some MORE of the news you can use » IGMs Press Picks for today (16 March) to help weed thru the noise (some of which can be found over here at Finviz).
10yy hanging around SUPPORT and bonds near psychologically important 2.50% — give or take — all important ahead of this afternoons FOMC meeting.
With THAT being the largest theme of the day, a few appropriate links/visuals and an IDEA from the best in the biz (large Canadian shop) put out this one yesterday morning. While a bit ‘dated’ now, still some provide some food for thought,
Sell 5s vs. 2s and 10s on Dovish Hike Potential
As the Treasury market continues to consolidate ahead of tomorrow's FOMC decision, the recent underperformance of 5s versus 2s and 10s has paused - providing an opportunity to reset a short versus the wings on this butterfly in anticipation of a dovish hike. As the included chart shows, the current level of 17.9 bp is above the 200-day moving average of 16.5 bp (which should function as interim support). Our initial target is the 50% Fibonacci retracement at 21.3 bp. Once breached, we see little to prevent a move to the 74-day moving average at 27.7 bp. Stochastics remain sufficiently bearish on the belly with room to extend further in the favor of the underperformance of 5s. This is a short-term, tactical trade based largely on our assumption that while liftoff is imminent, the updated SEP Dot Plot will not reflect more than five quarter-point hikes in 2022. Any greater hawkish expression will be in dots in 2023/2024 and ultimately feed into the terminal policy rate debate -- even if there is little case for a change in the long run dot tomorrow. Moreover, this is consistent with the fact the belly tends to lead during a downtrade in an environment in which the Fed is removing accommodation. It also reflects the risks of the FOMC normalizing rates with the backdrop of ever-increasing geopolitical uncertainty, renewed covid concerns, and budding worries that higher consumer prices will ultimately curtail real economic growth. Food for thought as we await the Fed.
A few other choice excerpts and links (where possible) for some funTERtainment.
First, a weekly macro chart pack where this visual caught MY eyes given 10yy just ABOVE 2.16% at the moment,
Watching 2.18% then for now AND if yer interested/curious in stocks — specifically where the Fed Put is or may be — well John Authers interpreting latest BAML fund manager survey (HERE for The Bears of War and ZH: Wall St Mood Turns Apocalyptic: Majority Sees Bear Market & Stagflation; Optimism Lowest Since Right Before Lehman)
… Another very useful question asked fund managers to name what they believed the strike price of the “Fed Put” would be — in other words, the level to which the S&P 500 would have to fall to force the Fed into giving up on tightening money, and coming to the rescue of the stock market instead. There was a wide range of estimates, but the consensus puts the level at 3,636. That implies the Fed would let the market fall more than 24% peak to trough, and that it would need to fall another 14% from where it is now to change the Fed’s course:
As the chart shows, this still implies that the Fed would act when the stock market remained above its levels from immediately before the pandemic, so expectations may continue be too bullish for stocks…
If or WHEN Fed hiking cycle were to impact stocks (or whatever else might be responsible for sending stocks lower towards their Fed Put engagement levels), something else to watch will be credit spreads. DB noting this yesterday
DBs Ruskin ahead of the FED,
Interested in FF visual - annotated with various financials crisis? DBs CoTD,
… As we start the hiking cycle, it’s worth highlighting that hiking cycles in the fiat money era (1971-), when debt has been constantly increasing, have generally eventually led to a financial crisis somewhere around the world…The one caveat is that monetary policy usually acts with a lag. So the problems associated with tomorrow’s hiking cycle start won’t be immediate. To paraphrase Warren Buffet, the tide will have to go back a fair bit from here to see who has been swimming naked. With inflation as high as it is, the Fed really have no choice but to take us back from high tide but history suggests consequences.
And that’s gonna have to suffice. Given that time of year, well,
… that’s all for now. Off to the day job…


