o/n -- Putin sticksave? 1937 analog; 5y5 fwds; hikes ≠ poor bond returns (a Rareview indeed)
Good morning…this
ZH: Stocks Pop, Crude Drops After Reports Of Putin 'Peace' Optimism
Stocks are UP bonds are down and hope continues to be a strategy.
Hope aside, here are weekly 30yy with some context
That visual in mind, recall what happened yesterday with this weeks selloff in bonds,
ZH: Stellar 30Y Auction Sees Foreign Demand Surge To 2nd Highest On Record
… The internals however were remarkable, with Indirects being awarded a whopping 71.52%, up from 67.95% last month and the 2nd highest on record, with just July 2020 higher.
In as far as what happened overnight from a US money center bank
… WHILE YOU SLEPT
Treasuries are modestly bear-flattening as US and European equities look past the MSCI Asia Pacific index decline of -2% overnight. *PUTIN: CERTAIN POSITIVE SHIFTS IN TALKS WITH UKRAINE: IFX - this headline is reshuffling the deck early in US hours. EGB yields have backed up, with Eurozone peripherals outperforming and spreads narrowing against the background of ECB comments that highlight increased flexibility on rate hikes. the German 10-year is up 2.5 bp at -0.29%, the Gilt rate up 1.6 bp at 1.54%, while the 10-year Treasury rate has lifted 2.3 bp to 2.00%.
Same firm offering some techAmental views and a different analog … at least not one I’ve seen tossed around lately. Think 1937? They frame and update equity bible with a couple of more than interesting charts and conclusions.
For example, I did NOT know that the S&P returns
… 1936: Up 28%. 1937: Down 38% … So, a fall of 14% was what we suggested was a danger this year (Mea culpa- I have recently for some unexplainable reason been referring to this view as a possible 11% fall when the number should be 14% as noted in our 12 Charts Of Christmas)
… Bottom line:
A weekly close below 4,201.50, if seen, would increase our levels of concern and suggest the danger of a much deeper move towards at least 3,600 (About 25% drawdown) and possibly a bigger down year than 14%A move below 3,663, if seen, would open up the danger of a bearish outside year as seen in 1937 and only 3 times in total over 90 years.
… and for some MORE of the news you can use » IGMs Press Picks for today (11 March) to help weed thru the noise (some of which can be found over here at Finviz).
HERE are today’s FIVE THINGS from BBG because of what Garfields interested in
In as far as a few things I’ve seen/read which you may be interested in…
First up from 1stBOS is an updated look at 5y5y fwd rates and some tech levels to watch/engage,
Chart of the Day: Receding concerns about the Russia/Ukraine conflict have led to a stabilization in equity markets, where we now see scope for a period of consolidation. Market attention is likely to turn back to the Fed next week and there may be a window for deeper selloff in global bond markets. Key in our view is the US Treasury 5y5y forward rate, which has been trading in a broad range since June last year. A break above the top of this range at 2.185% would confirm a clear inverted “head and shoulders” base to signal a deeper rise, potentially all the way back to the March highs
Firm continues to suggest selling in to resistance, turning tactically bearish. Sell 5s @ 1.625%, 10s @ 1.895% (stop below 1.835%) and bonds @ 2.28% (stop below 2.21%).
Next up an excerpt from money manager which offers a unique view of hikes and resulting impact on rates of return on your bond portfolio. Here’s snapshot,
Rareview Capital – A 'Rare View' That Pinpoints The Neutral Rate Before A Hiking Cycle Begins
In this important investment commentary, we present our proprietary framework to pinpoint the neutral rate at the beginning of the Fed's tightening cycle. Also, we discuss the portfolio construction implications before an interest rate hiking cycle begins and after it is underway…
Sneak Peek: You might be surprised, it's not bad for your bond portfolios…
From BBG and chalking this one up TO the bonds aren’t DEAD (YET) column,
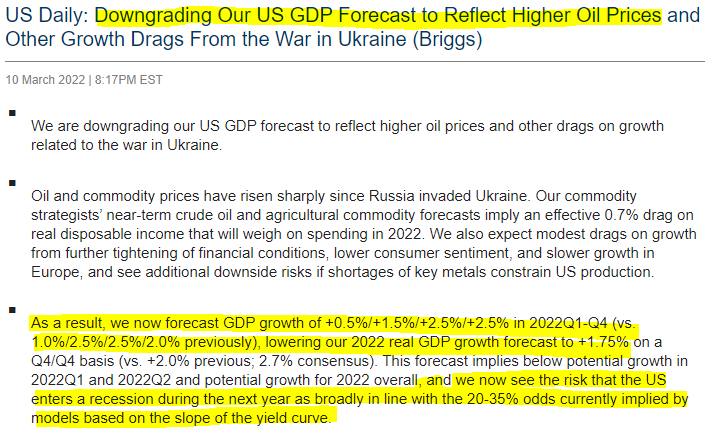
Moving right along TO this, from Goldilocks last night
The punchline from Goldilocks based on yield curve(s) models,
AND in regards to yesterday’s CPI, a couple notes. First, here’s an excerpt (and visual) from today’s early morning read from that large German bank
… In fact US Treasuries saw their biggest shift of the day around the time of the ECB meeting and were basically unaffected by the CPI, with yields on 10yr Treasuries up +3.8bps to 1.99%, whilst the 2yr yield (+2.1bps) hit its highest level since September 2019, at 1.70%. 30 year yields increased +3.2bps to 2.37%, their highest levels for 10 months. In terms of the CPI details, the release saw year-on-year CPI rise to +7.9%, which is the highest in 40 years, and the month-on-month print rose to +0.8%, which was the fastest monthly price growth since October. Core also accelerated to +6.4% year-on-year, which was similarly a post-1982 high. I mentioned the release in my chart of the day yesterday (link here), since it means that the real Federal Funds rate has now fallen to fresh lows once again, and continues to remain beneath levels seen throughout the entirety of the inflationary 1970s.
DataTrek with some further context on CPI and offers,
Today’s CPI Report in A Historical Perspective
… On the leftmost part of the chart is the CPI inflation caused by the end of World War II and the start of the Korean War. Inflation rose quickly to 9-10 percent, but then receded just as quickly thereafter. Even if those periods are the best analogies to today’s supply chain shortage-driven inflation, we can still expect CPI to increase further in coming months.
… The chart below shows that, like overall CPI levels, food inflation is also back to levels last seen in the early 1980s (July 1981, +8.4 pct). Unlike CPI, however, food inflation has been a problem since 2020. Over the last 2 years CPI Food is up +11.8 percent versus +9.7 percent for overall CPI.
Peak food inflation in the 1970s was +20.1 pct in December 1973 and +13.1 pct in February 1979. While both periods were also times of rising energy prices, other issues from increasing exports to a shortfall of Soviet grain production in the early 1970s played a role in high food inflation as well.
The supply chain issues of the post-World War II – Korean War period also sparked food inflation, which peaked at 14-15 percent.
… Takeaway: US inflation has a lot of momentum just now, and there’s not much that will cool it down in the near term.
Next week is a new week with hikes and hopes for some sort of peace to break out alleviating pain at the pump, tighter financial conditions and impact of higher prices generally speaking but …
SAXO: Starting from next week, the market will be left without life support
Summary: This week marks the end of the Federal Reserve’s QE program. Next week, the market will be lacking the life support it received since March 2020, making it prone to volatility and tantrums. Ironically, the same week the Fed's balance sheet stops to expand, the market will need to weather a hawkish FOMC meeting and a possible Russian default.
As always, on lookout for red alerts and various markets closing levels on WEEKLY basis (>daily basis) as we stare down next weeks well-advertised hike.
Markets Go On Wild Ride Amid Russia Crisis As Fed Rate Decision Looms!
… that’s all for now. Likely to have time this weekend to put forward some thoughts given inclement weather expected here in NE. Stay safe.
… Off to the day job


