They SAY a single picture is worth a thousand words. IF these visuals were then turned into NFTs would then everyone sharing said visual owe a copyright?
Chris Kimble charting solutions free blog posed what I thought an interesting MONTHLY (so bigger picture context) visual which may be of interest to those (out of) balanced 60 / 40 fund managers (NOT DEAD YET, change my mind…), as 2021 draws to a close.
Uncertainty is mounting as the new omicron covid variant adds to economic concerns like inflation.
This week, I shared an article looking at potential topping formations on the Transportation Sector (IYT) and small-cap Russell 2000 Index (IWM).
Here we revisit these charts and topping formation, while introducing another potential warning sign.
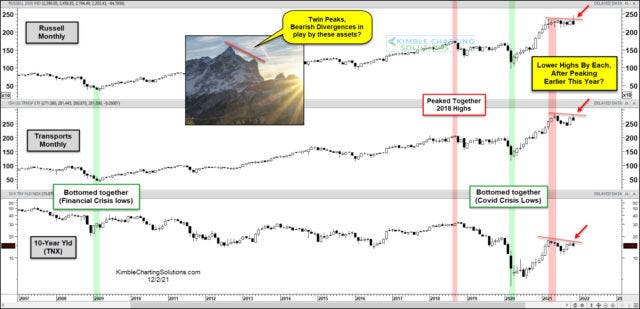
As you can see in today’s chart 3-pack, we added the 10-Year US Treasury Yield to the mix. In 2018, yields, transports, and small caps peaked at the same time. Then in 2020 they bottomed together during the covid crisis.
Twin Peaks once again?
Could this trio be topping again in 2021? Bearish divergences (lower highs) have emerged and offer the potential for more downside. In my humble opinion, bulls better step up and turn this situation around… and soon! Stay tuned!
This is, again, a somewhat bigger picture context offered AHEAD of tomorrows NFP (will it be a SWONKy 750k)?