Good evening … In my earlier note today I neglected to mention I’ll be traveling tomorrow and so i’ll be out of pocket (have your girl contact my girl if you require a refund … wait, am I allowed to say that? Forget it … i’ve already been ‘cancelled’ … nevermind, scratch that…) and so I thought an evening update ahead of tomorrows all important FOMC {DOTS <GO>} on terminal (if that functionality still works) will suffice.
10s back UP towards fresh new recent memory highs …
Thanks for reading The BondBeat! Subscribe for free to receive new posts and support my work.
Hate to lead with a question BUT … are we NOW trading off CANADIAN CPI? Did I miss this memo ...
ZH: Canadian CPI Triggers Panic-Puke In Bonds: 5Y Treasury Yield Highest Since 2007
… or at least we were Tuesday, ahead of 20yr auction …
ZH: Mediocre 20Y Auction Sees Steep Drop In Foreign Demand
… And so not even CAN CPI debacle — which led to a healthy ‘concession’ — helped get the PRICE RIGHT for 20s … Buyers were called to action (‘COME ON DOWN’) and they apparently they said, no thanks…
That’s got to be frustrating (esp to those think of bonds as a ‘screaming buy’
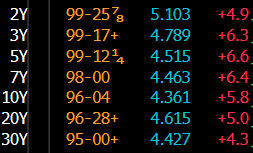
AND SO, I’ll move on … here is a snapshot OF USTs as of 3:02p
… HEREis what this shop says be behind the price action …
… DAILY RECAP Treasuries were little-changed overnight with a modest curve steepening seen into the NY open. But around 8m NY time, the Bund market got hit hard (10y Germany +4bp following hour) after a big, 11k block seller in RX futures was seen alongside large downside trades posted in RX options that were placed at roughly the same time according to ITC. Treasuries were dragged along for the slide. Meanwhile, a large downside miss in housing starts was largely ignored (permits showed good strength) but Canada's big upside beat in CPI (see link above) was not ignored and rates quickly scampered to the highs of the day in the wake. At or near those highs (just after 9am), two apparent block buys in FV futures of 6.7k and 6.6k seemed to stop the bleeding in bonds as terminal pricing held pretty steady near 5.46% out to December while investors awaited the 20-year Tsy auction. Rates were pretty tightly rangebound into and just after the 'screws' auction but a late day downtick took 5yr yields back to and a hair above their major range support visited this morning. We added the next paragraph as a reference for tomorrow and beyond and our focus will be on how markets close against these supports:
Majorsupport levels to watch tomorrow if the bear trend persists through and past the FOMC: 4.34% in Tsy 10yrs, 4.50% in Tsy 5yrs, 5.10% to 5.11% in Tsy 2yrs, 2.00% in 10yr real rates, 2.263% in 5yr real rates, 123-07 in front ultra bond futures (WN1) and 108-26+ in TY1 futures. These are all easily identifiable support levels- typically derived by move 'lows' for each benchmark.
From a bit of a recap of what many / most of you may already know as you’ve lived and traded / invested through it, a couple of THE VIEWS you might be able to use …
Here’s SOME of what Global Wall St has dumped into inboxes across the land …
Apollo - Outlook for Commodity Prices (think EARL…why? cuz it’s got biggest weight in commod index — see chart 6)
Slowing global growth would argue for falling commodity prices. That is also what we are seeing for industrial metals such as copper.
Slowing global growth combined with extreme weather and inventory situations have created a more mixed situation for agricultural commodities. The agriculture price index has been moving sideways, with some components (such as orange juice, cocoa, and sugar) going up and others (such as soybean, corn, and coffee) going down.
For energy, slowing global growth and rising US production would argue for lower oil prices. But OPEC plus production cuts have pushed oil prices higher in recent months.
The sideways movement in the broad commodity price index is likely a welcome development for the Fed. However, a continued rise in oil prices could magnify the ongoing slowdown in growth and reverse the ongoing decline in inflation.
Bespoke - The Last 8 Fed Days (1 day does NOT a pattern make BUT 8 … maybe now we’re talkin’)
Fed Chair Jerome Powell and Co. are currently meeting in the Board Room of the Federal Reserve's Eccles Building in Washington DC to figure out what to do with interest rates. They'll announce their policy decision tomorrow at 2 PM ET, and then Chair Powell will follow the announcement with a press conference that begins a 2:30 PM.
That a dozen or so unelected appointees (approved by the Senate) get together eight times per year to guide the direction of the largest economy the world has ever known is a major debate in and of itself, but our focus is on the stock market and how the Fed's decisions impact it.
On Fed Days (that is, the eight trading days per year when the Fed announces its rate decisions), the stock market typically gets volatile, especially in the final two hours of the trading day after the Fed's policy decision is released.
Historically, the S&P 500 has actually averaged stronger-than-normal gains on Fed Days, but as shown below, we've seen the opposite over the last year. On the eight Fed Days dating back to last September, the S&P has averaged a one-day decline of roughly 0.80%, and all of those declines have come in the final hour of the trading day from 3 PM to 4 PM ET as traders react to Chair Powell's press conference comments. How the market reacts to the Fed tomorrow, nobody yet knows, but stock market bulls will be hoping for a different playbook than the one seen over the last year.
The roughly 15bp widening in 5y breakevens versus the 25-30% move higher in oil since late June may seem misaligned but our empirical analysis implies this is about fair.
Higher oil has been heavily supply-induced, and the energy move has been offset by softer core, some moderation in inflation expectations, and incrementally tighter financial conditions.
Our outlook is consistent with tighter breakevens in the months ahead, supporting a preference for expressing duration longs through nominal (rather than real) rates.
US 2y yields: We have tested heavy resistance at YTD highs (5.12%) on Tuesday, ahead of FOMC.
This has been our key chart: With price trading within a triangle in past 3 months, we have been looking to a break (be it on the upside or downside). FOMC today could be a catalyst.
To the upside - IF we see a break higher, the next key level to watch will be 5.2750% (2006 high).To the downside, 55-day MA will be watched, with yields having bounced higher off of it twice in the past 2 months. We remind there is a potential 55-200 day MA setup as well.
The most important chart
DBDaily - USTs fresh 16 yr high; Canada CPI beats (h’line recap says it all…)
US equities were little changed again Tuesday, S&P down 0.2%. US10yr yields rose 6bps to 4.36%, highest since early November 2007, US2yr yields up 4bps to 5.09% as the market positions for a hawkish Fed tone…
…. Solid beat on Canada CPI: headline up 4.0%yoy in August, consensus at 3.8%yoy. Trimmed mean and median core measures up 3.9%yoy and 4.1%yoy respectively: trim was 0.2ppts and median was 0.4ppts stronger than expected.
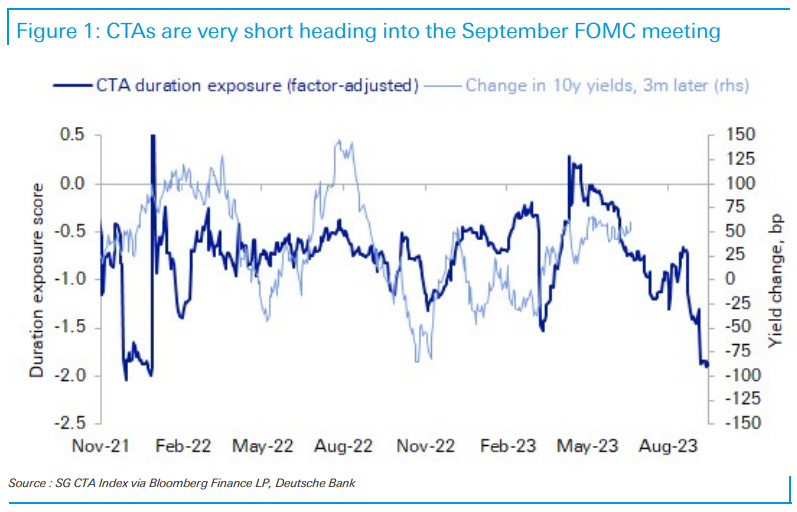
DB - CTAs are very short heading into the September FOMC meeting (positions matter and for every seller there has to be someone thinking ‘screaming buy’)
Systematic CTA funds increased their exposure to short duration in September, based on our analysis of daily returns through 9/15. CTAs’ sensitivity to the Bloomberg Treasury index, adjusted for equities and the UST curve, is currently between negative 1-1.5x, which looks extreme on a 3-year rolling basis. A separate Systematic Positioning Indicator using a different estimation technique also points to significant CTA short positions. (See the latest Valuation, Liquidity, Positioning and Flows chartbook.)
Today's FICOTD shows the CTA positioning metric with subsequent changes in 10yr yields. There is some evidence that CTA position can signal a turning point in rates when the values are large at either end of the range.Extreme CTA shorts suggest a higher probability of a strong market rally if this week’s FOMC meeting produces a dovish surprise, leading to large position swings. The primary catalyst would be via the dots: if the median dot for 2023 comes down, or if the dot for 2024 does not rise as most seem to expect. A drop in next year’s inflation forecast or Chair Powell sounding dovish tones in the press conference could also yield the same effect..
Markets have become more focused on where the funds rate should settle over the long term as the Fed tightening cycle approaches its end. We have consistently argued that the "neutral" funds rate is likely to be meaningfully higher than in the last cycle. Market measures of that rate have moved sharply higher, including over the last two months. Uncertainty about where neutral rates belong is high. But we think that discussions of market pricing of the neutral rate tend to place too little weight on the role of actual and historic market outcomes and what they reveal to the market about where the distribution of policy rates belongs in driving perceptions of these longer-term rates…
…The broader message is that we think it makes sense to rely more heavily on the distribution of the actual funds rate and the behavior of the broad economy and financial conditions relative to those settings to guide views of the appropriate long-term interest rate, compared to the more common structural and statistical estimates, and we worry that many investors still remain too anchored in the experience of the post-GFC cycle. Our preferred framework for the way that US monetary policy operates—in which changes in financial conditions matter more for growth than levels—also provides less of a role for a stable, well-defined neutral rate …
Forward real rates appear to have repriced in stages
JPM - VIEW: Equity valuations are disconnected from rates (um … ok, sounds like we’re supposed to worry …)
Cross-Asset Strategy: Equities are up YTD on multiple expansion while real rates and cost of capital are moving deeper into restrictive territory. History suggests this relationship is becoming increasingly unsustainable, with the S&P 500 multiple over-valued by 3-4x vs. real rates, posing risk to valuations, especially since earnings expectations already face a high hurdle for 2024. The Growth-Policy tradeoff is still challenging for Eurozone, EPS revisions are set to turn sharply negative, and Euro equities are trading better than the macro outturns would suggest, though valuations are beginning to look cheap. The bond sell-off has taken yields back toward cycle highs but given the risk of hawkish surprises from the Fed and BoJ as well as the risk of a government shutdown, we stay neutral duration and keep 10s/30s steepeners. The ECB delivered likely its final hike in the cycle, giving investors the green light to enter end-of-cycle carry themes, and we stay long 5Y Germany and 2Yx1Y €STR swaps. US credit metrics continue to deteriorate, with weakening EBITDA margins a logical result of the current inflation dynamic where wage increases (costs) are outpacing goods inflation (revenue). We use the rally in Euro credit to set hedges. We remain bullish on USD vs. growth/yield challenged currencies (EUR, JPY, CNH) and keep selective exposure to carry. Our robust demand outlook for oil results in an estimated 3.3mbd deficit in 4Q23. In Metals, we examine the potential impacts of a UAW strike…
… Bonds sold off this week amid somewhat stronger US activity and inflation data. In the US, the sell-off has taken yields back toward cycle highs, but while this in principle represents a more attractive entry point given valuations are cheaper, they are not aggressively so. In addition, positioning remains long. Given the risk of hawkish surprises from the Fed and BoJ as well as the risk of a government shutdown, we stay neutral duration and keep 10s/30s steepeners.
… Bottom line: The economic backdrop has been showing clear signs of slowing (with a decline in GDP in Q2 and drift higher in unemployment in recent months.) And that should signal that inflation pressures will ease going forward. But the BoC has one mandate, and that is to target a 2% inflation rate. And the August CPI data took a significant step away from that target rather than towards it. We expect the economic backdrop will continue to soften, and don't look for more interest rate hikes this year. But the central bank won't hesitate to hike interest rates further if inflation pressures don't show signs of easing.
AND from some Global Wall Street views you might be able to use TO some things on the WWW I found funTERtaining and might have missed since I missed yest (and in the case YOU did NOT miss, please forgive any / all duplication
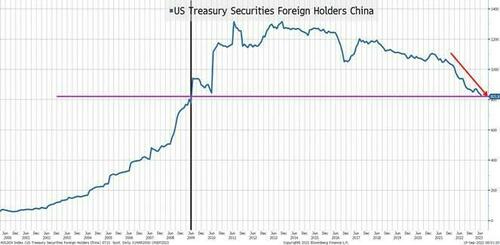
The Foreign Holders of U.S. Treasuries as of July 31st was released yesterday.
Chinese
holdings dropped by $13.6 billion.That seems more in line with “run-off” than actual selling.
I don’t have China’s exact holdings in front of me, but generally foreign central banks tend to hold shorter maturity treasuries on average (it is a dollar/reserve/currency play, not a yield/duration play).
This seems consistent with a country that is having to spend some money to support their economy and doesn’t seem to indicate aggressive selling. Having said that, I think we can safely say, that for the coming months (if not longer) this once net buyer of treasuries will remain a net seller.
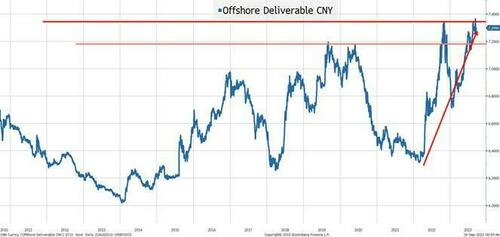
The offshore Yuan is hovering just below all-time lows relative to the dollar. My expectation remains that this will continue to drift lower versus the dollar as their central bank needs to be easy relative to the Fed, but more importantly, it will act to support selling Chinese brands globally.
I found this interview on Bloomberg TV yesterday with the
Mercedes-Benz
CEOfascinating. It starts with the host trying to delve into trade issues between China and Europe. The CEO gives some very good (and politically correct) responses in regards to free trade, open markets, etc. The part of the interview that fascinated me, was his discussion of how his company discovered a long time ago, that they could and should sell autos outside of Germany. He talks about the Japanese and Korean auto makers moving beyond their borders in the past –i.e. it is a natural progression to sell your brands beyond your borders.
He seems very prepared for the competition, though he does repeat the need for a “level playing field” and his company’s success selling into China (and their plans to continue to develop products that sell well there).
I think it is a good take on the Made By China strategy China is likely to employ to get out of their current economic doldrums. The CEO seems more optimistic about a level playing field than I am, but maybe that is natural as he is a public figure speaking on live TV. Virtually all of Academy’s Geopolitical Intelligence Group continues to see friction with China. While we might like to isolate that friction to high end chips, AI and military technology, it seems difficult to ringfence those areas, while having “normal” relationships in other areas of trade.
In any case, expect a lot more headlines about Chinese companies selling into foreign markets and what access companies outside of China get, in terms of selling their products into China.
AllStarCharts - Most Important Trend on Earth? (think COMMODS and OIL against all things — but bonds … oh well, maybe next time?)
Is this the world’s most important trend that no one is talking about?
How many people do you know would tell you that stocks are already in their 4th year of a downtrend relative to commodities?
In other words, how many people do you know that would argue we are now in year 4 of a Commodities Supercycle?
Here’s what this looks like:
This was a major topic on last night’s LIVE Conference Call for Premium Members of All Star Charts.
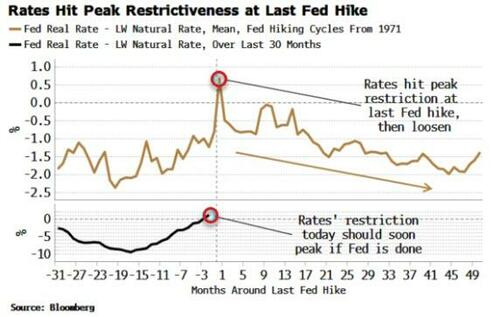
’s last rate hike is likely already behind us, meaning rates will become less restrictive and excess liquidity will continue to rise.Stocks are primed for one last push higher before recession risk intervenes, triggering a correction.
After the most rapid tightening cycle in history, the Fed is most likely done, for now at least. The end of Fed rate-hiking cycles has historically marked peak tightness in financial conditions, generating a tailwind for stocks and other risk assets.
But that’s only if a hard landing is averted - which looks unlikely.
Thus any support for stocks from relatively looser conditions is fated to be short lived.
Wednesday’s Fed meeting will be the eleventh since the bank started raising rates in this cycle. June’s meeting was a pause, while July’s hike is likely to prove to be the last - at least until inflation becomes a problem again.
That means rates have likely hit their peak level of restrictiveness.
Using the Laubach-Williams estimate of r-star - the natural rate of interest - and comparing this to the real fed funds rate, we can see policy’s degree of restriction peaks at the Fed’s last hike.
The average move in real rates after the Fed is done is significant enough that - whether r-star has risen or fallen post the pandemic - rates are destined to become less restrictive. Even if the policy rate is held steady for some time, the totality of its impact will ease as incrementally more cuts are priced into the curve. (Forward guidance works when there is a hard floor close to where rates are desired to be, which is not the case when we are well above the zero bound).
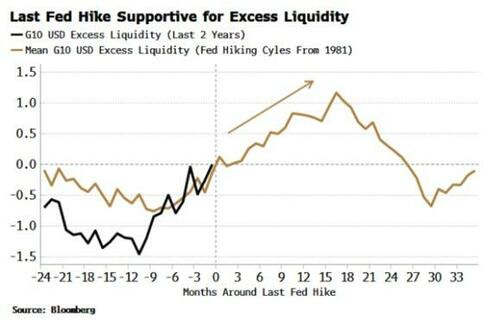
On top of this, risk assets should continue to be supported by excess liquidity, the difference between real money growth and economic growth. As the black line in the chart below shows, excess liquidity has been rising, driving the risk-asset rally we have seen over the last six months or so. There’s more to come, if history is a guide, as the brown line shows that excess liquidity typically keeps rising after the Fed’s last hike, not peaking until about a year-and-a-half later.
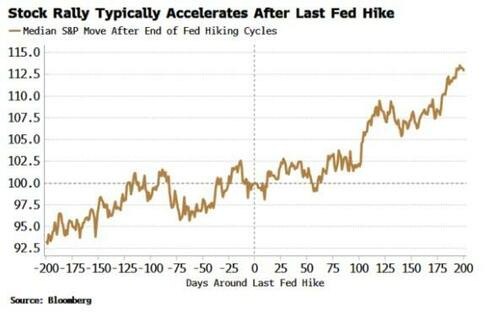
So far so good for risk assets. And we have prologue to support us.
The S&P’s gradual rise toward the end of hiking cycles becomes a more rapid increase when it’s clear rates have peaked.
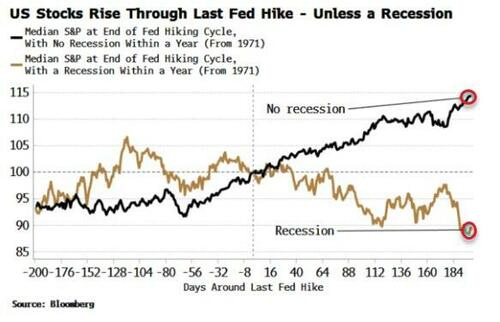
But a recession is the trunk-endowed beast in the room.
If we split up the hiking cycles that had a recession within a year of their end and those that did not, there is a clear divergence in the picture.
Recessions, and the lead up into them, overwhelm any positive effects from looser financial conditions, and coincide with a weakening in the stock market.
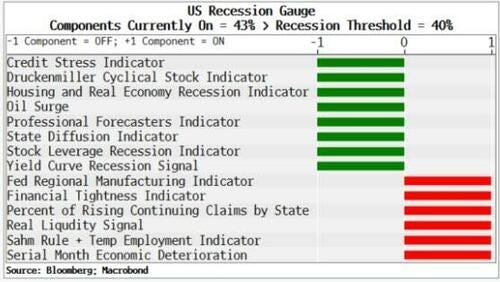
A soft or no landing has become the consensus, but recession risk remains very real. My Recession Gauge looks at a whole cross-section of economic and market-based indicators. When over 40% of them have triggered it has always preceded a near-term recession. The gauge, even though it is off its recent highs, remains above the recession threshold, intimating a downturn is close.
There is no space for complacency when it comes to recessions. They are regime shifts that happen slowly, then suddenly. Interactions between hard and soft data start to negatively reinforce one another, and past a certain point there is a cascading effect, resulting in a rapid deterioration in economic conditions. Economic data is typically revised much lower after the fact to belatedly reflect the sudden weakening.
Stocks and other risk assets, though, start to sell off well before the recession’s official NBER-defined start date, and long before the recession-dating body announces this. That’s why tracking leading indicators, such as the Recession Gauge, will be crucial in knowing when to de-risk.
From the Fed’s perspective, the risks from further hikes are becoming more balanced. Inflation has fallen to an average of a little over 3%, and by the time of the next-but-one meeting in November (assuming they hold at this week’s meeting), leading indicators show that jobs and growth data will have weakened further.
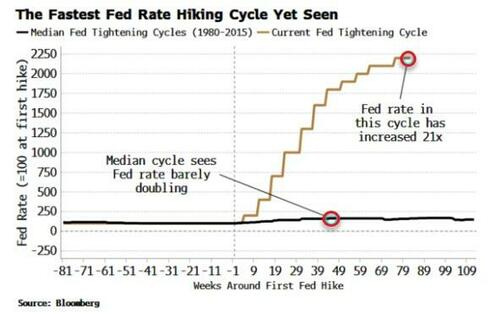
Also, the rapidity of rate hikes increases the chance their cumulative impact has yet to be fully felt. The Fed has raised rates by 525 bps in a little over a year, taking them to 5.5%, only 100 bps below the median peak of 6.5% they reach at the end of previous hiking cycles.
It’s even more dramatic when you consider rates were virtually at 0% when the Fed started raising them. In geometric terms, rates have risen faster than they ever have before. The Fed has enough justification to take its foot off the brake altogether.
We won’t know when the last Fed hike is ex ante. But there are enough reasons to lean heavily in the direction that it’s been and gone.
If so, past behavior is consistent with stocks continuing to rally as conditions loosen, until the gravity of recession takes them lower. Après la Fed, le déluge – just not immediately.
… 3/ A Confused Dr. Copper When addressing the country on monetary policy, Jerome Powell continually reiterates his inability to accurately forecast when inflation will return to normal levels thus allowing the Fed to ease restrictive monetary policy. The world's leading economic forecaster, Dr. Copper, agrees with Powell's cautious and uncertain stance. Copper has been range-bound for over a year as the financial world attempts to forecast whether the Fed's battle with inflation will ultimately result in a hard, soft, or no-landing for the economy.
A decisive break higher or lower in copper from its multi-month range will indicate whether the economy can withstand the Fed's aggressive monetary tightening.
4/ Dow Jones Testing 2023 Support As we work our way through September, the year's weakest seasonal period, the Dow Jones Industrial Average is testing critical 2023 support. As can be seen in Chart 4, after breaking above clear multi-month resistance, the Dow is now pulling back and finding support at that same resistance. This support coincides with a trendline beginning from the depths of this year's short-lived March banking crisis.
The ability of the Dow to hold above its key support and trendline will help confirm any downside break in the previously mentioned copper chart.
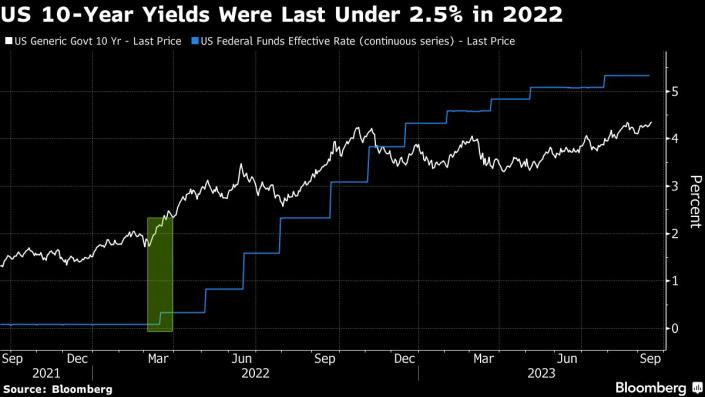
Yahoo: AllianceBernstein Joins Bond Bulls Camp With 2.5% Call on Yields (10s to follow ‘official’ policy rate … seems fair)
(Bloomberg) -- The time is ripe to buy Treasuries after a four-month selloff, as the US central bank is close to signaling its hiking cycle is over and will ease next year, driving the benchmark yield as low as 2.5%, said AllianceBernstein LP.
The money manager is not alone in calling for a turning point for US bonds but its prediction is more aggressive than that of its peers such as Jupiter Asset Management. The Federal Reserve is likely to deliver at least four rate cuts, said AB’s Matthew Sheridan, who co-manages the American Income Portfolio fund which has gained almost 2% this year to beat 75% of its peers…
AND … THAT is all for now. Off to catch some sleep THEN traveling so NO UPDATE tomorrow morning (reach out if you require a refund) and back at it Thurs … Good luck and happy FOMC day — hope markets treat one and all fairly.
Thanks for reading The BondBeat! Subscribe for free to receive new posts and support my work.


Have a nice and safe travel