Here you can see BONDS clinging to ‘support’ last seen back in October and momentum (stochastics, bottom panel) remains overSOLD and ripe for a correction. What could possibly ignite such a correction? I’ve no idea BUT some times it is said that price action itself fosters other price action and … on that, with bonds ‘on sale’, I was reminded of something just yesterday …
A friend of mine forwarded along a story from The Terminal and it caught my eyes …
Bloomberg (via WWW HERE): Sub-50 cent price on Treasury bond underscores investor pain
Long-term bonds sold during pandemic hit hard as rates soar
Positive convexity means debt could be valuable if yields fall
(Sept 19): Fifty cents on the dollar is a very low price in the world of bonds. In most cases, it signals that investors believe the seller of the debt is in such financial distress that it could default.
So when a US Treasury bond sank below that price Monday, it raised eyebrows. The security, due in May 2050, briefly touched as low as 49 29/32, marking the second time in the past two months it’s fallen below the 50-cent level.
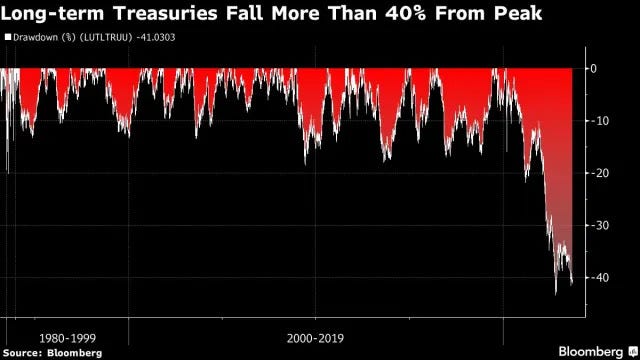
The US, of course, is not in danger of defaulting any time soon. What the price does illustrate in this case is the scope of pain inflicted on investors who piled into longer-term debt at rock-bottom interest rates during the pandemic, only to then be caught off-guard when the Federal Reserve (Fed) carried out the the most aggressive monetary-policy tightening in decades.
The bond due in 2050 has been hit particularly hard, given that its interest rate — 1.25% — is the lowest ever on a 30-year Treasury. Investors got over 4% on 30-year debt issued last month.
“Those bonds have below market coupons and investors need to get compensated for it,” said Nancy Davis, the founder of Quadratic Capital Management.
Treasuries maturing in 10 or more years — which have the highest price sensitivity to changes in interest rates, or duration — have slumped 4% this year, following a record 29% plunge in 2022, according to data compiled by Bloomberg. That’s more than double losses across the broader Treasury market, the data show.
Yields on 30-year bonds hit an all-time low of 0.7% in March 2020, before rising to a 12-year high of 4.47% last month. They hovered 4.4% Monday.
The Treasury initially sold US$22 billion (RM103.22 billion) of the 2050 securities at about 98 cents (it subsequently did two so-called reopenings, adding to the amount outstanding). Since the bond’s debut, it’s rapidly lost value as newer ones were sold with higher coupons.
The Fed is the largest investor in the debt, holding about 19%, a legacy of its bond purchasing programme known as quantitative easing. Other buy-and-hold investors such as exchange-traded funds, pensions and insurance companies also dominate.
Of course, should a decline in inflation fuel a slide in long-term yields, these bonds would just as quickly turn into an outsize winner versus the rest of the rates curve.
They also have at least one other attractive property for investors. Because of the deep price discount, the securities have what’s known as positive convexity, meaning they rise in price more than they fall for a given change in yield.
For instance, the bonds would surge about 11 cents should their yield decline 100 basis points. For a similar yield increase, the bonds would only fall about nine cents.
“They have very positive convexity, and that make them very interesting bonds, although liquidity is probably very low,” said Mustafa Chowdhury, the chief rates strategist of Macro Hive Ltd.
Perhaps this ‘sale’ on longer end of the yield curve will spark a bid for this afternoon’s 20yr ? In the meanwhile … here is a snapshot OF USTs as of 7a:
… HEREis what this shop says be behind the price action overnight…
… WHILE YOU SLEPT Treasuries are little changed with the curve modestly steeper this morning with UK Gilts outperforming again. The final prints of Eurozone August CPI were a little light (MoM and YoY each came 0.1% below estimates- BBG), DXY is lower (-0.15%) while front WTI futures are higher (+1.3%). Asian stocks were mixed/lower, EU and UK share markets are modestly higher (SX5E +0.35%) while ES futures are showing +0.15% here at 6:30am. Our overnight US rates flows saw limited activity during Asian hours with Japan back from a long weekend. Our desk saw net better buying overall amid thin conditions. We were too early for London color and overnight Treasury volume was still about average overall with elevated turnover evident in 2yrs (133%), 5yrs (147%) and 20yrs (193%).
… Treasury auctions $13bn 20-year bonds this afternoon and the 10s20s30s Treasury 'fly is within about 1.5bp of the lower-end of its recent closing range (20yrs rich), as you can see. Maybe current levels are fair value for the 'fly given the relatively heavier weight of up-sized Treasury supply on the wings; we'll get a sense of that at 1:02pm.
… and for some MORE of the news you can use » The Morning Hark - 19 Sept 2023 and IGMs Press Picks (who CONTINUES to be sportin’ that new, fresh look) in effort to to help weed thru the noise (some of which can be found over here at Finviz).
From some of the news to some of THE VIEWS you might be able to use… here’s SOME of what Global Wall St is sayin’ …
Labour markets are cooling in both the US and the UK, but we expect still-elevated wage growth in the UK to trigger one last BoE hike, while in the US, we think rate hikes have come to an end.
FOMC Preview: Cooling labour market paves way for end to rate hikes We expect the Fed to keep rates on hold this coming Wednesday, and financial markets are pricing a near-zero probability of a hike. While the US economy continues to grow robustly, and inflation remains well above the Fed’s 2% target, the labour market has seen a clear and significant softening in recent months, which is dampening wage growth and therefore reducing upside risks to the medium term inflation outlook. Payrolls growth has slowed significantly: the 3 month average monthly jobs gain has fallen from around 330k at the beginning of 2023, to less than half that pace at 150k as of the last August reading. Over the same time period, job vacancies have fallen by nearly 2 million, and the ratio of job vacancies to unemployed people has fallen to 1.5 – still on the high side, but now not far above the pre-pandemic level of 1.2. This broad easing in labour market tightness has helped dampen wage growth, with various wage growth measures now cooling rapidly (see below, and also here). Given that wage growth is the main driver of the medium term inflation outlook, this cooling in the labour market is likely to give the Committee the confidence to keep rates on hold at this meeting, even as headline inflation rebounds.
The September FOMC meeting also brings the quarterly update to the Committee’s projections. This is likely to show upgrades to GDP growth and headline PCE inflation (due to higher oil prices), but core PCE inflation projections are likely to be broadly unchanged. We also expect minimal changes to the Committee’s outlook for interest rates, or the ‘dot plot’; in June, the median Committee member expected one further hike (after July) this year, and 100bp of cuts next year. It is possible that rate cut expectations are reduced somewhat, but we do not expect any changes here to be market-moving. This leaves the focus for markets on Chair Powell’s press conference performance. We expect Powell to express optimism over the continued cooling in the labour market and the accompanying disinflation, which has come alongside continued strength in economic growth. At the same time, we expect Powell to reiterate that the Committee remains open to further rate rises should that prove necessary. He may also point to the recent rise in oil prices as a risk to the inflation outlook, should this push inflation expectations higher (not our base case). We continue to think the Fed is done raising interest rates, and that a further softening in the labour market combined with declining core inflation will trigger rate cuts starting from March next year…
Equity LO funds join HFs in adopting a cautious stance. Meanwhile, systematic allocation to equities remains high, commodity long exposure is on the rise and option investors were unfazed by the recent selloff. Tech remains favored among equity investors; MM and bonds preferred overall
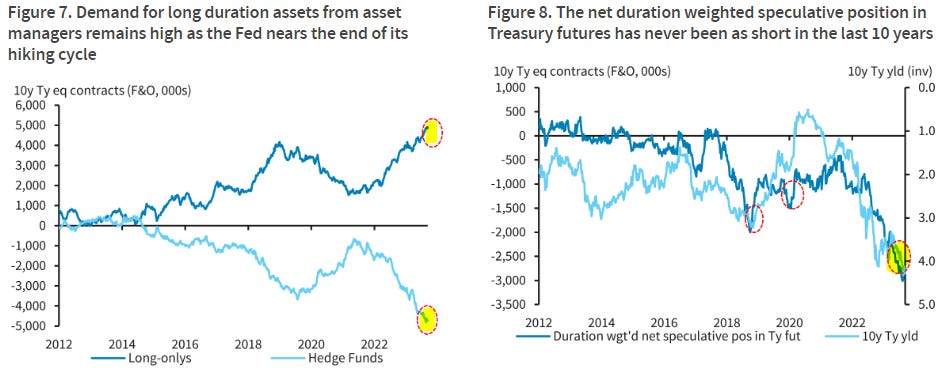
… Treasury tsunami to continue into next year Despite strength in spot US macro data, uncertainty is on the rise as ex-US growth weakens and the rates backdrop is set to go higher for longer after a hiccup in the disinflation trajectory, making it no surprise that asset manager demand for long duration assets remains fairly robust. A vastly increased supply of Treasuries stemming from Fed QT and deficit financing has also continued to favor a highly levered basis trade by macro hedge funds, extending the buildup in short speculative bond futures.
The Fed's Summary of Economic Projections (SEP) is likely to undergo meaningful revisions at the upcoming September FOMC meeting, including upgrades to growth and the labor market and a downward revision to inflation, at least in 2023. This note provides an empirical assessment of how these near-term revisions are likely to impact officials' expectations for the economy and appropriate monetary policy in 2024.
Within these revisions we view the 2024 inflation forecasts as a particularly illuminating variable. If these forecasts are revised lower, officials are taking a step towards accepting an immaculate disinflation that can occur along with a stronger growth and lower unemployment rate profile. In contrast, if downgrades to 2023 inflation are offset by a stronger macro backdrop that keeps next year’s inflation forecasts unchanged, the SEP would reinforce the message that officials believe there’s a long ways on taming inflation and that ultimately doing so will likely still require some “pain” in the economy.
As we detailed in our FOMC preview note (see "Maybe more hikes, more likely less cuts"), we expect that these economic revisions will result in an SEP that maintains hawkish-leaning signals. In particular, we expect that the median dot will continue to show a rate hike this year and that there could be some upward migration in the 2024 dot that will reinforce the commitment to higher for longer.
The word “recession” has been one of the most widely used in markets over the last 12 months. As we go to print in September 2023, a big debate among investors is whether there’ll be a hard or soft landing for the US economy. In the meantime, Europe has been flirting on and off with a recession since the war in Ukraine began last year and GDP has broadly stagnated since autumn 2022.
Since this is our annual long-term piece, the question of whether the US and Europe fall into a near-term recession isn’t our primary focus, although we’ll provide clues to the likely outcome from history. Instead, our priority is understanding what history tells us about the frequency, depth and duration of recessions, along with what causes them using cycle data stretching back to 1700. We also take a look at their impact on asset prices, and the likely shape of them going forward.
This is the final part of a planned trilogy that we deviated from due to the pandemic. In 2018 we published “The History (and Future) of Inflation" as our annual Long-Term Study, where we concluded that history suggested inflation would soon make a comeback given the macro set-up. In 2019 we followed it up with “The History and Future of Debt” where we concluded that we were set for a world of "higher debt, higher inflation, higher nominal GDP, higher yields, and higher central bank balance sheets”. The overarching narrative behind the trilogy was (and still is) that the financial world went through a unique golden era between 1980-2020 and that the trends that enabled this super-cycle would reverse going forward. The pandemic accelerated this process but they would likely have arisen in the 2020s regardless, for reasons that include a much-needed reflation, a demographic inflection point, and deglobalisation.
The most likely outcome of this is that the era of ultra-long business cycles is over. This isn’t necessarily negative for long-term economic performance, since the highest periods of growth through history have often seen more frequent recessions. But if we're correct, it will clearly put more macro volatility into a system that was used to lengthy periods of low volatility prior to the pandemic.
The second half of our annual study includes our updated multi-asset class returns across numerous DM and EM countries going back over 200 years where possible. We review the decade so far, which for bonds and 60/40 portfolios is up there with the worst on record. Commodities are out-performing, whilst equities are mixed depending on the country. The US, Japan and India are out-performing history and leading the way. Some others are still down this decade in real terms.
In this piece we analyse 60 UK recessions back to 1700, 34 US recessions since 1854, 11 German, 13 French and 12 Canadian recessions from the 1920s and 7 Italian recessions since 1980. For Japan, the structurally high growth post WWII means we only have 6 “proper” negative growth recessions from 1990. We look at their frequency, depth and duration and their typical drivers as well as their impact on asset prices.
Recessions have got much rarer through time, especially since 1982. Since then the US, Germany and France have only seen 4, whilst the UK and Canada have only seen only 3. Italy and Japan with their own growth issues have seen 6.
The 4 US recessions of the last 40 years contrast with the 9 recessions in the prior 40 years and 10 over the previous 40 years. Since 1982, the average US expansion has lasted 8.6 years and only 8% of that time has been spent in recession. Before 1982, the average was 2.8 years and 35% respectively.
The longest economic expansion in the G7 we can find in our study is the 30-year French expansion ('Les Trente Glorieuses') that ended in 1974 with the oil shock. Australia might have beaten this record had Covid not occurred after a 29-year expansion from 1991 that ended in 2020. Although early data is patchy it's feasible that China didn't have a negative quarter between 1976 and 2020. So that could be the global record.
Prior to WWII, long expansions were a rarity across the world. Historically this was due to agriculturally-based economies that were more susceptible to natural weather variations, which made output more volatile. But even as economies industrialised, economic policy wasn't particularly pro-cyclical at first. For instance, money was tied to gold for large periods and economic orthodoxy was in favour of balanced budgets…
… Although we go back beyond the last century, and have many more countries in our returns section, the returns for the G7 over the last 100 years are (per annum - ordered best to worst in real terms). Equities: US 10.5% nominal (7.3% real), Canada 9.3% (6.3%), UK 10.2% (5.9%), Germany 7.3% (5.0%), Japan 11.3% (4.3%), France 11.0% (3.8%), and Italy 10.8% (2.3%). Bonds: Canada 5.7% (2.7%), Germany 4.1% (1.9%), US 4.8% (1.8%), UK 5.5% (1.3%), France 6.2% (-0.7%), Japan 5.9% (-0.8%), Italy 6.8% (-1.4%). So in the last 3 bond returns have not kept up with inflation in the last century…
… US Treasuries saw 6 out of 8 negative real return decades between 1900- 1980, then 4 very strong decades…
… For bonds the analysis is a bit more complicated. Structural trends have sometimes swamped the cyclical. Figure 44 shows 10yr US government yields and various proxies before that was available, with the red dot showing the local yield lows within 12 months of a recession starting and ending. The data only really gets interesting after WWII, where the next 35 years saw a structural bear market in bonds. That bear market was generally punctuated with yield rallies in recessions, although it wasn’t uncommon for the lows to happen before the recession due to the structural bear market. Around 1980 onwards, the reverse occurred and we had a structural bull market, so yield lows sometimes happened after the recession.
The University of Colorado Buffaloes are undefeated and suck up a lot of oxygen in the college football world. After just three games as the new head coach, Deion Sanders was interviewed by 60 Minutes. For now, the Buffs have gone from irrelevant to essential in the college football world. In the competitive arena of sports or business you need to stand out to be noticed. But, when you’re the government, standing out isn’t hard to do…
… We don’t think the Fed will provide many surprises. As of the Friday close, the futures market was putting the odds of a rate hike at this week’s meeting at less than 1%. That may be too low, but the Fed won’t surprise on this front. It will release a new batch of economic forecasts as well as “dot plots” that show where policymakers see short-term interest rates heading.
This could be the surprise: The futures market’s odds of a rate hike by the December meeting are roughly 45% and we think that’s too low. Oil prices are lifting inflation once again, and rising health insurance rates will keep inflation elevated later this year. Meanwhile, real GDP growth looks solid in Q3. Mixing stubbornly high inflation with solid economic growth is not a recipe for a prolonged pause by the Fed, at least not yet.
We think the Powell presser and the dot plots will make it clear the Fed is leaning toward one more rate hike before the year is through. Our greatest hope is that someone asks Powell about the money supply and he acknowledges its importance for conducting monetary policy, but if that happens we’d be (happily) surprised…
… As we said two weeks ago, the federal government is running the most reckless and irresponsible budget in US history. Even John Maynard Keynes’ would not support such massive deficits with the unemployment rate so low. This can’t go on now that interest rates have returned to more normal levels. If a shutdown is the price we pay to start moving in the direction of less government spending, investors should be eager to see that happen. The shutdowns in the mid-1990s caused the government to become more fiscally responsible and led to Clinton era surpluses. And that was good for everyone.
Government shutdowns can trigger short-term market volatility, but they tend to resolve quickly and have little to no market impact for long-term investors.
The BEA will likely make a meaningful downward revision to GDP in its annual revision on September 28. The gap between GDP and GDI is at a 20-year high and our analysis of the last 20 annual revisions indicates that GDP will correct lower – another reason for the Fed to end this hiking cycle.
… Our models suggest GDP is likely to be revised downward by -50bp to -80bp.We analyzed the last 20 annual revisions and found:
GDP and GDI tend to converge in most revisions, especially when the GDP-GDI gap is large.
Our simple models imply that a GDP downward revision between -50bp and -80bp to 2Q23%Y is possible.
GDI might revise upwards, between +40bp and +60bp.
Ned Davis Research - A Strong Finish for Equities? A compelling historical study and whether it applies to 2023 (aks / attempts to answer the right questions and concludes … guess. don’t worry, be happy — and BUY STONKS and it’s 100% fool proof… see below … AFTER placing all yer BUY BUY BUY orders …?)
Key Takeaways
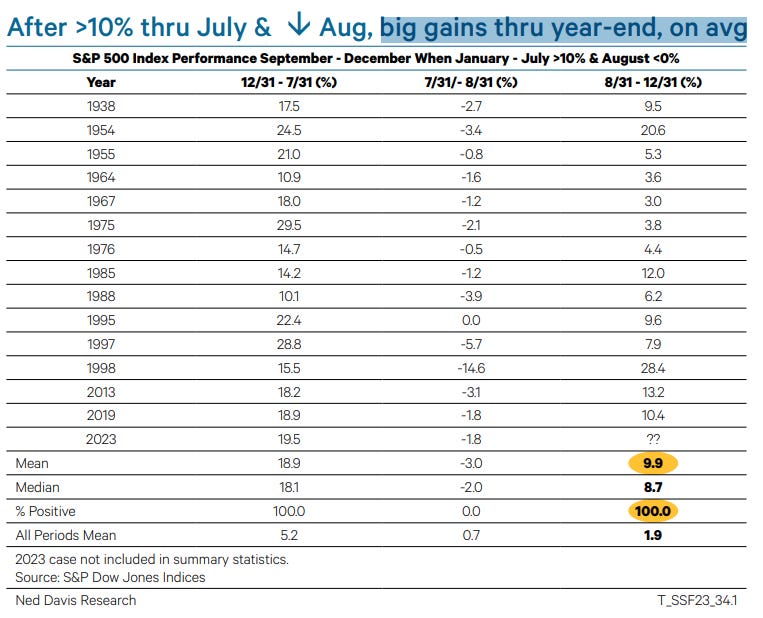
• After strong YTD returns through July and August pullback, the S&P 500 has tended to post big additional gains through year-end. • Short-term weakness has been common before the year-end rally. • Watch long-term breadth and sentiment composites for signs that the market is poised to resume its uptrend.
… The table above shows all cases since 1926 when the S&P 500 Index rose at least 10% year-to-date through July and declined in August. From August 31 through year-end, the S&P 500 has risen 14 out of 14 times by an average of 9.9% versus an average of 1.9% for all September – December periods.
…Let’s preview this week’s FOMC readout. There will be no hike from the Fed, but I believe you will get headlines of a hawkish readout on the Dot Plot. I can see more FOMC members thinking we need another one or two increases this year and a level of rates which is higher than what is currently priced into the Fed Funds Futures market. Powell likes to reflect all the discussion in the Dots in his commentary, so I can see some hawkish words from Powell. But Powell will maintain the Fed is totally data dependent. Unfortunately, the inflation data is likely to stay strong and official core inflation figures remain stubbornly high—particularly the ex-rent figures.
My view remains the Fed should not risk an unemployment rise and millions of unemployed workers with the path to lower inflation well established and on track. But we’ll hear the tough talk from Powell.
The union strike from the United Auto Workers may last longer than people currently think. The car companies put 20-21% pay hikes on the table, but the union leader is demanding much higher at 40% but may be just posturing to get something above 30%, although I hear the settlement will be in the upper 20s. Can they both settle a little above or below 30%? We have talked in these commentaries about how workers were falling behind inflation and that wage growth lags inflation but ultimately it catches up through this type of contract re-negotiation process. The workers are trying to get this catch up with this new agreement. Hopefully a resolution is had that keeps companies competitive.
We also have a government shutdown pending for October. The Republicans seem to like playing this shutdown game—which I think is a losing gambit. Eventually the GOP caves in and re-opens the government, but the market is looking past the disruption and silly gamesmanship coming out of Washington and thinks the slowdown from the union strike and this government shutdown will be just a moderate hit to the economy.
The market still has positive momentum and can tilt upward towards the end of the year. I don’t see a strong boom but an upward tilt…
From Global Wall Street and their ‘narrative marketplace’ TO others readily avail on the intertubes,
Historically, stocks do very well after mid-term elections. And that's exactly what happened.
Then in Q3 the struggle tends begin for a few months.
And that's precisely what we've seen this year. A perfectly normal market:
And even if you completely ignore seasonal trends, by just looking at some of the most important groups of stocks, you can see why it's been struggle city lately:
All of these groups of stocks are stuck below their late 2021 highs.
Technology, Industrials, Homebuilders and Semiconductors stopped going up at the exact same levels where they stopped going up last time they were up here.
The new 52-week high list peaked over 2 months ago, back in July.
Until these groups of stocks are able to break out above those former highs, the S&P500 is going to continue to have a hard time making any progress.
Seasonally, stocks should rip into the end of the year starting in October or maybe early November.
But without breakouts in these charts above, I'm not sure it will be that simple.
Treasury markets aren’t really prepared for what economists predict that the Fed is likely to do as the US economy remains resilient. A recent survey of central bank watchers indicates that US policymakers — who are set to release their new array of forecasts, or dot plot, this week — will probably pencil in one more interest-rate hike for this year followed by a plateau that’s longer than previously expected.
The chart below suggests two-year Treasury yields are too low for this point in the central bank’s cycle. The Fed concluded its last three rounds of tightening in December 2018, June 2006 and May 2000. All three times, two-year yields were near or above the federal funds target rate. (Or the top of the band after the Fed adopted a range.) Now, two-year yields are almost 50 basis points below the top end of the range for fed funds. They have a long way to rise just to fit with the usual pattern if the Fed is done -- and even more if the Fed hikes one last time.
It’s emblematic of the battle the Fed has had throughout the tightening cycle trying to convince investors that rates are headed higher. Now it looks like there’s a good possibility the Fed will tighten one last time, serving another unpleasant dose of reality –- and another round of losses -- to bondholders.
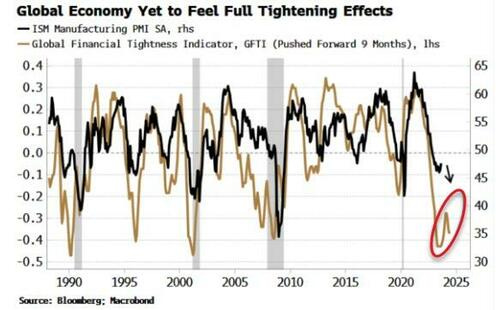
The lagged effect from central-bank rate rises has yet to fully feed through to markets and the economy, posing a headwind for risk assets in the medium term.
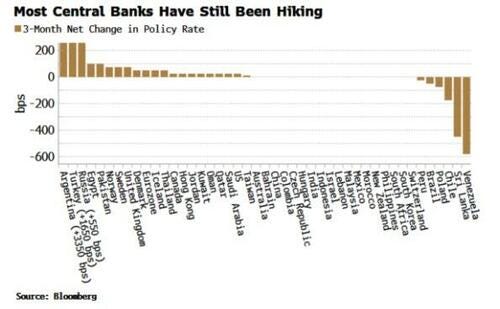
With at least six developed market central banks due to announce rate-setting decisions this week including the Fed, the BOE and the BOJ, it’s a good time to look at where we are the in the global rate-hiking cycle.
While the Fed is quite possibly done raising rates for now, and the ECB and the BOE are probably within one hike of being so, most central banks are still in the hiking zone. The major exceptions are
Poland
, Chile and Brazil (the latter’s central bank is expected to cut the Selic rate again this week), where inflation has quietened enough that policymakers can refocus on supporting growth.
Tighter monetary policy of course takes time to filter through to the market and to the economy. My Global Financial Tightness Indicator (GFTI) is a diffusion of global central bank rate hikes. It had started to turn up – indicating financial conditions should soon loosen – but then has turned back down again, showing that the full tightening impulse has yet to be felt.
As the chart below of the GFTI shows, its turns lead the turns in
the US
manufacturing ISM by around nine months, andindicates the ISM should go back down again later in the year, or early next year.
The ISM and US and global manufacturing are very important influences on global stock markets.
US manufacturing is a small proportion of GDP, but it is a disproportionately large part of corporate profits and intermediate inputs, and therefore has a significant influence on global stock markets. Its sensitivity to the economic cycle means it typically leads equities.
Global stocks and other risk assets are therefore likely to run into resistance in the medium term, as rate rises filter through directly to stock markets, and indirectly through their impact on the real economy.
However, as always with markets, nothing moves in a straight line, and time lines are important. In the shorter term (< 3 months), the excess-liquidity picture remains constructive for stocks. Excess liquidity is the difference between real money growth and economic growth in dollar terms. The combination of lower inflation and a weaker dollar (compared to a year ago) is keeping excess liquidity, and thus risk assets, supported.
Bloomberg (yest noted BONDS saying ‘Earl BID not a problem)
… Crude oil climbed for a third week as output cuts from the world’s two biggest producers — Saudi Arabia and Russia — played their desired role. WTI rose above $90 a barrel. Forecasts for a supply deficit going into year-end are underpinning calls for $100 crude in the not-too-distant future amid signs that China’s economy is stabilizing and the US’s extended resilience despite the Federal Reserve’s epic rate hikes.
The bond market, meantime, remains massively skeptical that this rally means much at all. Breakeven rates — the gap between yields on regular Treasuries and those on bonds protected against inflation — have increased at a far more modest pace. That is probably due at least partly to the Fed’s success in bringing core inflation down to a 4.3% annual pace from the 6.63% peak seen a year ago. There’s also perhaps an appreciation that Saudi Arabia and Russia can readily unwind their current, ad hoc output cuts. Finally, there remains an undercurrent of concern about that resilient economy. This year’s equities surge has been concentrated in AI-exposed sectors, while small caps are limping along to signal that a downturn remains possible.
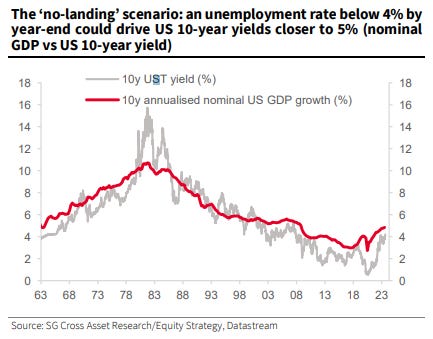
Bloomberg (Authers OpED YEST — talked of equity targets changing BUT a visual of 10yy and GDP caught MY EYES and so I’ll share cuz, sharing IS caring, right? here’s a visual from SocGEN via Authers, “ Wall Street's targets are a-changin'“)
… Economic forecasts are unusually weak at present, and that implies that markets have plenty of room to grow. Past examples of when bearish economic forecasts helped the stock market include the Global Financial Crisis low of March 2009, and the pandemic low 11 years later, both of which proved to be great times to buy. However, the current situation is unlike those two bear-market bottoms in that stocks’ recent performance hasn’t been that bad.
In the longer term, Kabra makes clear that if the no-landing scenario actually comes true, it will create more problems because of the higher bond yields that would probably come in its wake. That would be enough to knock expensive equities off their perch. As this chart from SocGen shows, the historical experience is that further positive surprises for GDP will likely bring yields higher:
For now, however, it looks as though the US stock market remains in some kind of sweet spot. Thanks to the AI craze, earnings forecasts that are moving upward (albeit slowly), and the continuing capacity for economic surprises, it can continue to rally. Or at least, it can for another 100 days or so to get to the end of the year.
InvestOpedia / ChartAdvisor (Monday morning … offering some HY insights AND a Russ2k chart of interest…)
… High-Yield Debt Insights
We often think of the stock market as simply a basket of stocks. However, there are many clearly defined groups within it. Well-capitalized and mature companies with investment-grade debt represent very different investment opportunities from recent high-growth IPOs with negative cashflows. Many stocks that grab headlines with sizeable moves operate as more speculative investment vehicles.
My preferred gauge for understanding when this speculative group will have a monetary tailwind is the ICE BofA US High Yield Index (orange line in chart 3). This index is particularly helpful because it relays two vital pieces of information - credit, and risk.
High-yield debt carries much more risk than investment-grade or government debt. The index is affected both by interest rates and corporate risk trends. Therefore, a falling High Yield Index provides multiple bullish implications for speculative stocks - lower financing costs, higher multiples, and lower risk.
A reasonable explanation for the narrow leadership in this year's market-cap weighted indexes is that the High-Yield part of the debt spectrum has remained stubbornly high. A break lower in this index will help to convey two critical points: 1) Interest rates have peaked while 2) corporate risk remains subdued.
A decisive break lower will likely coincide with the next major bull market, where speculative stocks once again lead in performance.
Ahead of tomorrows FED MEETING AND DOTS a plot of a different sort to consider … Greenspan and his IRRATIONAL EXUBERANCE SPEECH (circa 1996) if it were a visual,
FINTWIT SOURCE … He’s watching and so are we all … AND THAT is all for now. Off to the day job…
Greenspan always 'talked' a good game, but never stopped the party, never withdrew the Punchbowl, as a wiser Central Banker once said. I do remember the briefcase indicator!
Is the economy really 'growing', when homelessness, bankruptcies, and budget deficits are all going Buzz Lightyear? And 46% of us can't afford a $400.00 emergency? Asking for a friend!