while WE slept: USTs under modest pressure ahead of 20y auction; daily declines (S&P) and a streak; the NEXT 10yrs of returns; magazine covers and this MOVEs for you!
Good morning … STILL no news from HIMCO and so I’ll be brief. Ahead of this afternoons upcoming liquidity event (aka $13b 20yr Treasury Auction) a quick look at 20s with FOMC rate CUT notated (9/18)
20yy DAILY: yields UP nearly 70bps since rate CUT, above 200dMA and TLINE …
… AND momentum has moved from overBOUGHT to overSOLD — buying of the rumor and selling of the fact — which then sets up nicely for this afternoons auction … perhaps a decent ‘rental’?
… AND for somewhat MORE from someone with a Terminal license …
CHARTbeat: Fixed Income: Treasuries Weekly rotation of debt-based charts Oct 21, 2024
… And while much has been made of the NO landing scenario (h/t Apollo’s Slok), what then of the IMFs latest …
ZH: "The Risks Are Building To The Downside": IMF Cuts Global Growth Forecast After Warning Global Debt To Hit $100 Trillion
… here is a snapshot OF USTs as of 658a:
… and for some MORE of the news you might be able to use…
NEWSQUAWK: US Market Open: European bourses trading negative, US futures follow suit with earnings ahead … USTs are modestly lower ahead of 20yr supply; Bunds were unreactive to a well-received 10yr auction … USTs are trading somewhere between Bunds and Gilts in terms of magnitudes, with USTs finding themselves under modest pressure ahead of 20yr supply though as it stands action is relatively even across the curve. At a 111-03+ trough which marks a marginal new WTD base.
Opening Bell Daily: Magic 8 Bond - Bond traders forecast no US recession — plus a Trump victory … Treasury yields have surged as Wall Street pulls back its bets for aggressive Fed rate cuts.
Finviz (for everything else I might have overlooked …)
Moving from some of the news to some of THE VIEWS you might be able to use… here’s SOME of what Global Wall St is sayin’ …
… from the French, with love (and affinity for steepeners) …
BNP: US rates: Searching for curve-steepeners with improved carry
We screened more than 500 forward swap pairs against six benchmark spot swap curve pairs over three time horizons in search of curve steepening expressions with less punitive negative roll down and carry.
Our top 10 best fits with improved carry may be considered as substitutes for 2s5s, 2s10s, 2s30s, 5s10s, 5s30s, and 10s30s spot curve steepeners.
Trade idea: Enter 1y10y (receive), 5y5y (pay) forward swap steepener at 9.75bp. Target: 55bp. Stop: -5bp. Carry and roll down: -0.3bp/mo. Allocation: USD20,000/bp.
… 5s30s swap curve: Negative roll down and carry for 5s30s swaps is roughly 5bp over three months. Similar to 5s10s, this carry is low compared to other curve segments that involve 2y swaps. However, 4y30y–1y5y eliminates all of the negative carry with an average rsquared of 0.93 …
… AND from Germany, a look at yesterday AND beyond 11/5th as well …
It's been a soggy first half of the week for equities and a mini rout for bonds, with the S&P 500 (-0.05%) yesterday posting a second daily decline for the first time in six weeks (31 sessions). This ends the 5th longest run without back-to-back declines since 1928 and remarkably the longest since 1955. I hope you're impressed with that niche stat!
… Matters weren’t helped by geopolitical developments yesterday, with Brent crude oil moving up +1.86% over the session to $75.67/bbl. That comes as investors have continued to focus on how Israel might retaliate against Iran’s strikes earlier this month, and the moves have themselves led to growing concern about inflation. For instance, the US 2yr inflation swap moved back up +3.9bps to 2.46%, meaning that investors also dialled back the chance of aggressive rate cuts from the Fed. Indeed, the rate priced in by the December 2025 meeting was up another +1.0bps yesterday to 3.40%, the highest it’s been in over two months, and up from a low of 2.78% just over a month ago. Treasuries were fairly flat after Monday's severe sell-off, with 10yr yields up +1.0bps, while yields on 10yr bunds (+3.6bps), OATs (+3.7bps) and BTPs (+5.2bps) all posted more sizeable increases. In Asia 10yr USTs have edged up +2bps this morning…
DB: Looking beyond the next 25bps to '25: The Fed outlook post election
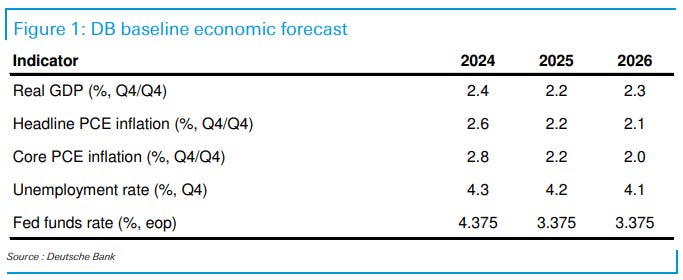
…Setting the stage: Our current baseline view Our current macro outlook for 2025-2026 has three key assumptions:
The TCJA is extended
There are no material increases in tariffs, and
No additional meaningful fiscal packages are passed
Under our baseline scenario, our forecast anticipates continued solid growth near potential, with real GDP growth averaging around 2.25% through 2026. Solid growth produces a stable labor market, with the unemployment rate rising only modestly further in the near term and then settling back closer to its long-run natural rate around 4% by end-2026. Disinflation continues, with core PCE around 2.25% at the end of next year and at target in 2026. Finally, the Fed is expected to undertake two more 25bp rate cuts this year and lower the fed funds rate towards its long-run neutral level of ~3.5% by the third quarter of next year. This baseline outlook is summarized in Figure 1.
We estimate the S&P 500 will deliver an annualized nominal total return of 3% during the next 10 years (7th percentile since 1930) and roughly 1% on a real basis. Annualized nominal returns between -1% and +7% represents a range of likely outcomes around our baseline forecast and reflects the uncertainty inherent in forecasting the future. During the past decade the S&P 500 posted a 13% annualized total return (58th percentile).
We model prospective long-term equity returns as a function of five variables: (1) starting absolute valuation, (2) stock market concentration, (3) economic contraction frequency, (4) corporate profitability, and (5) interest rates.
Our forecast would be 4 pp greater than our baseline if we exclude a variable for market concentration that currently ranks near the highest level in 100 years. The 7% return would rank in the 22nd historical percentile.
The intuition for why concentration matters for long-term returns relates to growth in addition to valuation. Our historical analyses show that it is extremely difficult for any firm to maintain high levels of sales growth and profit margins over sustained periods of time. The same issue plagues a highly concentrated index. Furthermore, the risk embedded in high concentration markets is not always reflected in valuation.
We expect the return structure of the stock market will broaden in the future. Today's extremely high market concentration suggests that the S&P 500 equal-weight benchmark (SPW) is likely to outperform the cap-weighted aggregate index (SPX) during the next decade by an annualized 200 bp-800 bp.
Our forecast suggests equities will face stiff competition from other assets during the next decade. Our 3% annualized equity return forecast combined with a current ten-year US Treasury yield of 4% and ten-year breakeven inflation of 2.2% suggests the S&P 500 has roughly a 72% probability of trailing bonds and a 33% likelihood of lagging inflation through 2034. Excluding concentration, the probabilities of underperforming would be 7% and 1%, respectively.
Our S&P 500 baseline 10-year return forecast is lower than the estimates of other market participants. Buy- and sell-side projections of the long-term return of US stocks averages 6% (range of 4% to 7%).
ECB President Lagarde is set to speak again. It is very unlikely that the last 24 hours have changed the world view of the ECB president. The tone of yesterday’s remarks signaled the direction of travel for Euro area rates was clear, though there was an attempt to insert some ambiguity about the pace of easing.
The Federal Reserve offers its Beige Book of economic anecdote. Economists are a little torn over this. On the one hand, when structural change is happening, economic anecdotes can help identify trends missed by outdated conventional data. On the other hand, political polarization may have tainted even this economic survey.
The IMF tweaked its global growth forecast a little lower and warned that trade taxes would produce negative economic consequences. This would only matter to markets if investors thought the IMF had insights denied to other economists. No one thinks that.
The Bank of Canada is expected to cut rates as it tries to catch up to the decline in inflation (Canadian consumer price inflation has fallen 160bps since December 2023, but rates have fallen only 75bps to date). Euro area consumer confidence and US existing home sales data are due.
… finally, in that I’ve now stumbled on The Economist cover a couple times, a link is required …
We've been recommending overweighting the US in global equity portfolios since 2010. We still are, and it is still working (chart).
We started writing about the Roaring 2020s in the US in 2020. For example, on August 11, 2020, we wrote: "We live in interesting, though not unprecedented, times. The Roaring 1920s could be a precedent for the Roaring 2020s. As Mark Twain observed: 'History doesn’t repeat itself, but it often rhymes.'"
The problem is that the latest issue of The Economist has a front cover story titled, "THE ENVY OF THE WORLD: America's economy is bigger and better than ever." The editors could have also titled the story, "US Hard Landing Forecast: Rest In Peace." Front cover stories like this one have often been contrary indicators.
In 2016, Gregory Marks and Brent Donnelly, analysts at Citibank, looked at every cover story from The Economist going back to 1998, selecting those stories that covered “an emotional or hyperbolic portrayal of an asset class or market-related theme.” They selected 44 cover stories that had either an optimistic or a pessimistic point. They found that impactful covers with a strong visual bias proved after one year to be contrarian 68% of the time. That’s high enough to suggest that market watchers should keep the front-cover curse on their radar.
So be bullish, but stay alert. We will continue to help you do so.
… And from Global Wall Street inbox TO the WWW …
First up from Bolingbroke of Bloomberg …
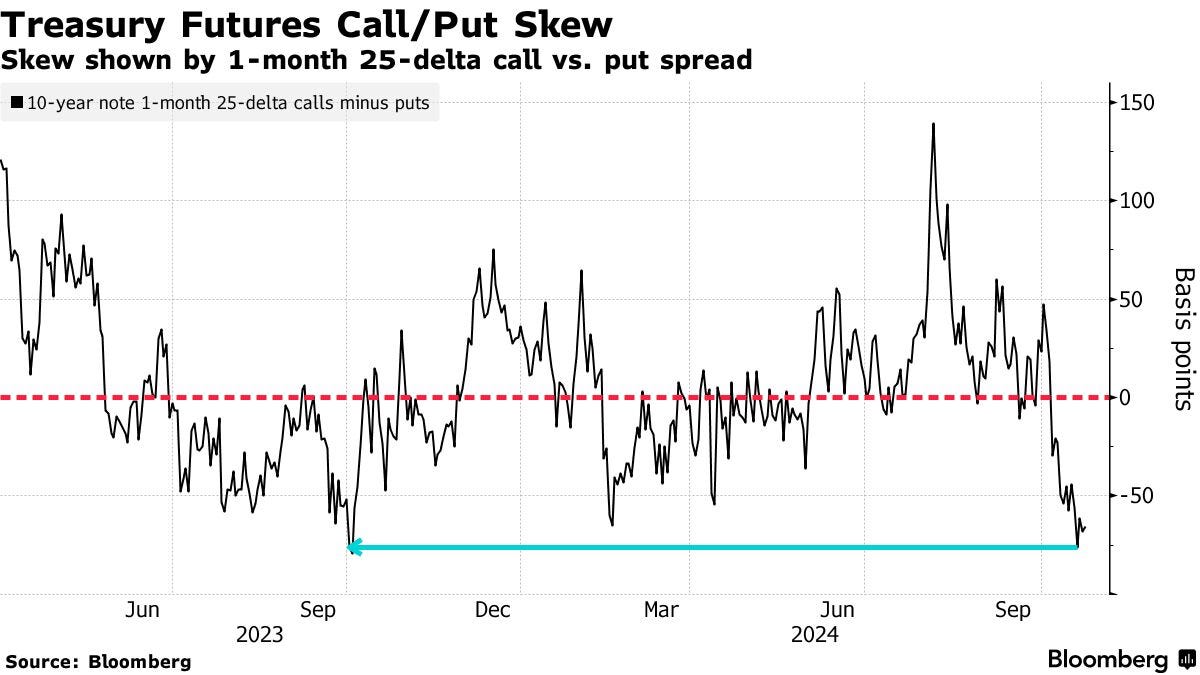
Bloomberg: Cost to Hedge Against Treasuries Losses Soars to Highest of 2024
Options premium on US 10-year heavily skews to bearish hedges
Position seen that targets 10-year at about 4.75% in a month
(Bloomberg) -- The price of options that protect against an extended slump in Treasuries is soaring as traders brace for a bevy of decisive events in the weeks ahead that have the potential to deepen the market’s losses…
…In the Treasury options market, that backdrop is being reflected in the price of puts that protect against higher yields relative to that of calls hedging against lower yields. That skew in favor of puts is close to the most extreme levels this year.
A couple Treasuries options trades seen this week drive home the bearish tone. On Tuesday, one position targeted an increase in 10-year yields to roughly 4.75% within a month — the highest since April — from 4.2% now. On Monday, there was similar demand seen for options targeting a selloff in longer maturities.
The latest jump in yields has drawn added fuel from deleveraging in the futures market, which has also pushed the yield curve steeper. Open interest, a measure of new positioning held by investors, has dropped in 12 of the past 14 sessions in the 10-year contract — a signal that unwinding of long positions has fed into higher cash yields.
… and even MORE from The Terminal dot com …
Bloomberg: Treasuries Plunge Like It’s 1995 as Traders See Soft Landing
Two-year yields have jumped 34 basis points since Fed meeting
Resilient economy limits room for rate cuts as election looms
… Rising yields “reflect the reduced probability of recession risks,” said Steven Zeng, an interest rate strategist at Deutsche Bank AG. “Data has come in pretty strong. The Fed may slow the pace of rate cuts.”
The latest backup in yields shows how a resilient US economy and buoyant financial markets limit the options for Fed Chair Jerome Powell to aggressively lower rates. Interest swaps show traders are expecting the Fed to lower rates by 128 basis points through September 2025, compared with 195 basis points priced in about a month ago…
… ahead of the elections, a convexity special from the maven …
Every significant moment in our Vulcan mind-meld in a blue-pilled Matrix jelly bath social-media linked society is touted as the “most important” or “most consequential” or “most surprising” of our lifetimes.
My general reply to such self-aggrandizing hogwash is:
“It is never different this time.”
That said, as gleaned from interest rate option prices, bond market participants believe the range of outcomes for this general election is much wider than all other elections for which we have records (1988). In fact, I can find only one other instance of similar “date specific” uncertainty, and that was literally in anticipation of a multi-national War.
The -khechol line- MOVE Index was created to tap into the prices for bond options to tease out the market’s collective opinion of the near-term risk.
This fact is revealed by the name I chose: “Merrill’s Option Volatility Estimate”
Unlike many indices, the MOVE is a real number; it is the annualized Implied Volatility for one-month options across the Yield Curve…
… The MOVE Index closed at near 100 on Friday, October 4th. And on that date, the standard one-month expiry date was Monday, November 4th. The next day was Monday, October 7th, and the standard one-month date rolled to Thursday, November 7th, which now included the November 5th general US election.
With the simple shift of the calendar, the -sagol line- MOVE jumped to 124.
…Concluding Thoughts … What this all means is that without an economic “crash landing”, the interest rate market is on a flight path back to normalcy.
From 1990 to 2010 (the period before the GFC), the spread between the Federal Funds rate and the US 10yr rate averaged 160bps. For the entire the thirty-fiveyear period of 1990 to 2024 this spread averaged 143bp.
Relative to the FED’s longer run (DOTs) projection of 2.88%, the current 10yr at 4.09% is not too distant from my projected “normal rate” of 4.25% to 4.50%.
Newly issued MBS yield 5.41% or +132bp to the 10yr. This is still the “wrong price” versus its long-term average of +75bp. My good friend @profplum99 is forecasting an economic crash landing; if not, my NYSE-listed MBS Strategy is still the best risk-adjusted investment in bond land…
… and for everyone of LPLs inner bond market wonks …
…According to economic theory, each security on the Treasury yield curve represents the predicted fed funds rate over the security's maturity period, plus or minus a term premium. The Treasury term premium is the additional compensation required by investors who buy longer-term Treasury securities. The term premium, which is unobservable and hence must be approximated, considers a variety of factors, including Treasury supply/demand dynamics, foreign central bank expectations, and the possibility of future inflationary pressures. Additionally, rising term premiums could also indicate markets are betting on higher government deficits depending on election odds.
Treasury Mid Prices Move Back Into Positive Territory
The last time a term premium turned positive was around a year ago, in October 2023. The recent increase follows a surge in Treasury yields following solid U.S. jobs data last week, which caused investors to reduce their bets on the size of future interest rate reductions by the Fed. Benchmark 10-year rates, which fell to a one-year low in September on anticipation of monetary policy easing, have subsequently risen to well over 4.2% (as of October 22), reaching their highest level since late July.
So, how does this affect fixed income investors? A positive term premium could keep longer-term interest rates elevated, perhaps reducing the diversification benefits of core bonds. Regarding the former, while monetary policy expectations will continue to be the dominant driver of interest rate changes, Fed rate cuts may not have the desired effect, and longer-term interest rates may not fall as much as they would have without a positive term premium (like we’ve seen recently). In terms of the latter, while we still believe Treasury securities will be the safe haven choice in the case of a broad macro equity market sell-off, they may not be the best defensive option for garden-variety equity market sell-offs. …
… and for anyone looking for a great chartbook and some sage words of wisdom from SSGA …
STATE STREET: Q4 Bond Outlook: How to position for rate cuts
Don’t Fight the Fed With the Federal Reserve (Fed) expected to cut interest rates multiple times over the next few meetings, investors should begin repositioning bond portfolios to follow the Fed. That means moving out of cash-like vehicles with declining yield and return potential and investing that capital in:
Active short-term ETFs where managers have wider remits to position for increased yield and total return
High income sectors where credit trends support risk-taking
Mortgage-backed securities (MBS) or MBS-biased core strategies where declining rates are a tailwind and active managers can seek to exploit mispricings
…High Income Strategies As rates fall, the income potential from the traditional 60/40 portfolio will likely mean revert to its long-term trend (Figure 3).
Figure 3: 60/40 Portfolio's Yield Over Time
… finally … Lorie Logan speaks, we are served well to listen (and occasionally look to interpretations of said commentary) …
WolfST: The Future of QT, Balance Sheet Composition, and Liquidity: Fed’s Lorie Logan
QT continues. Liquidity “more than ample.” Money market spreads widening briefly is OK. Selling MBS, shifting Treasuries to T-bills on the table.