while WE slept: USTs trackin' Gilts, Bunds lower on avg volumes o/n; "...Rates Matter Again for Equities" -MS (who's also updated 2024 econ outlook...)
Good morning … Longtertrneds CHARTS review offered one which caught MY eyes …
… 4. The Recession Predictors
Continuing with our analysis of the late stage of the current economic expansion, two key recession indicators—the Yield Curve and the Consumer Confidence Spread—are signaling red. These indicators originate from distinct sectors of the economy. The Consumer Confidence Spread measures the disparity between current conditions and future expectations. Historically, both indicators follow a clear pattern, reaching their lowest points just before a recession begins. (Neil Howe at 14:00 and 59:50 in the video)
… AND with Team Rate Cut able to look past WW3 this morning (at least as far as ‘Earl goes) and TO ReSale Tales with some amount of ‘optimism’ (in their own twisted way), I’ll move right along … For a more RATES centric view of the world, including bullish takes on 2s, 10s — WEEKLY — see this past weekends note … here is a snapshot OF USTs as of 705a:
… HERE is what this shop says be behind the price action overnight…
… WHILE YOU SLEPT
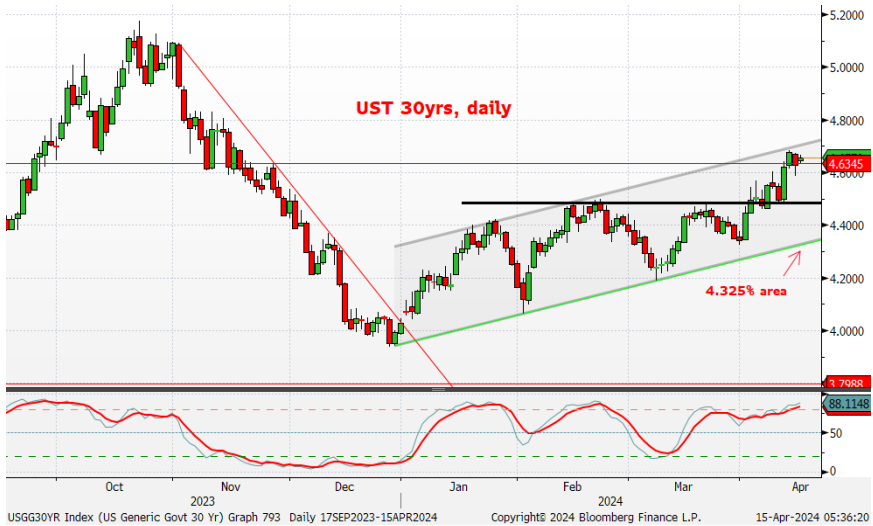
Treasuries are tracking Gilts and Bunds lower this morning as markets assess the retaliation risks after this weekend's attacks on Israel. DXY is lower (-0.12%) while front WTI futures are lower too (-0.9%). Asian stocks were mostly lower, following NY Friday, while EU and UK share markets are mostly higher (SX5E +0.9%). ES futures are showing +0.42% here at 6:35am. Our overnight US rates flows saw prices give back some of Friday's 'risk-off' gains with intermediates leading lower during Asian hours. Our desk flows were sparse but we did see better buying on the dip- especially from real$ in the long-end. During London's AM hours, further dip buying was seen in the 3yr-7yr sector after a 3k block sale in TYs pressured prices a bit further. Overnight Treasury volume was about average across the curve this morning.… Our next attachment checks-in with the other end of the curve via the daily chart of Treasury 30yr yields. Last week, bonds held support when they should have, but there is not yet an overtly bullish signal from momentum (lower panel yet) which sits at the kind of 'oversold' levels evident in recent bull turns. Maybe we'll have a clearer signal this afternoon after retail sales?
… and for some MORE of the news you might be able to use…
IGMs Press Picks: April 15 2024
NEWSQUAWK: US Market Open: Equities firmer, JPY soft and AUD benefits from metals strength whilst crude sinks; US Retail Sales due … Bonds pressured in a continuation of recent price action, Bunds looking to test 132.00 … USTs are pressured in a continuation of the late-Friday pullback as the Iran-Israel situation had yet to escalate as much as some feared at that point. USTs hold at their 108-06 trough, below which Friday's 108-00+ base resides before last week's 107-27+ low.
Reuters Morning Bid: Weekend safety trades unwind amid Iran/Israel tension
Finviz (for everything else I might have overlooked …)
Moving from some of the news to some of THE VIEWS you might be able to use… here’s SOME of what Global Wall St is sayin’ (on top of what was noted HERE over the weekend … and in addition TO TO (updated calls) offered last week …
BNP Sunday Tea with BNPP: Bond breakout?
KEY MESSAGES
We think markets are likely to trade cautiously to start the week until there is more clarity on the situation in the Middle East.
Fundamentally, the March CPI print will make it very difficult for the Fed to justify cutting rates anytime soon. We have changed our Fed call, now looking for two cuts this year in July and December.
The recent move in US yields has many parallels to the August-October 2023 breakout. We see scope for yields to keep pushing higher should geopolitical tensions come off the boil.
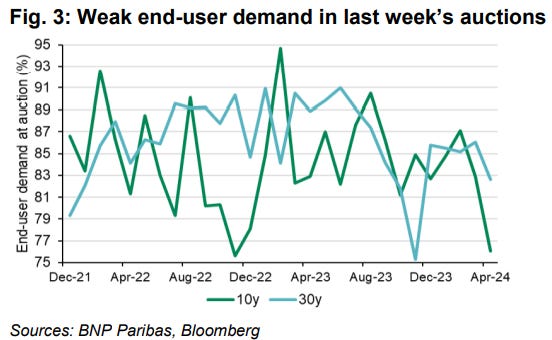
… This time around, it’s less about growth acceleration and more about growth resilience, while the inflation outlook has shifted dramatically – markets had priced 2024 y/y CPI at 2.1% at the start of the year, where swaps now imply 3%. Similarly, while Treasury supply has not been a source of surprise, duration supply to the market is now at an all-time high and it appears that we may have returned to an environment where supply digestion is an additional source of volatility (visible in weak end-user demand for both 10y and 30y supply last week, Figure 3).
Taking all these things together, we see a compelling argument for the range on 10y yields to move higher (versus our prior baseline of 3.9%-4.4%). At a minimum, we think the outlook is now consistent with 4.4-4.5% as a midpoint (rather than the top end) of the range for 10s. A return to 5% 10s is plausible in an outcome where there is some combination of upward drift in longer-term inflation expectations and/or a more complete pricing out of cuts this year…
CitiFX - US stocks: Rising risk of a large pullback
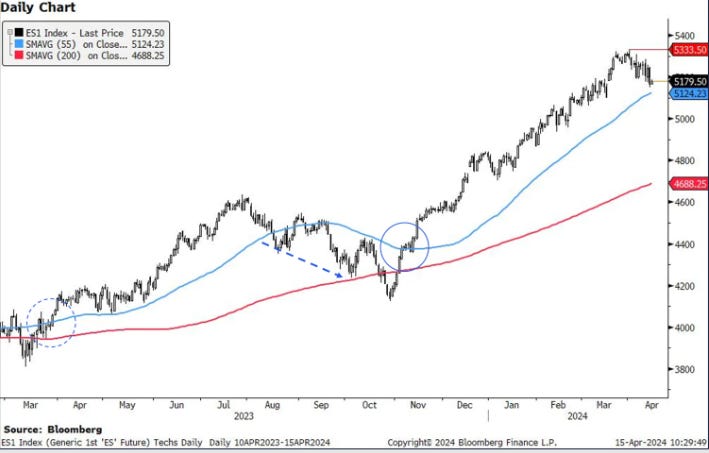
The risk: Price is coming close to the 5124 (55d MA) support level. This is significant as we have a potential 55-200d MA setup on our hands. IF we see a weekly close below, it would open the door to a ~8.5% move lower towards the 200d MA. Supporting the building blocks … Near term: Support is at the 5124 (55d MA), while resistance is at 5334 (2024 highs).
OTHER TECHNICAL DEVELOPMENTS WORTH NOTING
US 10y yields: Clear signs of dip buying in US 10s, with yields failing to close above the 4.51%-4.54% (Nov 27 high, 61.% Fibonacci retracement) level. We continue to be slightly biased towards higher yields given the weekly engulfing candle. However, we remind that we need to see a weekly close above this resistance level to open a 15bps move higher towards the 4.70%-4.73% (November 13 high, 76.4% Fibo retracement) levels…
Goldilocks Oil Comment: Early Thoughts on Potential Oil Market Effects of Iran’s Attack
… While we estimate that oil prices already reflect a $5-10/bbl risk premium from downside risks to supply, we continue to see significant portfolio hedging benefits from investing in oil against negative geopolitical shocks …
MS Sunday Start | What's Next in Global Macro: Rates Matter Again for Equities
In our first note of the year, I cited three potential macro outcomes for 2024 with similar probabilities: 1) A soft landing with slowing/below-potential GDP growth and inflation falling toward the Fed's target of 2%; 2) A no landing scenario under which GDP growth re-accelerated with stickier inflation; and (3) A hard landing. Each scenario has very different implications for asset prices generally and equity leadership specifically. Just a few months ago, the consensus view skewed heavily toward a soft landing. However, the macro data have started to support the no landing outcome, with recent growth and inflation data points exceeding most forecasters' expectations, including the Fed’s…
… Unsurprisingly, small caps saw the more material underperformance along with other lower-quality/more levered cyclicals that are most negatively correlated to 10-year yields ( Exhibit 2 ).
… The bottom line is that no landing may be good for growth but challenging for equity valuations if rates push higher. The best opportunities likely lie beneath the surface in individual stocks.
MS US Equity Strategy: Weekly Warm-up: Rates Matter Again for Equities
With the 10-year yield breaking definitively above our key 4.35-4.40% level, equities' rate sensitivity has increased, led by small caps and low quality. This all makes sense in the context of a "no landing" outcome, which means better growth, but valuation headwinds if rates push higher.
… The simplistic relationship shown in Exhibit 5 illustrates that equity multiples have meaningfully diverged from both higher 10-year yields and the bond market's pricing of a reduced number of Fed cuts this year. While the level of rates suggests valuations are rich, the more statistically sound approach is to look at this relationship in rate of change terms.
Exhibit 5: Higher Rates Suggest Lower Multiples
MS US Economics: Outlook Update: Near-Term Inflation Against a Positive Supply Shock
Recent inflation prints muddy the near-term path, so we push the first cut to July and take out one forecasted cut this year. For this year and next, we boost our GDP forecast while maintaining the disinflationary trend, building on our analysis of faster labor force gains. In the new path, we see the Fed stopping cuts mid-2025 at 3.625%.
Key takeaways
CBO estimates show that immigration is driving faster population growth and adding to labor supply. As a result, we have revised up GDP growth.
GDP growth comes up 0.7pp to 2.3% 4Q/4Q this year, and 0.7pp to 2.1% in 2025, relative to our outlook five months ago. Monthly job gains average 225k this year and 186k in 2025.
Our analysis suggests the 2023 breakeven pace for employment was in the range of 230k-275k/month, and we project ~265k per month in 2024, ~210k in 2025.
The higher breakeven increases unemployment as supply outstrips demand. We now forecast the unemployment rate at 4.2% in 4Q24 (vs 3.7% 4Q23) and 4.5% in 4Q25.
We call for 75bp in cuts this year - July, Nov, Dec. In 2025, rapid growth and some inflation pickup cause the Fed to stop cutting mid-year at 3.625%.
MS The Weekly Worldview: Where is inflation driving central banks?
Inflation prints are driving central bank policy paths around the world. In the US, the data are equal parts signal and noise.
Globally inflation data have had both upside and downside surprises that stirred markets, most notably with last week’s US CPI print. On the back of a seeming re-acceleration in core services, markets further discounted the possibility of the Fed initiating its cutting cycle in June. Pricing shifted to imply less than 2 cuts for the year. The PPI data the next day, however, implied to us that the market may have overreached.
Core services inflation remains sticky in the US
UBS (Donovan): Tensions and ignoring tail risks
Markets are relatively calm in the wake of events in the Middle East. This may seem peculiar, but markets rarely price in extreme tail risks. Iran indicated it considers the matter concluded. US President Biden has urged restraint. Signs from the Israeli war cabinet suggest a response, but there is no idea of scale. The G7 has been as effective as the G7 ever is, talking about sanctions against Iran without agreeing on action.
There are wider implications. US House Speaker Johnson has prevented movement on a bipartisan Senate bill to offer aid to Israel, Ukraine, and Taiwan. Current Middle Eastern events may change the view of former President Trump (causing Speaker Johnson to change his view), or might switch votes to support the measure. However, markets have priced in most of the risks associated with Ukraine.
US March retail sales are due. While inflation perceptions are high in the US, inflation reality is more benign (especially for middle-income families), giving a spending fire power that has sustained consumption. The pivot from spending on goods to spending on fun is still taking place, which means retail sales should underperform overall consumption.
Assorted central bank speakers are due—the ECB’s Lane and the Federal Reserve’s Williams are the focus.
… And from Global Wall Street inbox TO the WWW,
AllStarCharts: Big Mac Inflation is Real
… I’m mostly just joking about the Big Mac indicator because it’s hilarious.
I love that the Federal Reserve Bank of St. Louis is taking time out of their day to put out this kind of quality work.
But the publicly traded markets are suggesting the exact same thing.
Look at Gasoline looking to complete this multi-year base.
This is all happening as the bond market is pricing in the same thing – higher inflation:
TIPS are Inflation Protected Treasury Securities. So when you calculate a ratio of TIPS vs Nominal Yielding Treasuries, you get a good look at what the bond market is pricing in for inflation.
Do you actually trust your government’s data?
Do you really trust the pretty lady on basic cable?
Or do you trust the bond market?
I’ll take the latter all day.
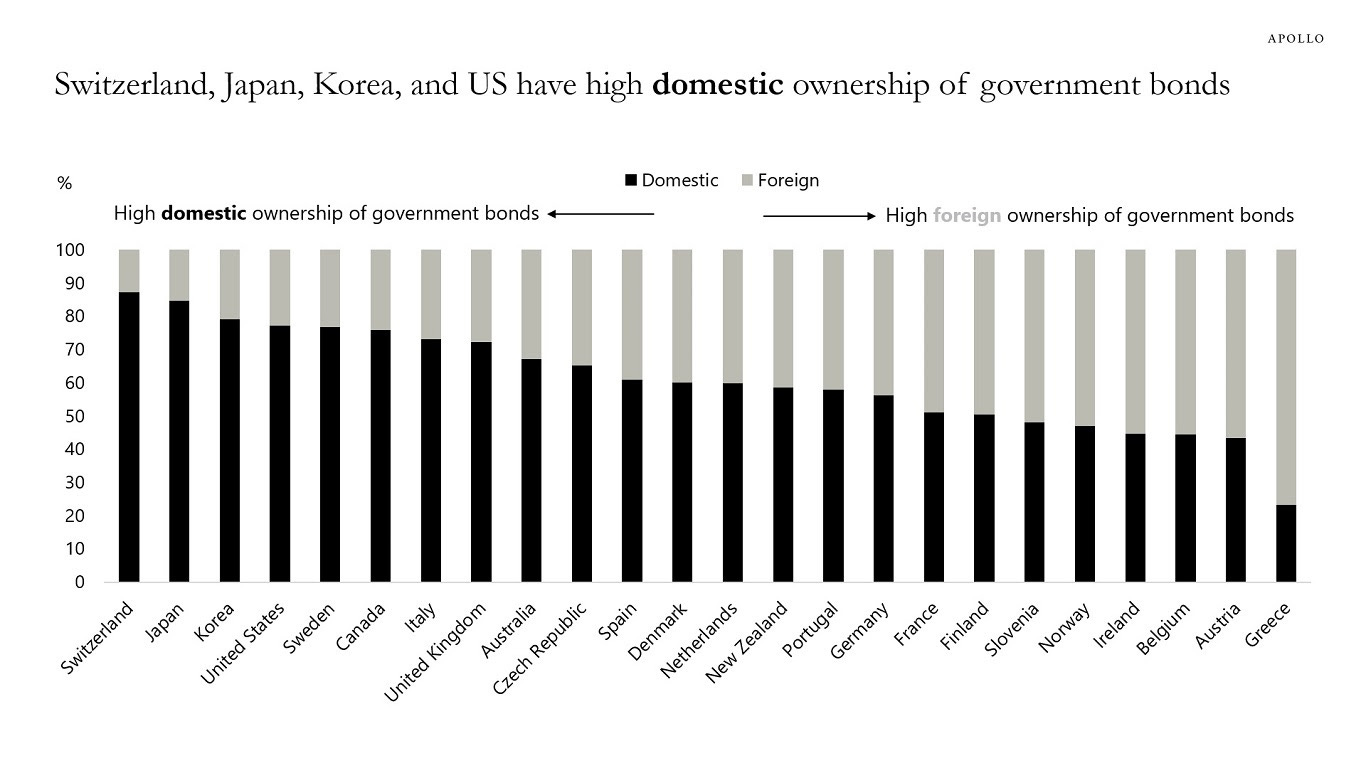
Apollo: Ownership of Government Bonds Across Countries
The US has a relatively high share of domestic ownership of government bonds relative to European countries, see chart below.
Bloomberg: What the Middle East Now Implies for the Global Economy, Markets (El-Erian OpED where every OPINION is created equally and some are viewed to be more equal than others … )
They are relatively well-placed to handle the immediate uptick in the geopolitical risk premium. They are not well-placed to navigate further escalations that would involve more parties in a more significant manner.
Bloomberg: Battered Bond Traders Adopt Show-Me Mode to Avoid More Losses
Inflation, growth data once again dashes rate-cut expectations
Swaps traders price in less than two full Fed cuts during 2024
Bond investors who were torched yet again by robust economic data now want clear and conclusive proof that Federal Reserve interest-rate cuts are imminent before making any more big bullish wagers.
US yields surged to their highest levels of the year last week after traders were dealt the nasty surprise of a third straight month of sticky inflation. The market shock was accompanied by a wave of fresh short positions, with a growing camp of investors turning wary. Weak demand at the Treasury’s recent sales of long-term bonds provided even more evidence of bearish sentiment…
…After starting the year by pricing in as many as six rate cuts in 2024, or 1.5 percentage points of easing, traders are now doubtful there will even be a half point of reductions. Most Wall Street economists have dialed back forecasts as well, setting up a dour scenario for US yields including a possible repeat of maturities breaching 5% as they did last October.
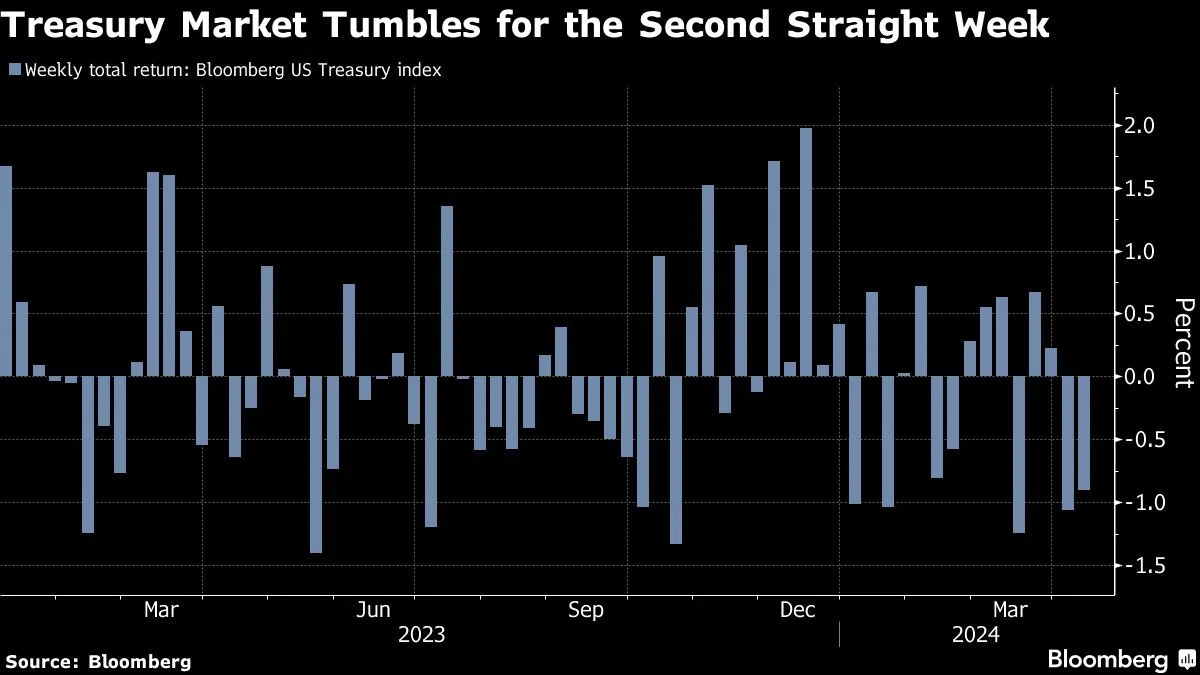
The recalibration in rate-cut expectations has been brutal for bonds. US Treasuries lost about 0.6% last week and are down some 2.6% for the year so far, according to a Bloomberg index. That’s a giveback of more than half of the 4.1% gain they posted in 2023.
Bloomberg: Rate Chokehold on World Economy Is Set to Loosen Only Slowly
Borrowing costs are poised to fall, but not by that much
Markets face ‘a period of pivot peril,’ says BE’s Tom Orlik
… Its aggregate measure of borrowing costs across advanced economies is set to fall less than 100 basis points by the end of 2024. That’s not as much as it rose last year, and just a fraction of the 435 basis-point increase seen since mid-2021. And the lag in transmission means easing effects will take more time to feed through.
Sam Ro from TKer: Reflecting on 20 years of backwards financial moves
… I got my first big freelance writing client through a colleague of a friend of a friend, all of whom I met by attending the alumni happy hours for a college I didn’t attend …
Finally, it’s tax extension filing day and so …
… THAT is all for now. Off to the day job…






As the resident Gold Bug, the yellow metals on my mind. ZH claims there was a BIG 1.6B 3 min gold futures sale last Thursday. DUH! It's like being a Liverpool soccer fan, you play (or move aka gold) valiantly for months, only to collapse late w/the finish line in sight. Volker's Big Mistake's also on my mind, now time to read Anguish of Central Bankers, h/t to Brent Donnelly's Friday Speedrun. Some say Powell's current dilemma's highly similar to Burn's....