while WE slept: USTs steeper/cheaper; FED to markets, 'higher for longer', MARKETS to Fed, 'pivot 2.0 party fires up bond bulls'
Good morning … as things get back TO ‘normal’, I’d like to begin with an update to the CPI, ReSale Tales, Jobless Claims and voters speaking impact on the 7yy …
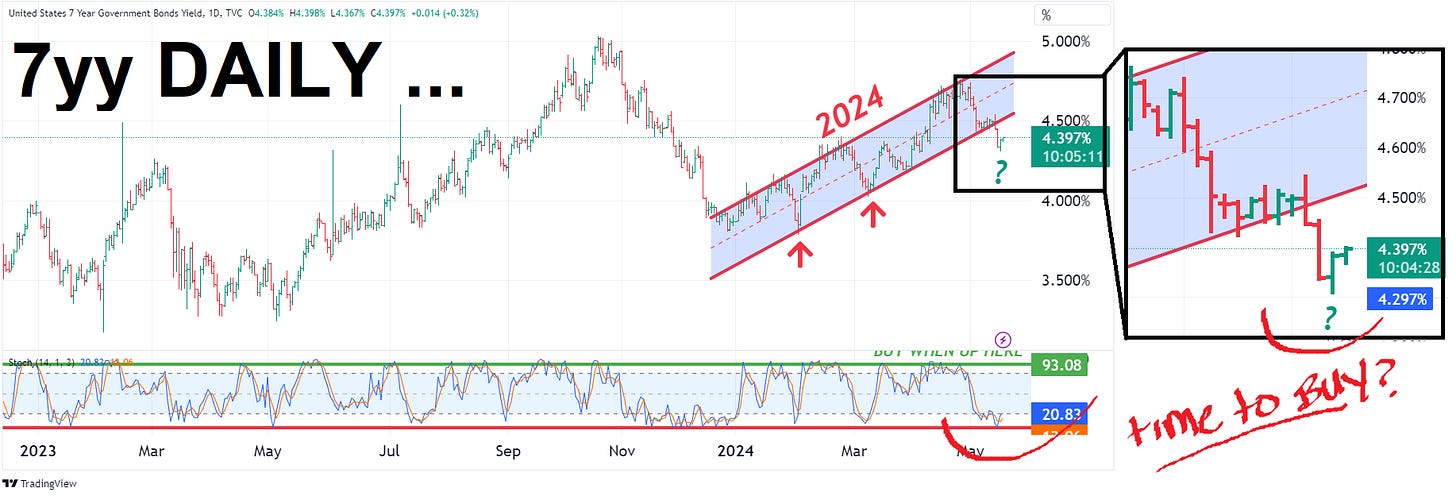
… it appears we’ve got at least SOME of the questions answered (2024 UPtrend has been broken) and SOME — see the self proclaimed AllStars (shows up first in the phone book — remember those?) say NOWs the time to BUY BUY BUY bonds. They are not alone and MY hesitation only stems from having yet to redraw the TLINES and oh, yea, I keep listening to those card carrying members of the I VOTE AT THE FOMC club … to my detriment, clearly. Point being there can be ways to view bonds as a BUY — specifically if we look at longer term (weekly, monthly) setup — and I’ll attempt to do that over the weekend. For NOW, will be watching today’s turn of events (ie STONKS) and how / IF it impacts a weekly chart.
… AND back to the rockpile with some updated input from IJC and housing …
ZH: Jobless Claims Decline After Last Week's Big Surge Amid New York Chaos
ZH: US Housing Starts/Permits Ugly In April After Huge Revisions
ZH: Industrial Production Disappoints, Manufacturing Contracts As Downward Revisions Continue
… quite the trifecta … which puts us right back TO ReSale Tales and CPI and how BAD is good …
… here is a snapshot OF USTs as of 705a:
… HERE is what this shop says be behind the price action overnight…
… WHILE YOU SLEPT
Treasuries are steeper and cheaper in early London hours after a sideways range in Asia. There were a few blocks registered before the London open in SFRZ4 (1.3mn/01 in buying), along with block steepener: +3,900 FVM vs -800 WNM. In London, our desk noted early interest from 2s10s flatteners from fast$, while real$ flow has been uniquely quiet save for some dip-buying interest in the very front end. Overall volumes are ~70%, with EGBs underperforming ever so slightly after some hawkish commentary from Schnabel and Holzmann. APAC equities were well-bid in response to the PBOC’s announced support for the housing sector: (SHPROP +6.2%, SHCOMP +1%, HSI +0.9%, NKY -0.3%). Commodity futures on the other hand, shrugged, with CL +0.1%, HG -0.2%, and XAU +0.4%. The DAX is -0.4% and S&P futures are showing -1.5pts here at 7am.
… and for some MORE of the news you might be able to use…
IGMs Press Picks: May 17 2024
NEWSQUAWK: US Market Open: Chinese support measures lift metals, Dollar bid & Bunds lower amid hawkish remarks; Fed speak due … Bonds are pressured, more-so in EGBs following hawkish commentary from ECB’s Schnabel … USTs are modestly softer, and to a lesser degree than EGBs; bullish-impetus from the BoJ maintaining its Rinban purchase amount is weighed up against hawkish commentary from ECB's Schnabel. Currently only a handful of ticks lower at around 109-14.
Reuters Morning Bid: Dow flirts with 40k, China fights homes bust
Finviz (for everything else I might have overlooked …)
Moving from some of the news to some of THE VIEWS you might be able to use… here’s SOME of what Global Wall St is sayin’ as day begins and week comes to a close…
BARCAP: April IP: Sideways, not softening (important distinction but unsure this matters as much as HOPE for BAD which is perceived as good)
Industrial production was unchanged in April, with a jump in utilities offsetting declines in the manufacturing component. Although April's softness in manufacturing will likely reinforce the market narrative that the economy has softened in Q2, we think industrial activity remains on a sideways trajectory.
BNP G3 rates: Central bank rates, looking beyond the linear
KEY MESSAGES
The option-implied probabilities of central banks hiking policy rates this year are around 20% for the Fed, 10% for the BoE and 5% for the ECB.
On the other side of the distribution, the implied likelihoods of 2024 cuts of at least 100bp are 19% for the Fed, 26% for the BoE and 30% for the ECB.
The year-end SOFR distribution has an extended left tail due to elevated receiver skew. From this it could be inferred that investors view the US as the most likely source of a broad risk-off event, due to its unique position at the centre of the global economy.
BNP: Long S&P 500 reaches target for 6.2% gain
Our long S&P 500 trade idea reached its target heading into yesterday’s market close, and we close for a 6.2% gain.
We initiated the trade idea after our MarFA™ Macro model indicated that the index appeared significantly oversold amid Israel–Iran tensions (see Quant Trades of the Week, 22 April). The S&P500 is now close to its MarFA™ fair value.
Our BNPP US Equity Positioning Indicator gave us the confidence to follow MarFA’s oversold signal, with a pickup of positioning to 43 (scale from 0 to 100) on 22 April. Positioning now stands at 77, close to extreme levels, driven mostly by systematic strategies and an unwind in short interest.
At the same time, our Global Risk Premium indicator has approached ‘high risk appetite’ territory and is currently at −0.5 (scale from −1 to 1).
DB: Fiscal outlook: A chicken in every pot is costly (Team Rate CUT is watchin this space …)
The May Treasury refunding guidance was largely in line, with the only minor surprise being Treasury's target level for the TGA (see "US Fixed Income Weekly: Strategy Update"). With Congress finally passing the FY 2024 budget in March and more recently supplemental aid to foreign allies, the near-term budget outlook is little changed relative to our prior FY 2024 deficit estimate of roughly $1.7trn (see "Gauging the size of the fiscal purse when power over it is paralyzed") with risks skewed toward a slightly lower deficit.
As the CBO noted recently, fiscal year-to-date (October - April) receipts were tracking up 10% ($278bn) while outlays were up roughly 6% ($210bn) relative this point in FY 2023. The upshot is that the accumulated deficit FYTD (-$857bn) is roughly $70bn less than the same period last year. To be sure, a little over a third of the rise in revenues is due to delayed tax payments from last year. However, the outlook for the remainder of the fiscal year, which runs through the end of September, appears stable.
Beyond September, risks to the budget outlook multiply. First, the debt limit will come back into force on January 1 of next year. Second, as we have previously highlighted (see "2024 US election: Notes from the campaign trail"), the fiscal stakes are high in this election cycle with the 2017 Tax Cut and Jobs Act (TCJA) slated to start unwinding in 2025. Our static analysis of alternative fiscal policy mixes that broadly reflect the platforms of the two parties show negligible differences with respect to deficit outcomes.
Though we do not attempt to dynamically score the potential policy paths that we have outlined, the CBO's "rules of thumb" provide a rough guidepost. Even assuming a jump in total factor productivity growth over the next five years, deficits would still exceed 5% of GDP - well higher than would be consistent with a stable debt-to-GDP ratio (see "Debt stability: Role of inflation is inflated, term premium is paramount").
Goldilocks: Boosting April Core PCE to 26bp on Higher Import Prices; Philly Fed and Housing Starts Miss; Jobless Claims Retrench (Team Rate Cut … please advise)
BOTTOM LINE: The Philadelphia Fed manufacturing index declined by less than expected in May. The composition was mixed, with decreases in the new orders and shipments components but an increase in the employment component. Both import prices and import prices ex-petroleum increased by more than expected in April, and we boosted our April core and headline PCE estimates by 1bp each to +0.26% and +0.27%, respectively, corresponding to year-over-year rates of 2.77% and 2.67%, respectively. Housing starts increased 5.7% in April from a downwardly revised March level, below expectations. After jumping in the prior week, initial jobless claims fell roughly in line with consensus expectations.
Goldilocks: Industrial Production Unchanged in April; Boosting GDP Tracking to 3.2% (Team Rate Cut … please advise)
BOTTOM LINE: Industrial production was unchanged in April, slightly below expectations, and manufacturing production declined by 0.3%. Following today’s data, we raised our Q2 GDP tracking estimate by 0.2pp to +3.2% (qoq ar) and our domestic final sales estimate by 0.1pp to +2.5%, but we lowered our past-quarter GDP tracking estimate for Q1 by 0.1pp to +1.2% (vs. +1.6% originally reported).
UBS: China’s vulnerabilities
China reported stronger industrial production and weaker domestic retail sales. If these figures are accurate, they present some risks to China’s policy-makers. Production strength seemed focused in politically-sensitive areas, including computing and autos.
Reporting stronger industrial production data helps China hit the official growth target for this year (traditionally important). But if the growth target is met through production without domestic consumption, China becomes vulnerable to trade reprisals in a climate of rising economic nationalism. Whether or not foreign accusations of unfair trade practices are accurate is not relevant—with prejudice politics on the increase around the world, it is the presentation of policy that matters, not its effectiveness…
Wells Fargo: Housing Starts Improve in April
Lagging Single-Family Activity Offset by Surge in Multifamily Starts
Summary
Mortgage Rate Resurgence Challenges Construction
Total housing starts rose 5.7% to a 1.36 million-unit pace in April. Despite the improvement, the recent resurgence in mortgage rates appears to be discouraging builders and denting single-family construction. April's gain was entirely owed to a spurt of new multifamily development, which is highly volatile on a month-to-month basis and remains set on a downward trend. Single-family starts slipped for the second consecutive month, coinciding with a three-month streak of falling permits. Although interest rates are likely to remain elevated, our expectations for rate cuts later this year would indicate a gradual lowering of mortgage rates and be supportive of new construction.Wells Fargo: More of the Same from April Industrial Production
Summary
Industrial production stalled in April amid a pullback in manufacturing output as the sector remains constrained by tighter credit conditions and elevated borrowing costs. Elevated uncertainty leads us to expect production will continue to be range-bound in the coming months.Wells Fargo - Do We Have Potential?: An Analysis of U.S. Potential Economic Growth
Summary
An economy's long-run sustainable rate of economic growth—the rate at which it can grow over a long period of time at a constant inflation rate—is determined by underlying supply factors, specifically by its labor force growth rate and its underlying rate of labor productivity growth.
The potential rate of economic growth in the United States has trended lower over the past few decades as labor force growth has slowed considerably. Productivity growth has waxed and waned over that period, but it is slower today than it was in the 1950s and 1960s. The Congressional Budget Office estimates that potential economic growth in the United States is only 2.2% per annum today.
Potential economic growth can have important real world consequences. An economy that grows in excess of its potential growth rate for a long enough period of time will likely experience rising inflation. Conversely, an economy that consistently falls short of potential economic growth could experience a downward spiral of falling prices and rising defaults among borrowers.
Furthermore, differences in potential GDP growth compound over time, affecting a country's ability to project economic and military power.
In a series of five reports, we will analyze the outlook for potential economic growth in the United States. We will address U.S. labor force growth in Part II before turning to the two factors that determine growth in labor productivity. Part III will focus on changes in the capital stock while we will discuss total factor productivity in Part IV. We will offer concluding thoughts in Part V.
Yardeni: Bad News About Goods Is Good News For Bonds & Stocks (i hate this job … oh wait, i dont have this job anymore … i hate all this quasi NOT analysis)\
The Dow is flirting with 40,000 currently, confirming that good news is good news and bad news is also good news for the stock market these days. That's because the bad news is also good news for the bond market. On balance, the news is that inflation is moderating and the economy is growing.
Yesterday's April CPI report confirmed that inflation remains on course to fall to the Fed's 2.0% target by the end of this year. The Atlanta Fed's GDPNow model is currently showing Q2 real GDP tracking at 3.6% (saar) with consumer spending up 3.4% despite yesterday's weak April retail sales report. Here are our quick takes on today's batch of economic numbers:
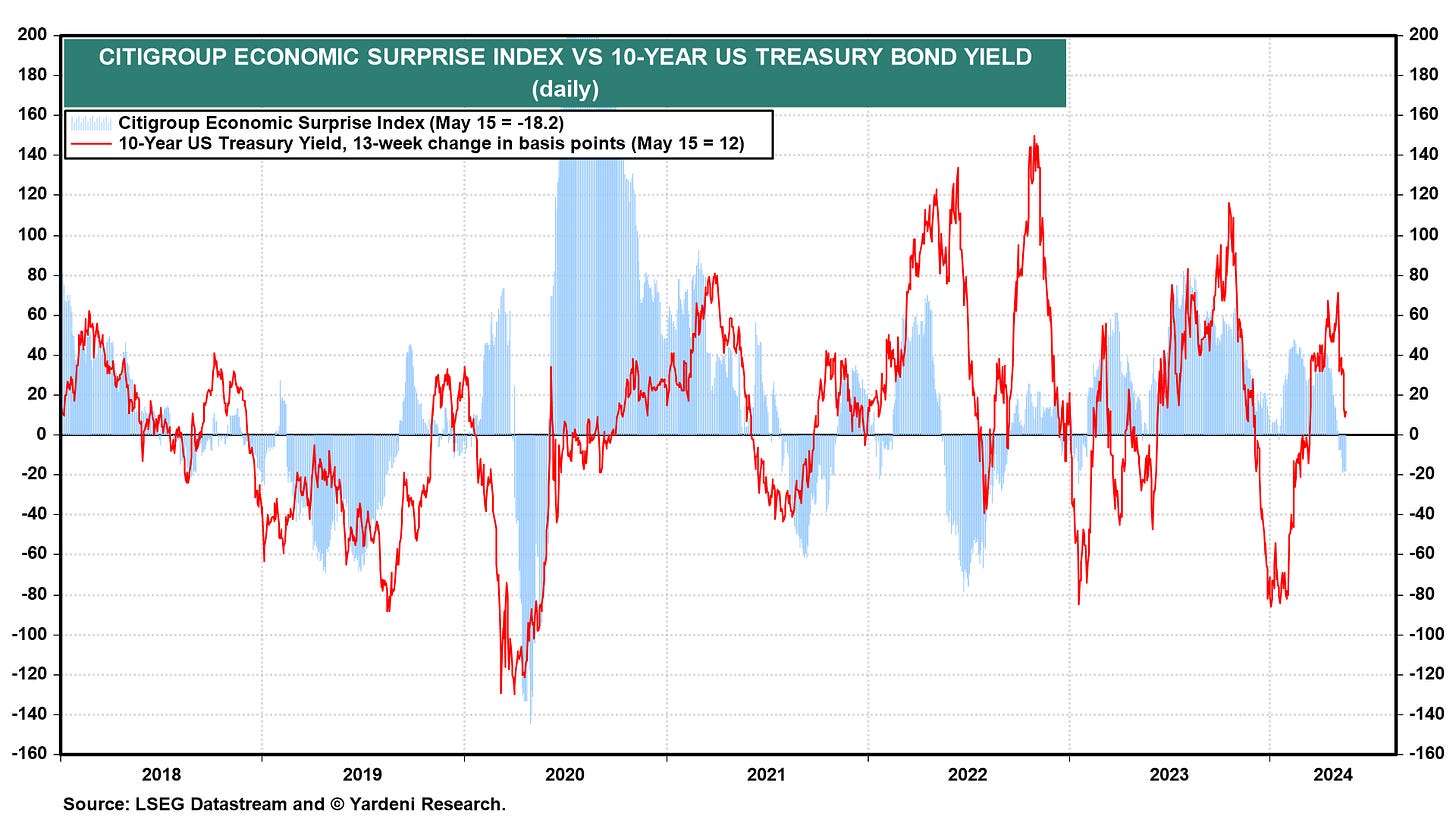
(1) The Citigroup Economic Surprise Index has been back down in negative territory since May 2--for the first time since early 2023 (chart). The latest string of weak-than-expected economic indicators sank the 10-year US Treasury bond yield from its recent peak of 4.71% on April 25 to 4.36% currently.
… And from Global Wall Street inbox TO the WWW,
AllStarCharts: Bonds Trigger a Tactical Buy (NOW after the CPI rally, you tell us?)
… Two key themes dominate these trade setups: entry points designated by price reclaiming the February 2024 lows and initial targets set at the December 2023 highs.
Of course, there’s always an exception…
Check out the US 30-year T-bond futures:
Like the following charts, we can measure our risk at a key pivot low from late February.
I like buying T-bond futures against 117’27. But instead of targeting the December 27th high of 125’30, I prefer to aim at a critical shelf of former lows at approximately 122’30.
If and when price manages to close above those former lows (last year’s March and July Troughs), we can adjust our objective to the late 2023 high.
Let’s approach these bond trades with a shorter-term mindset until the market suggests otherwise.
Here are the corresponding levels for the T-bond ETF $TLT:
We can swing at TLT if it trades above 92, targeting 99.
The 10-year T-note posted a decisive breakout yesterday:
Our entry-level coincides with the February 22nd close of 109’17.
If the 10-year is above that tactical polarity zone, we’re long with targets of 113’06 and 117’00 over more extended time frames.
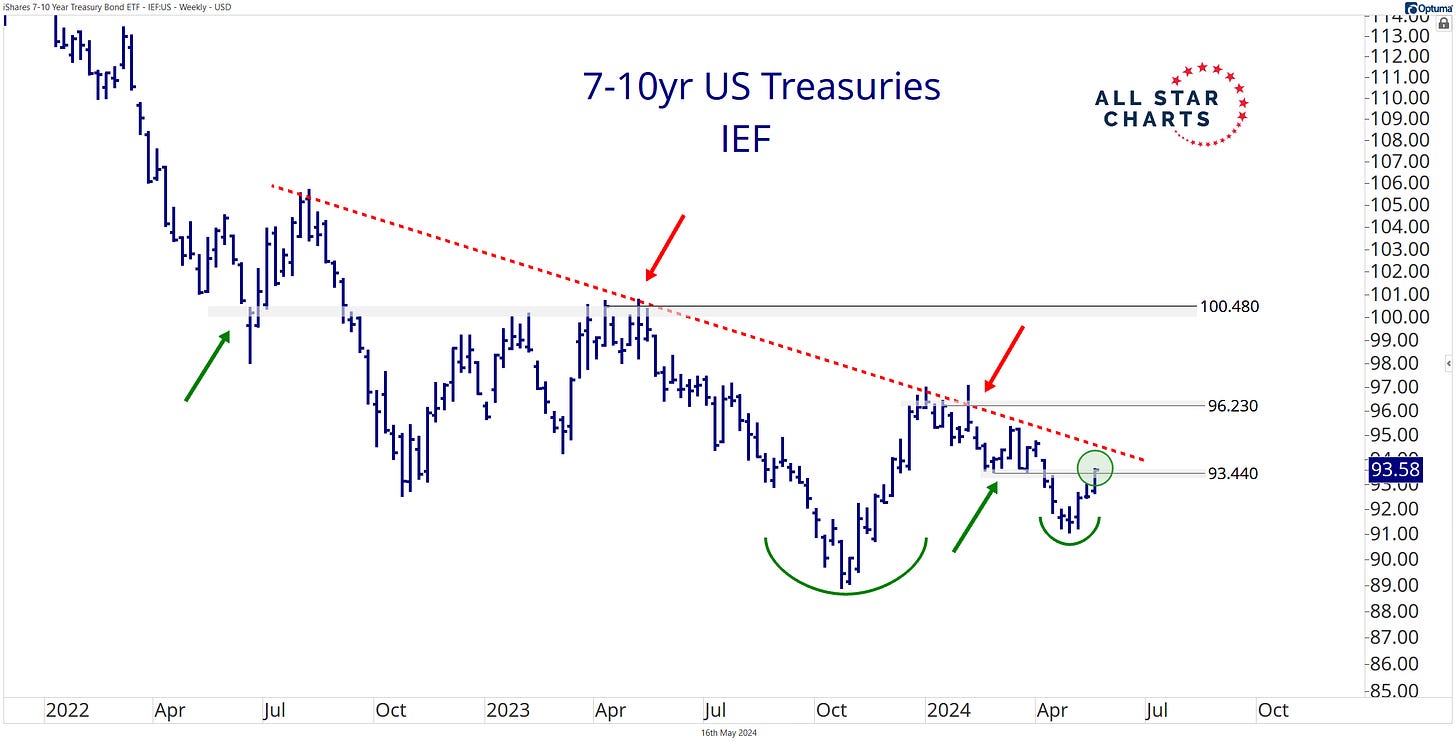
The 93.40 level marks our line in the sand for the T-note ETF $IEF:
IEF also triggered a buy signal yesterday with an initial target of 96.25 and a secondary objective of 100.
Next up is perhaps my favorite chart today: 5-year T-note futures:
The 5-year offers the cleanest level with the most price memory to trade against – a critical shelf of former lows dating back to the October 2022 pivot low.
I like buying the 5-year note on strength above 106’10, targeting 109’00.
But the 5-year T-note futures will likely experience a muted rally relative to longer-duration treasuries such as the 10- and 30-year futures. If you’re looking for a little juice, you might want to stick to the longer-term bonds.
Either way, these are the levels for the US Treasury ETF $IEI:
We can take a long position on a decisive close above 115.25 with an upside objective of 117.50.
Bigger picture: US Treasuries remain in a structural downtrend.
But with interest rates falling and well-defined levels to trade against, you could catch a bond market bounce.
Are you taking a swing at Treasuries?
Bespoke: Dow 40k
… Back in 1999 when the Dow Jones Industrial Average was still trading around the 10,000 level, author David Elias published the book titled Dow 40,000, saying the index would hit this level by 2016. "Dow 40,000" came in the same year that "Dow 36,000" was published by James Glassman and Kevin Hassett, who said the index would reach 36k by 2002-2004.
The timing of the two books couldn't have been worse since the Dot Com Bubble burst shortly thereafter in early 2000, and the Global Financial Crisis of 2007-2009 made Dow 40,000 by 2016 look like a long shot.
While Elias missed Dow 40,000 by about eight years, the index has finally crossed that level today for the first time ever.
At 40,000, the Dow now needs to move +/-400 points to experience a 1% daily move. We're old enough to remember when a 100-point move in the Dow was a big deal! Now a 100-point gain for the Dow represents a measly 0.25%...
Bloomberg: Fed Officials Suggest Interest Rates Should Stay High for Longer
Mester, Williams and Barkin say taking longer to cool prices
More data needed to be confident inflation is headed to 2%
… Barkin, speaking Thursday on CNBC, said demand needs to cool further to get price growth to the Fed’s goal, noting goods inflation has come down significantly as supply chains have healed.
“To get to 2% sustainably in the right kind of way, I just think it’s going to take a little bit more time,” said Barkin, who also votes on policy decisions this year.
Data released Wednesday showed a measure of underlying US inflation ebbed in April for the first time in six months, providing some progress in the direction Fed officials would like to see before reducing rates. The core consumer price index, which excludes food and energy costs, rose 0.3% from March after three months of greater-than-expected readings, Bureau of Labor Statistics figures showed.
Bloomberg The Weekly Fix: Pivot party’s second wind fires up bond bulls
Ready, Aim, Cut!
US inflation and retail sales readings did little to shake bond investors faith that interest-rate reductions are on their way for just about every major developed economy outside Japan. The Bloomberg Global Aggregate index of bonds is up 2% in May, heading for its best month in a wretched and volatile 2024.
While Federal Reserve Chair Jerome Powell tried to emphasize interest rates will stay higher for longer, investors just aren’t buying it. Markets are now pricing in two full Fed easings this year after data showed US inflation ebbing for the first time in six months.
Emily Roland of John Hancock Investment Management thinks we are in something like a Powell Pivot 2.0, with the Fed looking to cut rates before growth slows too much. “I believe we’re still in the pivot party, and Chairman Powell’s been the lead bartender,” Roland said. “He has just not deviated from that dovish message.”
Nordea Macro & Markets: Careful cuts
Rate cut expectations have been on the increase again lately. We think that longer out the market is pricing in too much easing from the Fed and too little from the ECB. Also history strongly supports the latter.
… After three consecutive upside surprises in US core CPI, a reading in line with expectations for April was enough to give more fuel to the bond rally that has been seen in the past few weeks. However, the momentum in core CPI components still looks too high for the Fed’s liking, and we have actually postponed the first Fed cut to December in our baseline, followed by two 25bp cuts next year. This is later than the current market pricing of around 20bp of rate cuts by the September meeting and almost two full 25bp cuts by the end of the year…
… US CPI data imply the Fed will have to wait with its rate cuts
… THAT is all for now. Off to the day job…


