while WE slept: USTs slightly underperforming Bunds/Gilts; "Wall Street’s Big Bond Bet Revives Before Pivotal Inflation Data" (Citi, JPM and TD targets)
Good morning … France (AND USA)in limbo, JPOW to testify, bank earnings, inflation figures and UST supply coming …
Bloomberg: France in Turmoil After Left Thwarts Le Pen Victory CNBC: Democratic power players are circulating a proposal for Biden to exit, launch ‘blitz primary’ Yahoo: Inflation data, Powell speaks, and big banks report earnings: What to know this week TreasuryDIRECT: Upcoming auctions ($58bb 3s, $39bb 10s and $22bb bonds)
… all this SHOULD help us rip the bandaid off and start planning our trades so as we can TRADE our plans in to the week ahead!!
BUT … It’s Monday in midst of a heat wave here, there and most likely everywhere SO one might not be blamed for moving slower than normal and enjoying some time away from markets.
For those still interested in trying to ‘game’ Friday’s NFP, the CONsensus once again putting more weight in REVISIONS and so, pricing in MORE COWBELL. See just below for notes / visuals on 50bps of cuts in 2024 (AND a read through of how / why JULY may be LIVE).
That in mind, 2yy look overBOUGHT on both daily and weekly charts (noted HERE) and with supply on the way starting tomorrow, a look at a part of the curve NOT up for sale …
7yy: momentum (stochastics) on verge of BEARISH cross and so, time at a price OR a tick HIGHER, needed to resolve … TLINE support then (4.30%) in to clear focus
… one might think a safe haven on the curve as it is NOT up for sale this week.
… And so with that, we’re off to what appears to be an excellent week ahead while today may very well just be a calm before the storm … here is a snapshot OF USTs as of 700a:
… and for some MORE of the news you might be able to use…
NEWSQUAWK: US Market Open: European equities shrug off initial French-induced weakness, DXY flat & Crude at lows … Bonds are incrementally softer, with USTs underperforming; OATs initially gapped lower but now towards session highs … USTs are slightly underperforming Bunds/Gilts but only modestly so. US enters a particularly busy week with dual-testimony from Powell and then CPI headlining. Treasuries are pressured by around 7 ticks to a 110-11+ base, but remains in relative proximity to Friday's 110-20 peak.
Finviz (for everything else I might have overlooked …)
Moving from some of the news to some of THE VIEWS you might be able to use… here’s SOME of what Global Wall St is sayin’ …
BNP: Sunday Tea with BNPP: Not too hot, not too cold
KEY MESSAGES
A solid US payrolls report with a deceleration in wages supports gradual progress on inflation. We expect core June CPI (11 July) to rise by 0.2% m/m, further supporting the disinflationary trend.
The UK election result may usher in a period of GBP-positive political stability. Idiosyncratic risk premium may keep OAT spreads wider than pre-election in France.
The prospect of less event risk over the next few weeks may support carry strategies again. We like long USDCHF and long INR vs CNH through options.
DB: Early Morning Reid - Macro Strategy (a look ahead as well as NFP recap / victory lap of the MIXED NFP report)
…Moving on, there’s a lot to digest this week with the US CPI report (Thursday) and Fed Chair Powell's testimonies to the Senate and House committees (Tuesday and Wednesday) the obvious highlights alongside PPI and the start of US Q2 earnings season on Friday with JP Morgan, Citi and Wells Fargo reporting.
Outside of these the day by day highlights are NY Fed 1-yr inflation expectations today, tomorrow’s US small business optimism survey to see if the “K” shaped recovery continues. Wednesday sees China’s CPI and PPI, Japan’s PPI, Norwegian and Danish CPI, Italian IP and a US 10yr Treasury auction. Thursday sees the latest US monthly budget numbers alongside jobless claims which will continue to get close attention given recent mixed signals on the US labour market. There is also a 30yr Treasury auction. On Friday the University of Michigan survey and Swedish CPI will be the highlight outside of the main events mentioned above. In geopolitics, there is a NATO summit Tuesday through Thursday, and Indian PM Modi visits Russia today and tomorrow both of which may generate headlines. The full week ahead is at the end as usual.
Let's now preview the US CPI and PPI releases and review a mixed payroll print on Friday. The headline CPI should print soft (+0.09% MoM DB forecast vs. +0.01% previously) thanks to falling gas prices. However core is expected to edge up (+0.25% MoM vs. +0.16%). If our economists are correct, YoY headline CPI will fall by two-tenths to 3.1%, with core edging up a tenth to 3.5%. However three-month annualised core would fall four tenth to 2.9%, though the six-month annualised rate would stay at 3.7%. For the PPI we always look at the categories feeding into core PCE, namely health care services, airfares and portfolio management. The final of these three should be firm given the recent rally in equities and airfares could bounce back after a weak May. This also could be the end of easy comps as our econ team point out that weak July and August prints will soon roll out of the YoY numbers.
This is important as if markets do want a September cut then a bit more progress is needed on inflation absent an “unexpected weakening” (in Powell’s words) in the employment situation.
With that in mind it’s useful to review a mixed employment report on Friday. Payrolls at +206k were decent but the last 2 months of revisions were -111k and private payrolls only expanded at +136k. Unemployment edged up a tenth to 4.1% and is now 0.7pp above its cyclical lows. This hasn’t yet triggered the Sahm rule of a recession always occurring after unemployment rises 0.5pp from its lows, as the rule deals in 3 month moving averages. However at 0.43pp it is now close.
Where this time could be slightly different for the Sahm rule, or at least require a higher trigger, is that the participation rate continues to improve. On Friday for example, the prime-age (25-54 age group) participation rate hit 83.7%, its highest since 2001. Also new entrants to the labour force was the highest since 2017. So as unemployment rises go (and it was a soft 4.1% given the 2 decimal print was 4.05%) it was a decent one…
MS: Global Economic Briefing: China's Deflationary Spillovers (hey, good news!!)
Deflation in China is spilling over into the US and euro area via the goods channel. While the effects on core inflation remain small, they bolster the case for monetary policy easing. Spillover effects are stronger in core goods, notably the apparel sector.
ey takeaways
China is in deflation, and policy measures are only adding to excess capacity. China’s dominance in goods exports means that it is exporting deflation.
The spillover is reducing US and euro area core inflation by about 0.1pp as it lowers core goods inflation around 0.5pp, on our estimates.
While the overall effects are modest, they should give the Fed and the ECB more room to cut this year.
Falling goods prices have micro implications, most significantly for the US apparel sector.
With China's deflationary impulse, we estimate the apparel component of US CPI declines by 0.3pp.
MS: Sunday Start | What's Next in Global Macro: Labour at Dawn
Elections in the United Kingdom have delivered the first change in government in 14 years and the second-largest majority for any party since 1945. It's a big change in a country whose markets trade at a historically large discount…
… And from Global Wall Street inbox TO the WWW,
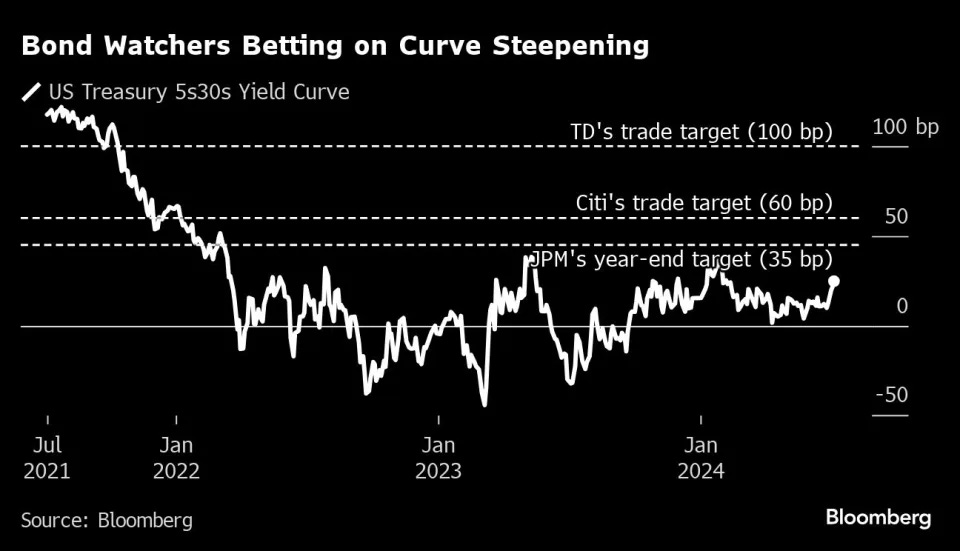
Bloomberg: Wall Street’s Big Bond Bet Revives Before Pivotal Inflation Data (everyone continues to love the steepener…)
Focus turns to consumer prices to confirm bets on rate cuts
The bond trade that some of Wall Street’s biggest banks say will dominate the rest of 2024 is gaining steam before a crucial inflation reading that will help seal the wager’s fate.
The bet — that the US yield curve will normalize toward a steeper slope — is suddenly looking as good as it has in months.
It got an initial boost after President Joe Biden’s June 27 debate performance appeared to ease Donald Trump’s path to retake the White House. In its aftermath, strategists at banks including Citigroup Inc., JPMorgan Chase & Co. and Morgan Stanley have touted the so-called Trump trade. The idea is that the Republican’s policies on tariffs, immigration and deficits will lead investors to demand higher yields on longer-maturity Treasuries.
The next leg up in the trade came Friday, when fresh signs of a softening job market bolstered expectations that the Federal Reserve will cut interest rates this year, spurring a sharp drop in short-dated yields. One closely watched measure of the yield curve — the gap between 5- and 30-year yields — reached the widest since February after the data.
Easing by the central bank is seen as the steepener bet’s principal driver, which heightens the focus on inflation readings ahead this week. Consumer prices likely rose at the slowest annual pace since January, a Bloomberg survey shows. Evidence of further disinflation may remove a major obstacle to the steepener’s success: Fed officials have been signaling that they’re not ready to lower rates.
“The steepening because of inflation, because of fiscal policy, can continue,” said Cindy Beaulieu, chief investment officer for North America at Conning.
The trade was a market favorite around the turn of the year as well, as investors entered 2024 betting on a series of Fed rate cuts. Instead, a resilient economy and sticky inflation derailed wagers on easing. When the US bond market closed on June 27 hours before the debate, the difference between 5- and 30-year yields was about 5 basis points narrower relative to the end of the year. The trade, in other words, was a loser…
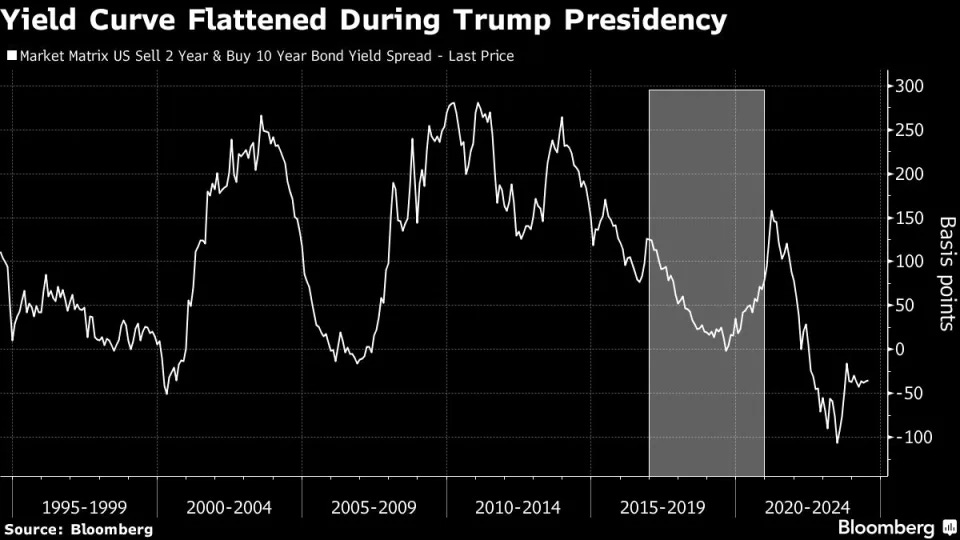
…Strategist Bill Zu points out that when Trump initiated the trade war with China during his presidency, yields declined and the curve flattened as tariffs weighed on productivity and growth. In addition, the relatively small difference in the outlook for US deficits under the two candidates’ policies suggests that any supply-driven yield repricing based on the election should be “modest at best,” he said.
On the other end of the spectrum, strategists at TD Securities anticipate that the spread between 5- and 30-year yields will eventually quadruple from now, to 100 basis points. Fed cuts are integral to that call, which the bank has held since last year. But so is the threat of high deficits no matter which party prevails in November, TD’s Gennadiy Goldberg and his team wrote late last month.
Greg Wilensky, head of US fixed income at Janus Henderson Investors, said he’s “moderately” positioned for a steeper curve by being overweight the five-year part of the curve and underweight longer maturities. The state of the economy will be the main trigger for the strategy, rather than politics, he said.
“The data that we’re going to see is going to, hopefully, increase the probability that a soft landing can be achieved, and the Fed can start cutting rates,” he said. “That’ll be good for steepeners.”
Bloomberg: Tout Ça... Pour Ça? France Stops Le Pen at a Cost (Authers’ OpED with some SAHMRULE and rate CUT pricing charts)
How a tale of two 33% election scores played out very differently on opposite sides of the Channel.
… However, when unemployment rises, it tends to be little by little until reaching a tipping point, then shoots up and causes a recession. The Sahm Indicator, named for Bloomberg Opinion colleague Claudia Sahm, holds that when the three-month moving average of the unemployment rate is 0.5 percentage points or more above its lowest level for the preceding 12 months, a recession has started, even if it’s not yet apparent. Back-testing the indicator shows that it’s very powerful.
The good news is that the Sahm Indicator doesn’t say that the US economy is lapsing into a recession. The bad news is that it does show the economy closer to the recessionary tipping point than ever before during this cycle:
This is a sign that the Fed’s tighter money is beginning to work in slowing the labor market, but also a growing danger that money will prove to have been too tight for too long. The Fed has a dual mandate and is expected to aim for full employment as well as low inflation. Even a relatively gentle rise in the unemployment rate gives a strong reason to cut rates. And indeed, fed funds futures moved Friday to price in two full cuts of 25 basis points by year-end. Traders are as confident of such an outcome as they have been at any time in the last three months:
Why hasn’t the market moved more aggressively? There’s congressional testimony to come from Fed Chair Jerome Powell this week, followed Thursday by inflation numbers for June. It was the March CPI data that convinced traders that two cuts were the absolute maximum they could hope for this year. At that point, disinflation appeared to have ground to a halt. Subsequent data have showed it’s continuing, but painfully slowly. Traders are reluctant to bet more confidently on three or more rate cuts. Some moderate, caveated words from Powell, and a further reduction in inflation, could change that. If so, it will more than counteract the scary revolutionary vibes coming out of France.
DATATREK: Jobs Report, Currencies, Fed Funds Futures (on that there last note and how rate CUTS priced back in thanks, in part, to the jobs report)
… Topic #3: The current odds for various Fed Funds rates at the end of this year and how they changed this week. The following chart, courtesy of the CME FedWatch Tool (link below), shows the probabilities for 1 – 4 rate cuts over the balance of 2024 along with our notations in red/green for how these have changed over the last week.
Takeaway: Futures now put 75 percent odds on the Fed cutting rates by 50 to 100 basis points (2 to 4 cuts) over the rest of the year. Today’s Jobs Report shifted those odds by 12 points, from 63 percent. Fed Chair Powell will weigh in with his views on Tuesday and Wednesday during his regular twice a year testimony to Congress. This being an election year, rising unemployment (as noted in Point #1) will no doubt be a popular topic during the Q&A sessions. That will likely result in a dovish tilt to Powell’s comments and support what markets already believe will be the future path of US monetary policy.
EPB Research: Employment Concerns (Chart Of The Week)
The Employment Situation Report for June showed that the unemployment rate increased to a rounded 4.1% — more than consensus expectations.
While total nonfarm payrolls showed a gain of more than 200,000, job gains for April and May were revised down harshly by 111,000.
The steady streak of negative revisions, particularly to the extent that we've seen over the past 12 months, is generally reserved for recessionary or pre-recessionary periods.
The market rightly expressed concern about the most recent job numbers, with the odds of interest rate cuts from the Federal Reserve increasing rather sharply after the report.
The monthly Employment Situation report includes many different measures of the labor market, and sometimes, they can give slightly different impressions of its health.
This is normal as each measure has a slightly different measurement technique.
One single indicator is never perfect, which is why, at EPB Research, we use a basket or composite indicator approach to measure all different sectors of the economy.
Should we focus on the monthly nonfarm payroll figures? What about the household survey? Should we ignore the unemployment rate?
All these measures are perfectly valid and should hold equal weight in an overall analysis of the labor market.
At EPB Research, we use a “Coincident Employment Index,” which aggregates a composite of five critical labor market measures, including nonfarm payrolls, the household employment level, and the unemployment rate, to arrive at a comprehensive and unbiased reading of the labor market situation.
After the June Employment Situation report, the EPB Coincident Employment Index declined to a growth rate of 0.2%, the lowest of this economic cycle.
Further, the Coincident Employment Index has never registered a sustained negative reading without the economy being in a recession since contractions in the labor market and recessions are virtually synonymous …
ZH: Building The Case For Rate Cuts (July? Yep … at least some think maybe) By Peter Tchir of Academy Securities
… No Cut in July? We have argued, quite aggressively, that the Fed should make their first cut in July. Partly, because the economic data supports it (more on that in a minute), but it also takes the spotlight off of the Fed in the heat of the election.
Regardless of whatever else we have learned about this election in the past few weeks, it has confirmed our view that much of it will be fought on social media. We’ve also learned or confirmed (depending on your starting point) that there are very few topics that are “off-limits” in our current election cycle.
I physically wince at the thought of the first cut in September, stocks soaring 5%, and literally all hell breaking loose on social media as it is portrayed as helping the incumbents. It does not matter if that is true or not, social media is far more about “creating a good narrative and running with it” than with the truth. While I cannot confirm that there are more senior politicians discussing the Fed and talking about their mandate, or it is just a function of today’s media, but it seems like it.
The data could easily justify a July cut, and from a political standpoint, it makes sense, but there does seem to be a risk that after getting “transitory” quite wrong, they are going to be overly cautious on cutting…
…Bottom Line We didn’t even touch on lag effects (even Powell seemed to admit that because of this they should start sooner rather than later).
Continue to look for 75 bps of cuts this year (with 2 or 3 cuts). I don’t see July as likely, though I think it would be prudent to start then.
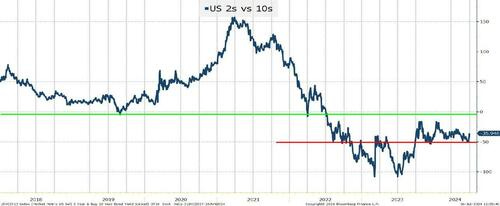
Less inverted curves.
-50 seems to be a level of support. 0 would be the next target, which would be 33 bps from here. “Less inversion” is why we think the 10s are still generally rangebound between 4.3% and 4.5% (with occasional breaks above and below).
Credit. All good. We should see new multi-year tights on spreads by the end of the summer.
Equities. Momentum and AI are ruling the day, and it is unclear what stops them. At least the CNN Fear & Greed Index climbed to Neutral. I’m really not sure that we’ve seen a situation where major indices are hitting new highs, and this index is mired in “Fear” territory.
Hope you have had a great 4th of July extra-long weekend (and enjoyed what seemed like 2 Fridays in one week), but now back to the grind!


Great work !!!
Excellent as usual, Happy Heat Wave America!