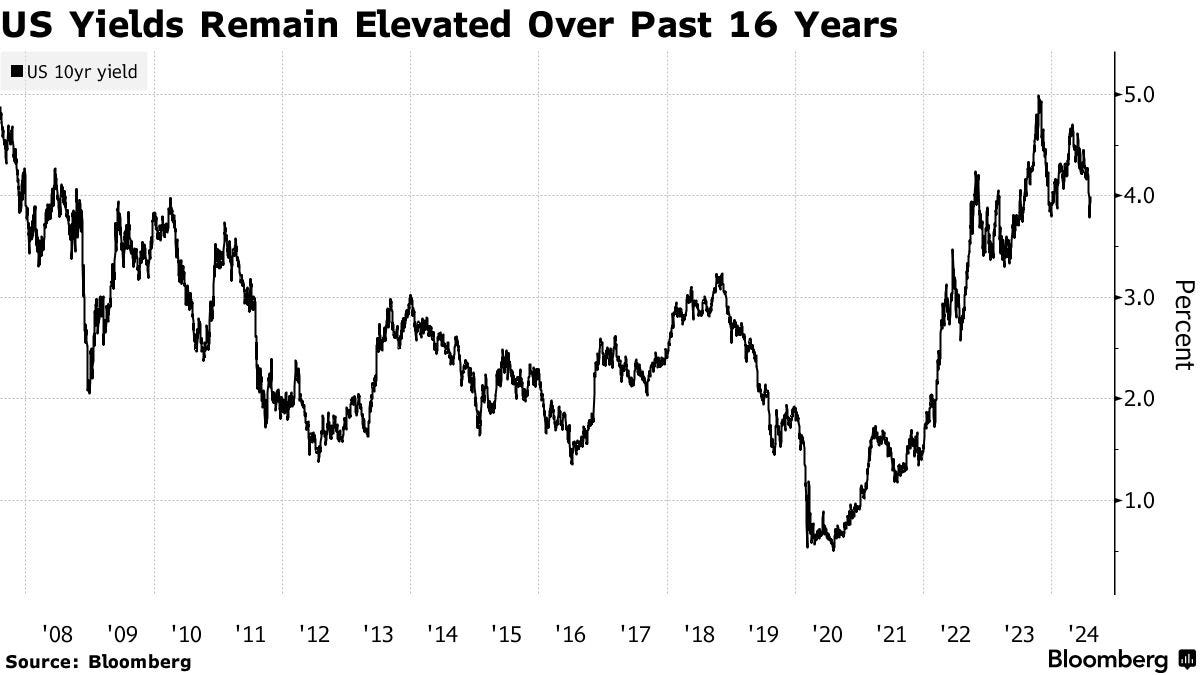
while WE slept: USTs recovering; "a 4% 10 year yield, even in a 2.5% inflation environment still represents pretty good value long term versus equities or cash.” -PIMCOs Ivascyn
Good morning … Happy GFC-a-versary … I recall on this morning being in the hospital as my partner in prior career (my dad) was having one of his kidney’s removed. I was in waiting room with a sparse wifi connected laptop trying to watch over markets via Bloomberg terminal — doesn’t sound too tough an exercise but all the way ‘back then’, wifi wasn’t what it is nowadays so, believe it or not (my kids will not), I was pretty technologically advanced (or so I thought) … THEN when the news broke, money markets went haywire, I was reminded of where I was when docs came out with update on pops being in recovery, all went well, etc … and my panic then resumed as I was (impatiently)waiting to see him as today, back in 2007 …
RTRS: BNP freezes $2.2 bln of funds over subprime
… BNP Paribas, the eurozone's second biggest bank by market capitalisation, said the subprime crisis was preventing it from calculating the value of the asset-backed securities funds and barred investors from redeeming cash from them.
"The complete evaporation of liquidity in certain market segments of the U.S. securitisation market has made it impossible to value certain assets fairly, regardless of their quality or credit rating," it said in a statement.
"In order to protect the interests and ensure the equal treatment of our investors during these exceptional times, BNP Paribas Investment Partners has decided to temporarily suspend the calculation of the net asset value as well as subscriptions/redemptions, in strict compliance with regulations, for these funds," it added.
BNP Paribas said the three funds had declined rapidly in value in the past few weeks to 1.593 billion euros at August 7, down from 2.075 billion at July 27. The bank has 326 billion euros under management…
… That was then and this is NOW …
ICI: Money Market Fund Assets
Washington, DC; August 8, 2024—Total money market fund assets1 increased by $52.69 billion to $6.19 trillion for the week ended Wednesday, August 7, the Investment Company Institute reported today. Among taxable money market funds, government funds2 increased by $51.67 billion and prime funds increased by $551 million. Tax-exempt money market funds increased by $468 million.
… that in mind, best I can do now, without a Terminal (for more realtime fun-lookin visuals …
FRED: Retail Money Market Funds (WRMFNS)
Updated: Jul 23, 2024 12:03 PM CDT
… AND I’ll move along. Feel free to send in something from Terminal if you wish.
Meanwhile, funny thing happened on way TO yesterday’s long bond auction … CLAIMS bounced OR they dropped …
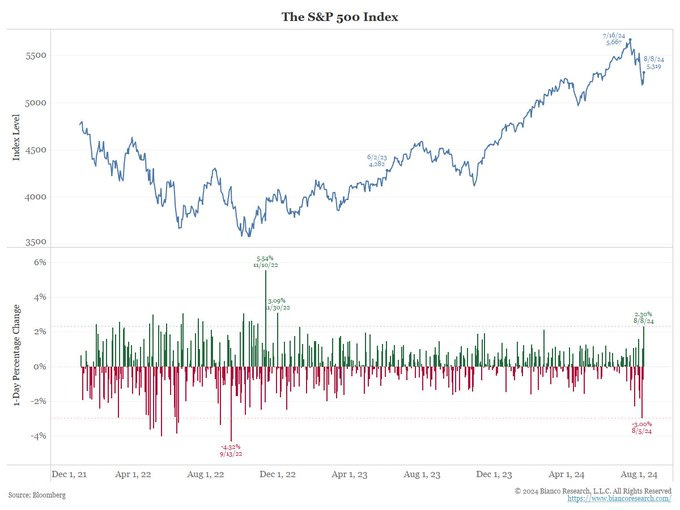
WSJ: S&P 500 Jumps 2.3% in Best Day Since 2022
Easing growth fears fuel a stock rebound; Dow adds nearly 700 points… U.S. stock futures and Treasury yields rose immediately after the release of data showing initial jobless claims, a proxy for layoffs, were 233,000 during the week ended Aug. 3, down from the prior week’s recent high of 250,000. That helped alleviate some of the concern about a U.S. labor-market slowdown that rattled markets after last week’s weaker-than-expected jobs report…
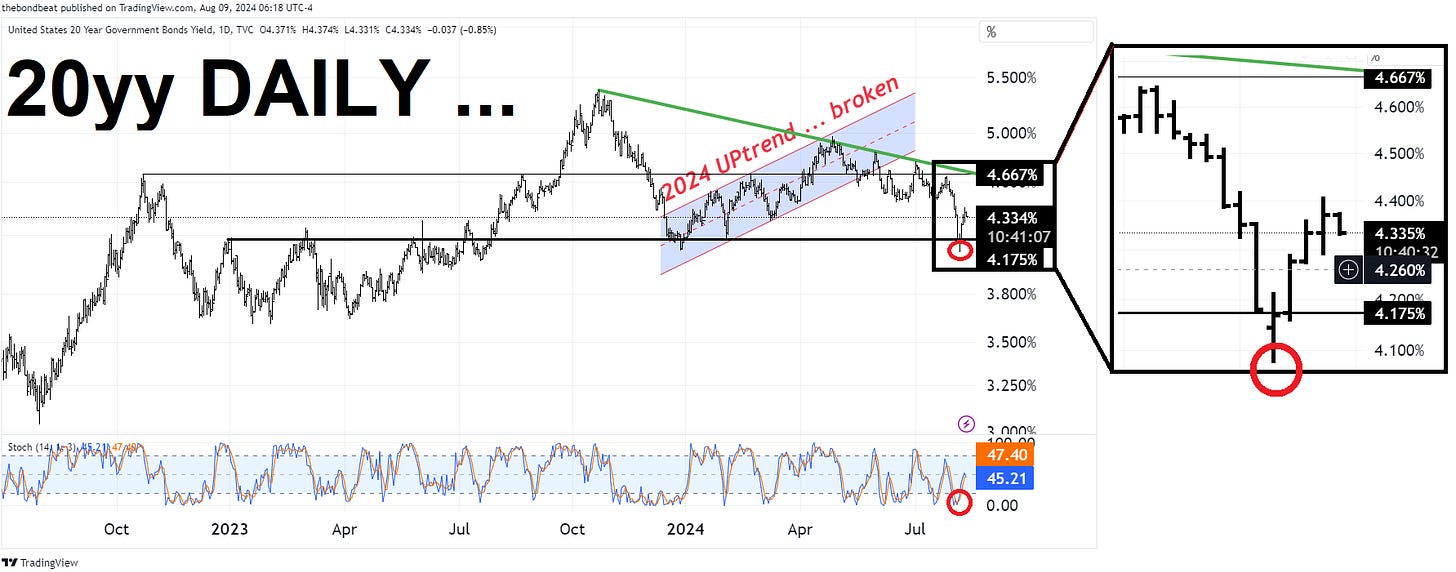
…somewhat (more in a sec) but as far as how ALL the data dust settled and translated TO / thru interest rates … here’s a look at 20yy — yields bounced YEST along with all the other benchmarks AND yields are a touch LOWER today, also in line with other benchmarks this morning — because, you know, you can’t have too many diamonds and in that this one may / may NOT be going away soon … well …
20yy DAILY: momentum moved from extremely overBOUGHT to about mid-range
… the move higher by about 30bps with momentum now NOT signalling anything leaves YOU to flip the coin as you plan your trades and trade your plans … more perhaps WEEKLY visuals in search of signals over the weekend but 4.175% seems important level to watch …
… and so, the concession continued in to 1pm producing …
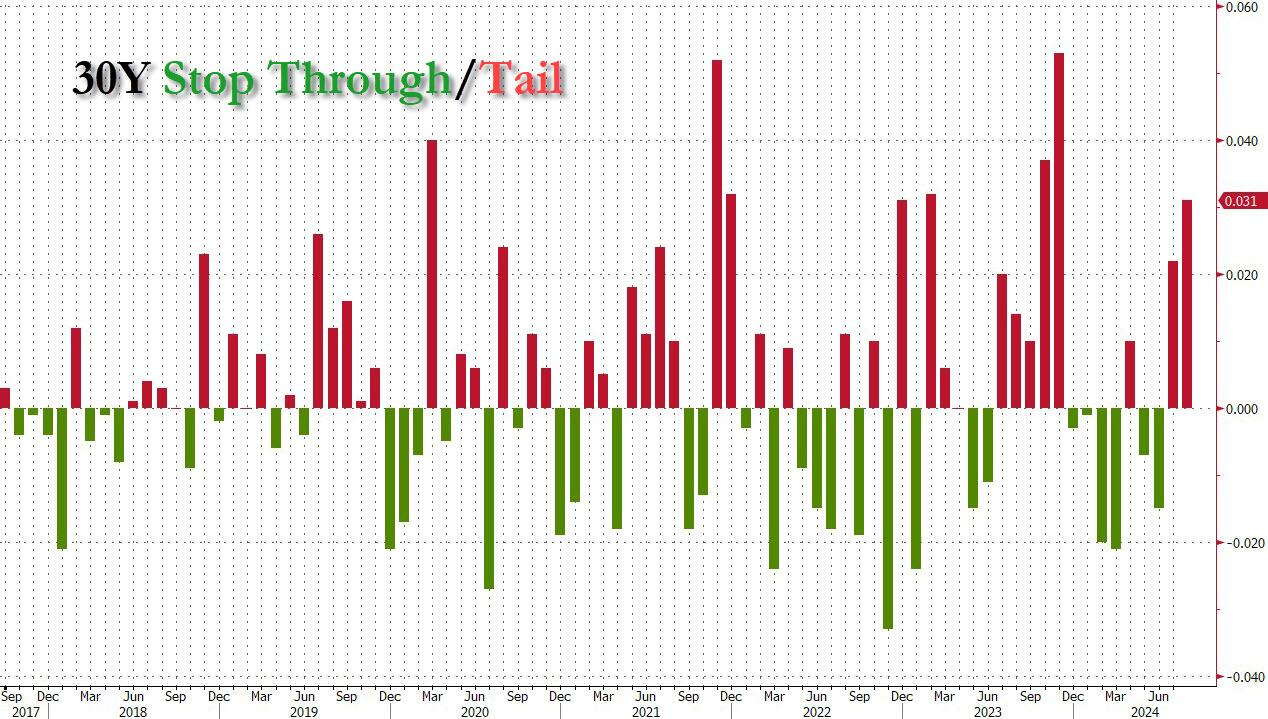
ZH: Ugly 30Y Auction Has Biggest Tail Since November
… Stopping at a high yield of 4.314%, today's sale of $25 billion in 30Y paper saw the lowest yield since January's 4.229% and was down sharply from the 4.405% in July. And, like last month, today's auction tailed and by a substantial amount: with the When Issued trading at 4.283%, this was the biggest tail since November.
… Overall, this was another ugly auction, with the one redeeming quality perhaps being that yields have tumbled in recent days, which is why buyers in the second market were few and far between, and are merely waiting for bond prices to retrace some more of their recent gains before they step in.
… this concession continued through end of day and some out there have been saying the concession was inspired BY claims which dropped OR …
ZH: Continuing Jobless Claims Surge To 33-Month Highs
… The non-seasonally-adjusted claims data also plunged as it appears the Texas storm impact is fading...
… But, continuing jobless claims rose to 1.875mm Americans - the highest since Nov 2021...
...and smoothing for the week to week noise - the 4-week moving average of initial claims also reached a new cycle high.
One key thing to note that we warned about...
Is this bad news or good news?
… so as you can see, it truly depends on your PnL how YOU interpret the data and as you continue to take the markets ink blot test and translate results through to your portfolio with various longs and / or shorts, I thought I’d pause a moment for some Danielle DiMartino Booth clarity …
Adam Taggart: Thoughtful Money: Danielle DiMartino Booth: Recession? We Ain't Seen Nothin' Yet!!
The cruel math says things are going to get worse from hereThe Sahm Rule (aka McKelvey Rule), a widely-monitored recession indicator, triggered on Friday.
Some analysts are arguing that it's too early to worry about a slowdown, that the economy is too strong currently.
Others warn the US may already BE in recession.
So, which is it?
For answers, we're fortunate to speak today with Danielle DiMartino Booth, CEO & Chief Strategist for QI Research LLC and author of the book Fed Up: An Insider's Take on Why the Federal Reserve is Bad for America.
Danielle tracks the labor market very closely as a bellwether for recession, and her warning is: “We ain’t seen nothin’ yet!”
To find out why, click here or on the video below:
… Grateful to have caught this link which is a video taped just a couple days ago … Take the hour and listen TO some words of wisdom … maybe a couple times. THEN choose up a side … Team Rate CUT or something else … I hope this helps and you can thank me later.
I’m going to continue along but first … here is a snapshot OF USTs as of 641a:
… and for some MORE of the news you might be able to use…
IGMs Press Picks: August 09 2024
NEWSQUAWK: US Market Open: Generally contained trade with macro drivers light, CAD jobs ahead … Fixed bid but in familiar territory, USTs have recovered from supply-induced pressure on Thursday … USTs firmer and just shy of the 113-00 handle having picked up from a 112-17+ base after a particularly poor 30yr tap last night.
Reuters Morning Bid: Ebbing jobs fear sees calmer market waters
Finviz (for everything else I might have overlooked …)
Moving from some of the news to some of THE VIEWS you might be able to use… here’s SOME of what Global Wall St is sayin’ … one part CLAIMS another part just global macro and stuff…
BARCAP: Initial claims see more normalization
Initial jobless claims declined last week, driven in part by outsized drops in Michigan and Texas. Last week's reading of 233k was 17k below where the index stood in the prior week. NSA data continue to return towards historical trends, now showing levels below that of one year ago.
BARCAP: US CPI Inflation Preview (July 2024 CPI): Core CPI expected to have firmed in July
We look for firming in July core CPI inflation to 0.21% m/m SA, from an unusually soft 0.06% reading in June. We expect a payback in shelter inflation and less deflation in core goods to drive this acceleration. For headline CPI, we look for a 0.21% m/m SA increase and expect the NSA index to print at 314.817.
BARCAP U.S. Equity Strategy: Food for Thought: Sector Selection for Rate Reduction
Over 13 rate cutting cycles stretching back to the 1980s, Healthcare and Staples outperformed most consistently over the 6 months following the first cut, likely because most of these coincided with recessions. In the 2 "soft landing" cycles of the mid-90s, cyclical and growth sectors performed better after the first cut.
BMO: Jobless Claims Drop to 233k vs. 250k prior
Initial Jobless Claims slipped to 233k in the week of August 3rd (4-week low) vs. 250k prior and 240k consensus. The 4-week moving-average climbed to 240.75k for the highest since last August. Continuing Claims increased to 1875k vs. 1869k prior and 1871k forecasted -- the highest since November 2021. The unadjusted move in claims was +203.1k -- a 6.2% drop from the prior week. CA led filings at 41.8k with TX at number 2 with 20.2k. The drop in initial filings was larger-than-anticipated and the resulting price action suggests the update is being interpreted as evidence that the labor market remains on solid footing despite the July BLS report. Overall, the lack of information suggesting a further deterioration of the employment landscape was the most relevant takeaway from the final data release of the week…
BNP US rates: ULC pricing harder landing like last three cutting cycles
Despite optimism for the Fed achieving a soft landing, recent re-pricing in yields and the upper left corner (ULC) of the US swaption surface is more reflective of a harder landing and deeper cutting cycles seen in the 2000s.
The money market curve (2y UST – fed funds) is in line with more aggressive cutting cycles in 2001 and 2007, and ULC gamma/vega ratios are at similar levels to 2007 and 2019.
A clear return of the soft landing narrative should push ULC vols lower, but we remain cautious selling at the potential front-end of more material labor market weakness and favor 3m5y A/A-30 receiver spreads and 5s30s UST steepeners. However, investors who do favor selling the ULC may be better served by purchasing ULC payer ladders as they target higher yields and lower vols.
BNP US July CPI preview: Further easing (CPI easing = X, Fed is currently solving for X while markets have guessed the answer is 2x X or more…)
KEY MESSAGES
We expect US core CPI to extend its recent run of favorable prints with a 0.19% m/m gain in July (report released on 14 August).
We see risks as roughly balanced and pertaining to shelter, with a potential bounce-back in Western OER on the upside and a weaker-than-expected all-tenant rent index suggesting room for downside.
Our forecast translates to a preliminary July core PCE estimate of 0.16% m/m, which would lower the 3m/3m saar to 2.3% from 2.9%, bolstering the Fed’s confidence that inflation is headed back to 2% sustainably, in our view.
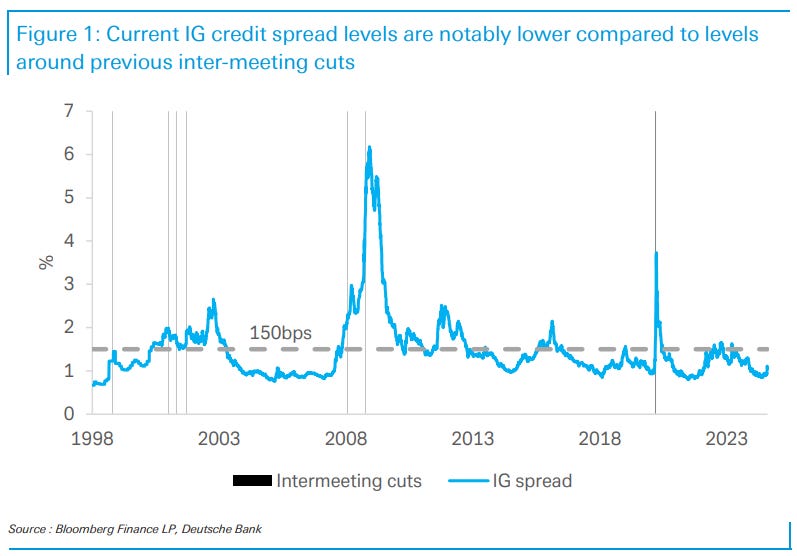
DB: How possible is an inter-meeting cut? Views from another lens (this other lens is IG CREDIT spreads — LOWER and so, the answer is not impossible but not likely, either… in other words, All is well. Remain CALM)
Following up on our comparison of the recent front-end rally to previous episodes of inter-meeting cuts, today’s chart examines the same topic through credit spreads. IG OAS (option-adjusted spreads) are notably tighter as of the time of writing compared to levels just before previous inter-meeting cuts, suggesting to us that the significant moves and volatility in markets over the past week may not be sufficient for the Fed to conduct an emergency cut based off those factors alone.
We use credit spreads as an indicator of monetary policy tightness, where a wider spread points to increased restrictiveness and systemic underlying weakness. As a measure for evaluating whether an emergency cut is necessary, credit spreads have several advantages over pricing and volatility in equity and bond markets since valuation issues can play a key part in significant pricing shifts. Equity market performance may not factor heavily into the Fed's policy decisions, as indicated by Fed President Goolsbee’s comment that “there’s nothing in the Fed’s mandate that’s about making sure the stock market is comfortable”. Furthermore, front-end yields are highly influenced by the market's expectations regarding the likelihood of an inter-meeting cut. In contrast, credit spreads provide a cleaner measure for assessing the conditions required for an inter-meeting cut.
The vertical lines in the chart show the dates of previous inter-meeting cuts. The dotted grey line is our reference level of 150bp for emergency cuts. Almost all previous inter-meeting cuts in the past 25 years have occurred during periods where credit spreads widened past this threshold. The only exception is the 1998 cut, which took place in an environment with uncertainty around lending and financial conditions created by the LTCM crisis. Since today's credit spread level is significantly below this 150bp threshold, we may need to see more pressure on credit spreads to justify an emergency cut. As mentioned in recent Fedspeak, the Fed would likely act if there was notable further deterioration in economic conditions or financial stability.
DB: Trend inflation: Trending in the right direction
The June PCE inflation readings were close to expectations; year-over-year headline PCE inflation fell 10bps to 2.51% while core PCE inflation remained almost flat at 2.63%. Updating our suite of statistical models, we find that the monthly mean estimate for trend inflation declined by 5bps to 2.7%, while the median estimate dropped by 7bps to 2.8%. These readings are down roughly 30bps this year and are now at the lowest readings since 2021 September.
Our trend inflation measure is therefore consistent with evidence that inflation is on a path towards 2%. It is also consistent with a shift in the risk distribution for the Fed, away from concerns about upside inflation risks and towards potential downside risks to the economy and labor market. We have maintained our baseline expectation the Fed will deliver a 25bp rate cut at each meeting this year despite some recent market volatility and a softer than expected jobs report (See FCI update: Stock crash just a flash in the pan for the Fed and Monthly charts: Fed hoping to take the long view as markets burn out on soft landing). That said, declining trend inflation fits with our view that the balance of risks has clearly shifted from the Fed moving more gradually to having to ease more aggressively.
DB: US Rates Chartbook - Fed Liquidity and Money Market Monitor: Repo tightness and summertime (Fed) sadness
Repo rates have shown increased firmness in recent months, with elevated demand for leverage contributing to higher rates. On dealer balance sheets, inventories of Treasuries continue to grow, adding to market tightness. Despite this, the fed funds rate has remained remarkably stable, which likely reflects that the GSEs are currently holding large amounts of liquidity and lack attractive alternative investment options. However, with triparty repo rates rising toward fed funds rates, this dynamic could soon change. We expect SOFR to continue creeping higher over the coming months, with EFFR potentially rising relative to IORB for the first time this cycle if the spread between TGCR and EFFR becomes sufficiently large enough.
While recent market turmoil has raised the likelihood of more aggressive Fed easing this year, we are sticking with our baseline outlook for QT for now. We expect QT to stop when reserve balances have fallen to around $3 trillion and ON RRP usage sustains at low levels on non-reporting dates. Against these projections, we believe the Fed could begin signaling plans early next year to wind down QT and conclude the process around the middle of the year. However, a technical adjustment for the ON RRP rate, and/or the IORB, to mitigate the upward pressure on overnight rates could be expected later this year. An important caveat: any sign of market functioning issues would likely prompt the Fed to stop QT sooner than anticipated.
… Money market funds continue to see inflows
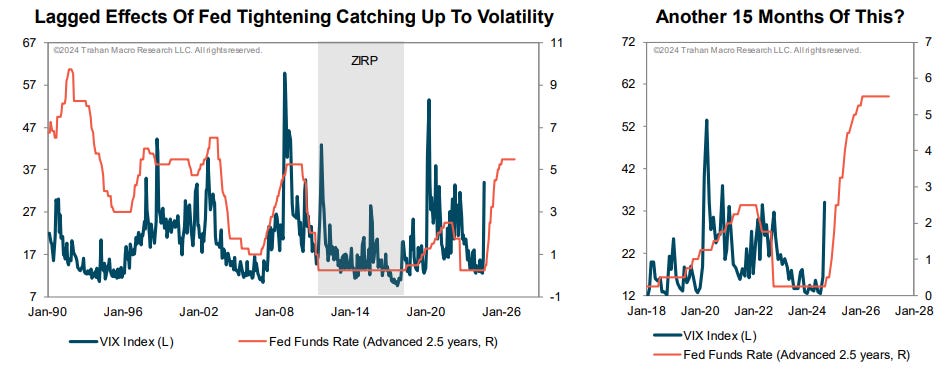
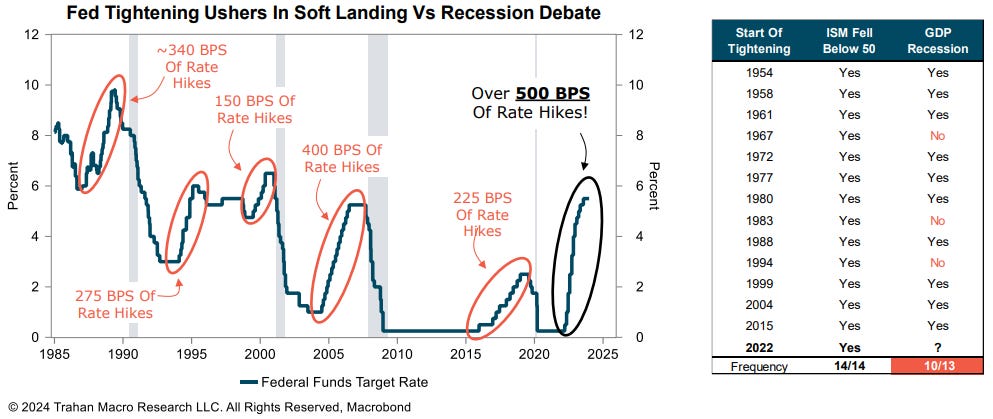
Trahan: The Early Innings Of The Recession Trade
Volatility Trends Largely Follow The Prior Path Of Monetary Policy
…Fed Tightening ALWAYS Leads To A Slower Economy
…Gauges Of Monetary Policy: Real Interest Rates
UBS: Missing demand
China’s July consumer price inflation rose a little more than expected, but this was not a signal of better demand. Excluding food prices inflation moderated, suggesting broader demand remains anemic. Food price inflation was supported by supply constraints for fresh vegetables and pork, and this sort of inflation signals potential damage to consumer spending rather than being a response to better demand.
Former US President Trump suggested that US presidents should have more of a say over monetary policy. This is another throwback to former US President Nixon. Nixon imposed a universal 10% tariff (albeit in a very different world to today’s), and strongly influenced then Federal Reserve Chair Burns. Markets seem inclined to dismiss these retro policy proposals as not being serious. If markets were to believe Trump were serious, there may be a more significant reaction.
While the Fed has its independence, several speakers were talking about labor markets and policy. The general sense was of modest cheerleading, and a reluctance to treat a single employment report too seriously…
… And from Global Wall Street inbox TO the WWW,
at BiancoResearch
*S&P 500 RISES 2.3% IN BIGGEST ONE-DAY GAIN SINCE NOVEMBER 2022
Monday was the S&P 500's biggest one-day loss since September 2022
Thursday was the S&P 500's biggest one-day gain since November 2022
Any guesses on tomorrow and into next week?
Bloomberg: Pimco’s Ivascyn Sees ‘Bumpy, Bumpy Road’ Ahead Helping Bonds
Market, economic risks make bonds a good defensive play
Fixed income is attractive versus equities at 4% US yields
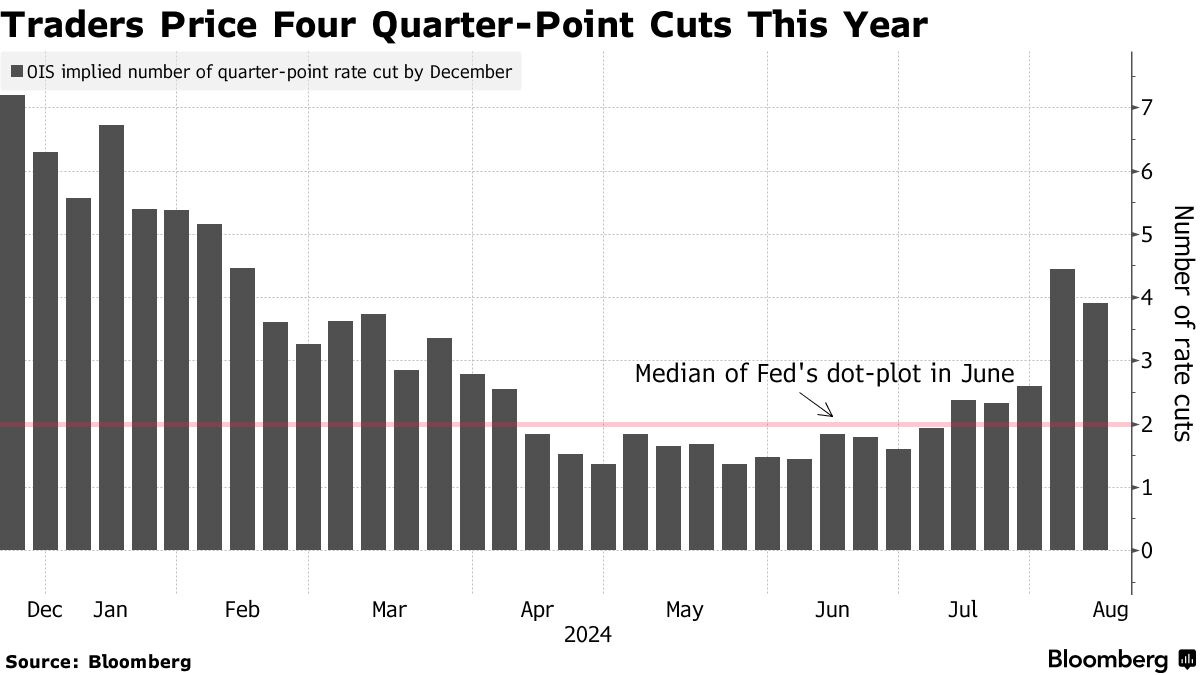
… As the dust settled Thursday, two- and 10-year Treasury yields traded back up around the 4% level while traders were still leaning toward a half-point Fed rate cut when they meet in mid-September, followed by another half-point of cuts by year-end.
Referencing the tension between central banks and markets, Ivascyn said market pricing “may be a bit too optimistic about cuts,” but the new viewpoint reflects shifting probabilities around the outlook for the economy. Where earlier this year many investors supported the notion that the Fed could achieve a soft landing with gradual rate cuts, traders now fear that the Fed may have left rates too high too long, putting a recession in play…
… The bond manager sees the possibility of equities being tested by an earnings recession or a slowing in profit growth or some challenge across sectors that bleeds into the credit markets. Under any of those scenarios, the case for owning top-tier bonds remains even after the rally of recent months, as they still look “cheap to equities and other more economically sensitive assets that are on the expensive side.”
Pimco, with $1.88 trillion in assets under management, expects “a high probability the Fed will cut in September and they probably cut a couple more times going into year end,” Ivascyn said. “If the economy or the employment picture deteriorates more and or inflation comes down at a more rapid rate, then the Fed could accelerate their cuts.”
After Treasury yields peaked above 5% last October, Pimco made a case that bond funds would become attractive to investors as inflation was seen easing and growth moderating in 2024 under the highest Fed policy rate in over two decades…
… As a bond manager with a long time horizon, Ivascyn concluded “looking at bonds over a three or five year period, they’re a little bit less attractive than they were a few months ago, but a 4% 10 year yield, even in a 2.5% inflation environment still represents pretty good value long term versus equities or cash.”
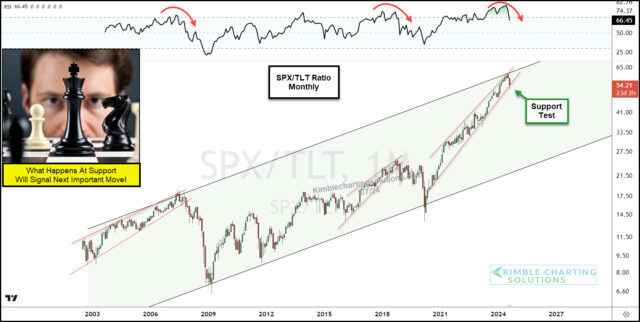
Kimble: Stock to Bond Ratio Testing Important Price Support!
It’s important for investors to follow stocks and bonds. And even more important to understand the relationship between them.
Today, we highlight the past 20-years of there relationship via the S&P 500 Index to $TLT (long-term treasury bonds ETF) price ratio.
In general, the stock market is doing well when stocks out-perform bonds (ratio heading higher) and worse when bonds are stronger (ratio heading lower)…
The chart above is a long-term “monthly” chart of this ratio. Here we can see that the Stock/Bond ratio has been in a broad up-trend for 20 years, and a very sharp and narrow up-trend for the past 4 years.
BUT, the ratio is currently testing important price support within its narrow up-trend….
and support is support until broken!
And with RSI posting its highest levels in 20 years, this support test becomes more important!
Should this ratio break down, we will likely see a deeper stock market correction. Stay tuned in the month(s) ahead!
NORDEA Macro & Markets: Just remember to breathe
Last Friday's weaker employment data sent markets into panic mode and pushed rates into recession pricing territory. We are not convinced the US economy needs large rate cuts and do not think the Fed are either.…. The market 6M fwd pricing of the Fed has constantly been too low
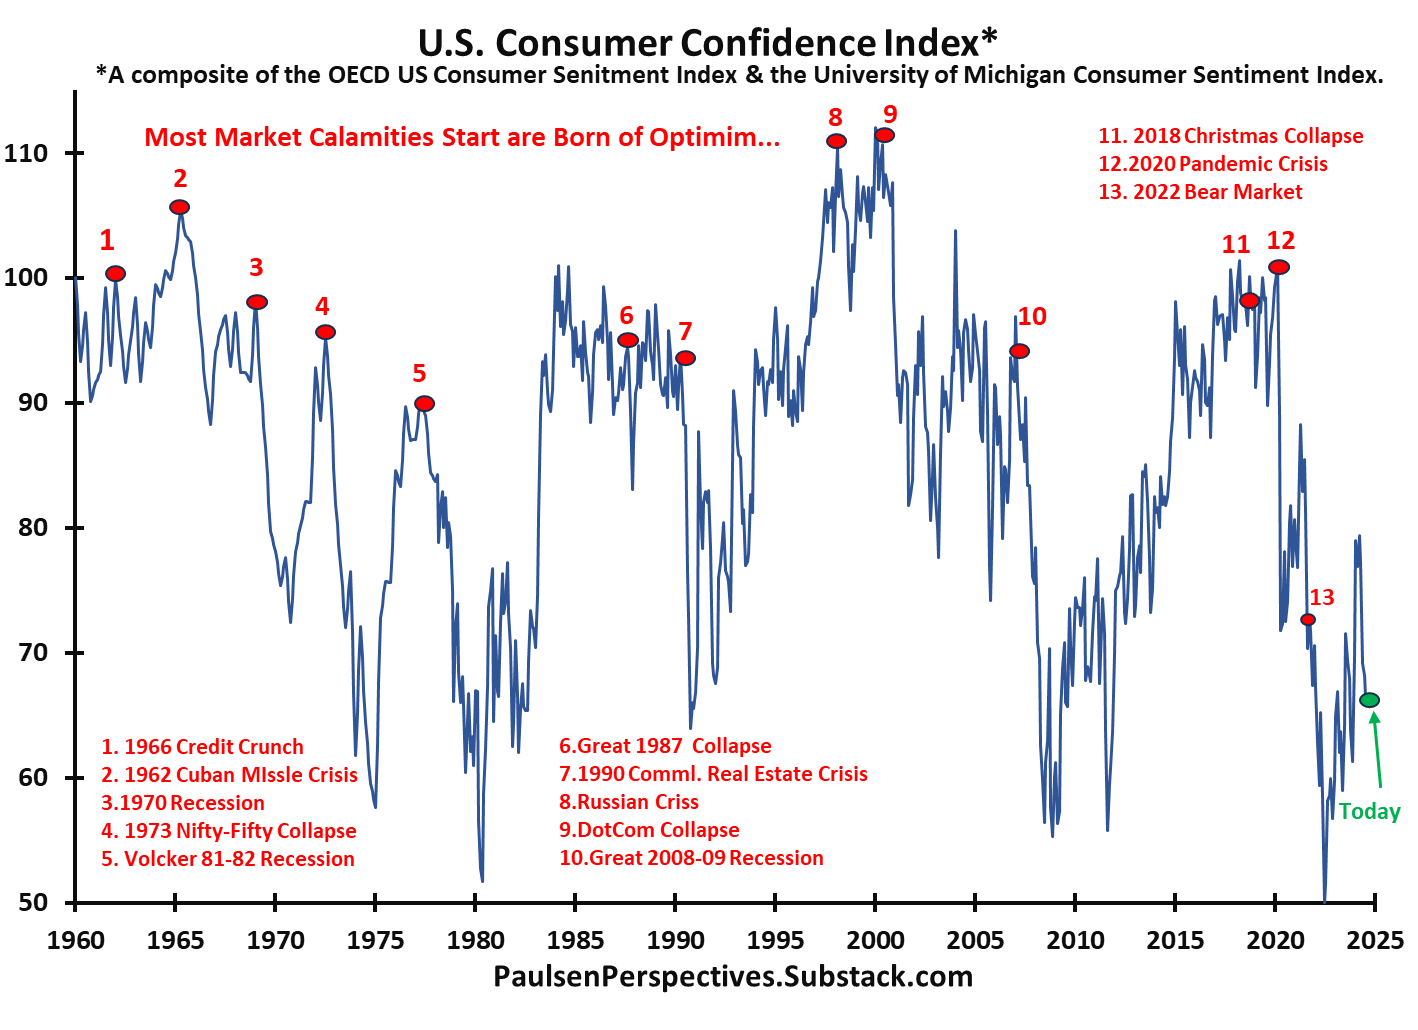
Paulsen Perspectives: Basking in the Calm Embrace of Protective Pessimism
The current level of consumer confidence is at a comparable level to where the 1975, 1980, 1982, 1990, 2009 and 2022 Bull markets all began!The stock market correction continues with sharp recovery spikes bringing hope only to be quickly crushed by late-day collapses. As is customary during market pullbacks, the CBOE market volatility index recently surged intraday to above 65 and still currently resides north of 25. Periods of market turbulence are all about fear and the contemporary market debacle is no exception. Wild market swings are a given but fears are also being augmented by a Fed mystery (will they or won’t they ease?), by a unique Presidential election season which has its own surging volatility index, by concerns about the potential for additional weak economic reports, by ongoing treacherous company earnings announcements, by a plethora of expert commentary on the risks investors face, and by after hour special financial TV shows highlighting the carnage…
… As the accompanying chart highlights, most major stock market calamities are born and fueled by over-confidence on Main Street. Typically, a Bear gains considerable fuel from crushing the hopes and often financial integrity of overly optimistic Main Street players. Today, however, because Main Street confidence has been pessimistic throughout this Bull market, the Bear can’t destroy confidence which is already near rock bottom.
This chart does not reflect investor sentiment. Investor attitudes are usually quite volatile regularly oscillating between optimism and pessimism over and over again throughout a Bull market. Indeed, this is why the stock market regularly rises and falls. Although stock market pullbacks are often initiated by optimistic investor sentiment, this isn’t what determines the severity of most stock market setbacks. How long and how deep a stock market retreat last usually is tied to Main Street confidence. Investor sentiment stock market declines are typically refreshed fairly quickly. What turns a stock market pullback into a calamity is whether it embroils Main Street activities….
… Nobody knows how long nor how deep the current correction will last. However, a number of encouraging signs already suggest it may not last much longer. In any event, regardless of how volatile this stock market remains in the next several days, I would encourage all investors to sit back – perhaps with a cold adult beverage – and bask a little in the calm embrace of protective PESSIMISM!
… THAT is all for now. Off to the day job…


