while WE sleep: bonds BID ahead of claims and auction; 100yrs of VIX (BNP); 'enter the bond vigilantes' (BBG) and "Watch The (Modified) Duncan Leading Index" (EPB)
Good morning … #GotBONDS? Want some? Maybe 20s (na, forget them, Munchkin saying he’s changed his mind … brought ‘em back and now saying they should be gone, see BBG below) … before offering ZH snark on yesterday’s 10yr and ahead of this afternoons $25bb 30yr auction …
30yy DAILY: enough of a concession as yields bounce and momentum corrects? So far we’ve got about 25bps of ‘concession’ — a bounce from lows …
… in context of visualized range (5.17 - 3.40), worth noting middle IS 4.285%
… AND NOW a quick look back at yesterday’s fUGLY liquidity event which is currently THE (scape)GOAT for Global Wall Street and the markets latest selloff …
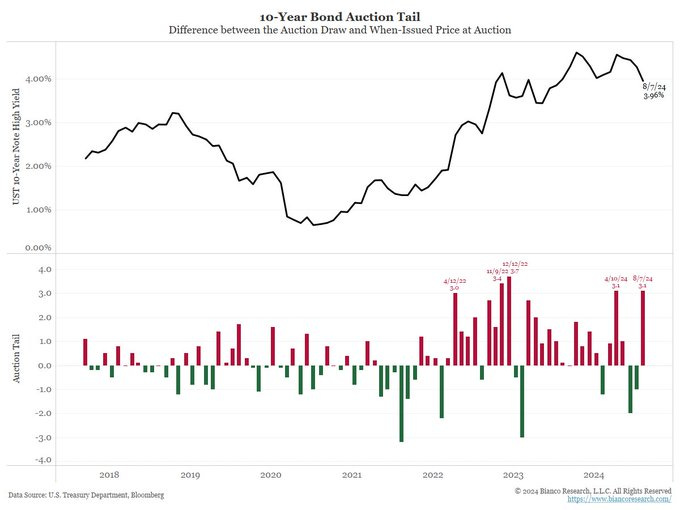
at BiancoResearch
This is a very poor auction. Today's tail tied for the third worst auction over the seven years of data shown below (red bars, bottom panel).
—
* Draw = The yield the 10-year notes were auctioned off
* PRE-SALE WHEN-ISSUED YIELD = Wall Street expectation of the auction's yield
The difference = The auction's "tail"
A positive tail (red bars, bottom panel) means the auction yield was higher than or worse than expected.
A negative tail (green bars, bottom panel) means the auction yield was lower than or better than expected.
DB: Early Morning Reid
… The risk-off turn was exacerbated by yesterday’s 10yr Treasury auction, which saw $42bn of bonds issued 3.1bps above the pre-sale yield with the highest primary dealer take up since April. Overall it was one of the weaker auctions of recent years. US 10yr yields ended the day +5.1bps higher at 3.94%, erasing all of the yield declines since nonfarm payrolls last Friday. They had bottomed at 3.66% intra-day on Monday. The final test of investor appetite for US government bonds this week will come with today’s $25bn sale of 30yr notes.
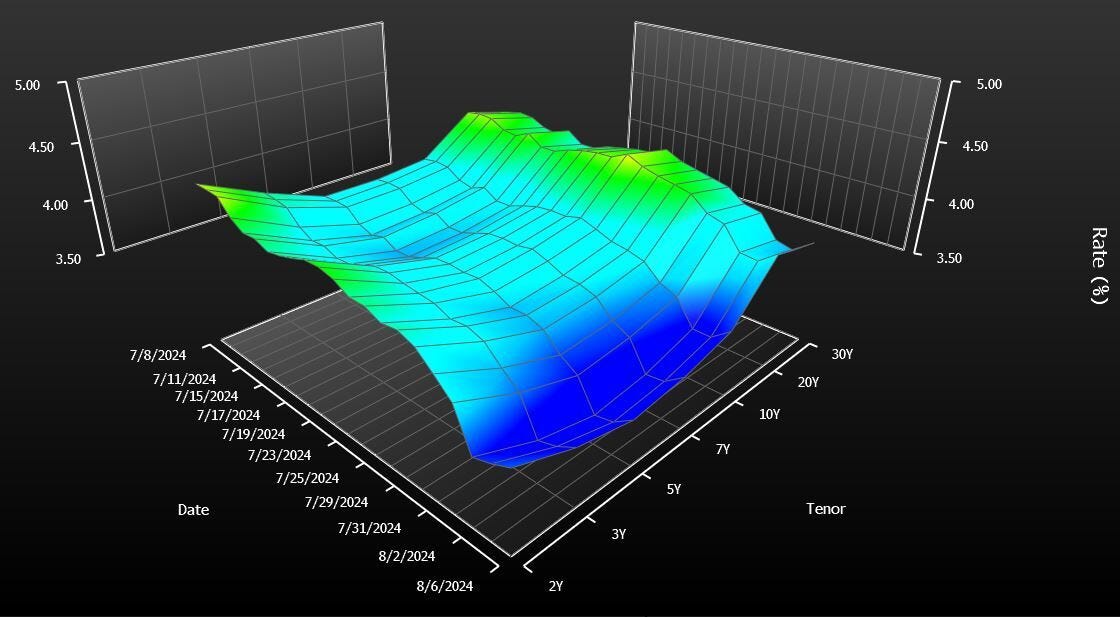
The late risk-off mood yesterday helped steepen the curve as 2yr Treasury yields closed -1.4bps lower on the day, as markets moved to price in 111bps of Fed rates cuts by the end of the year (+3.4bps on the day). This led to the 2s10s curve steepening by +6.6bps to a mere -2.1bps, which is its least negative close since it first inverted in July 2022. Overnight 2 and 10yr US yields are -2.1bps and -3.4bps lower…
ZH: Stocks Plunge After Ugly 10Y Auction Tails Bigly
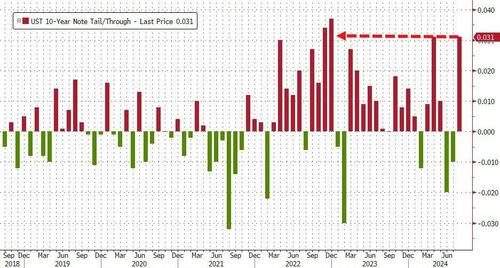
… The sale stopped at 3.96%, tailing by a little more than 3 bps...
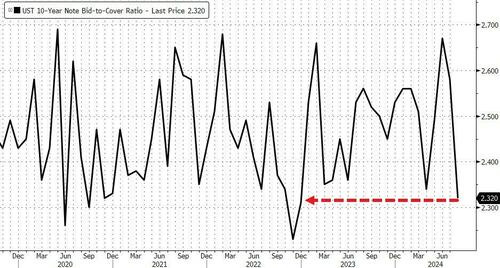
...as bid/cover of 2.32 was the lowest since December of 2022.
In fairness, indirects took down 66.2%, a fairly standard ratio, so there wasn’t a total buyer’s strike from the investor class. With directs taking a somewhat below-average 16%, this left dealers with a higher-than-usual 17.9%.
… FINE and SO … by days end
ZH: Stocks Puke Back Overnight Dovish BoJ Gains; Bond Yields & Black Gold Rise
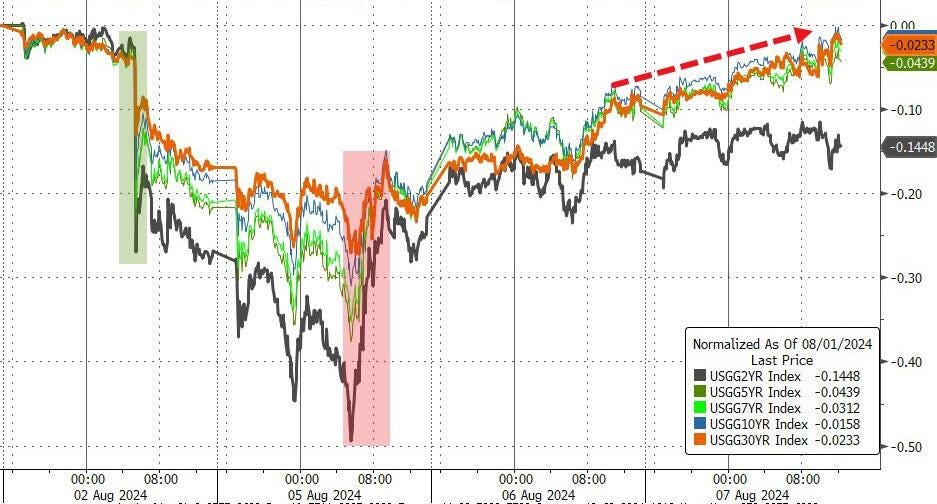
… Treasury yields were higher across the board today with the long-end unperforming (30Y +8bps, 2Y +3bps), not helped by a very ugly tail at the 10Y auction. Since payrolls, yield have basically roundtripped to unchanged (aside from the 2Y)...
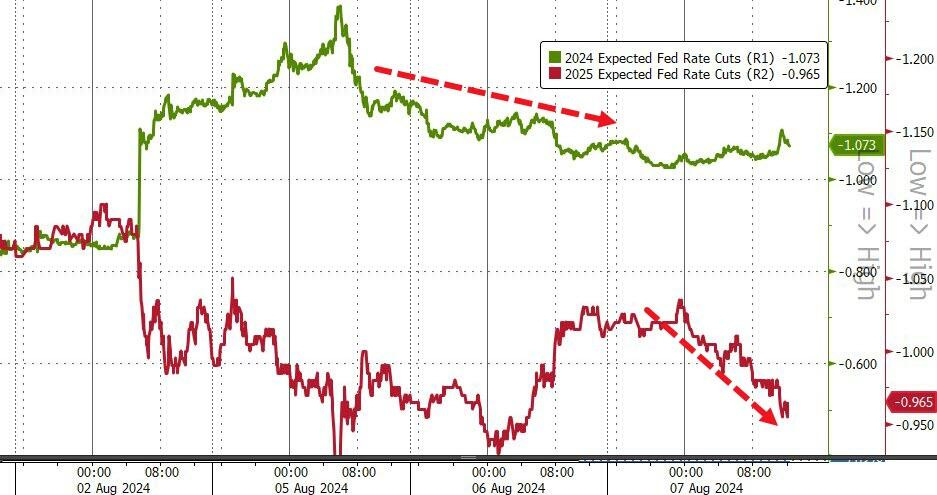
… Rate-cut expectations dropped for 2025 but were flat for 2024...
… Be that as it may / was and IS, some good news …
Bloomberg: JPMorgan Says Three Quarters of Global Carry Trades Now Unwound
Returns have fallen around 10% since May, Says JPMorgan
Reiterates clock is ticking for the G10 carry trade: JPM
… NOT yet stumbled on the actual note but suffice it to say, HOPE remains an eternal ‘leg of the stool’ of Global Wall and so, with that in mind, onwards and upwards but first … here is a snapshot OF USTs as of 644a:
… and for some MORE of the news you might be able to use…
IGMs Press Picks: August 08 2024
NEWSQUAWK: US Market Open: Bourses lower across the board, DXY above 103.00, fixed bid; US 30yr due … Fixed benchmarks bid, but largely rangebound, into data and supply
Reuters Morning Bid: Markets stay bumpy awaiting jobs reality check
Finviz (for everything else I might have overlooked …)
Moving from some of the news to some of THE VIEWS you might be able to use… here’s SOME of what Global Wall St is sayin’ …
ABNAmro: Fed Watch - Update on our Fed view | Insights newsletter (another goal post moved…)
Now that the dust from the financial market turmoil around the weekend has settled a bit, we can have a clearer view on what recent events imply for the Fed rate path. Inflation is coming down in line with expectations, but headline labour market figures are deteriorating at a more rapid pace than initially expected. The deteriorating labour market increases the urgency to cut, and the resulting decrease in wage pressures allows the Fed to be less cautious. We therefore remove the two pauses from our base case Fed path. We now expect a 25bp cut in every meeting until the upper rate reaches 3.00% in November 2025. Given currently available data, we do not yet see a reason for an initial 50bp cut.
…What does the changed Fed view mean for bond yields?
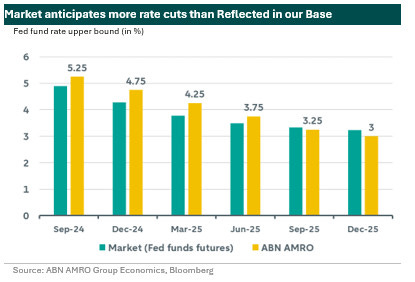
Following the changes in our Fed view and the recent market movements, we have revised our forecasts for US Treasury yields. Our revisions are based on the expectation of two additional rate cuts of 25bp in our base case, leading to lower US Treasury yields than previously projected. However, it's important to note that these revised yields still remain higher than current levels.In recent days, the market has reflected expectations of multiple rate cuts this year (as mentioned in our previous comment (here), causing Treasury yield levels to trade at (too) low levels in our view. The market is currently pricing in approximately 50 basis points more rate cuts than our base. This shift is illustrated by the graph below, highlighting an anticipated extensive rate cut cycle as market focus turned from inflation risk to recession risk. Based on our macro outlook discussed above, we believe that the market has prematurely adjusted its expectations for rate cuts in the upcoming FOMC meetings and should start to reprice it out again as the economic data proves more resilient than the market is currently anticipating…
BNP: Equities: 100 years of crashes - Recession watch (i’m a sucker for L/T visuals and here’s one of VIX)
A VIX crash: The SPX peaked in July at 5667, and troughed Monday morning at 5119. Whilst this is a significant correction, a 10% peak-to-trough move in SPX wouldn’t normally be considered a crash. However, Monday’s spike in the VIX saw the index close at 38.6 having reached an intraday high of 65.7. These levels in the VIX are consistent with a crash. To understand the implications from this vol spike, we revisit our study of 100 years of market crashes. We previously defined a crash as a 20% spot drawdown or a spot correction in which VIX peaked >35. For pre-VIX periods we use a model VIX, a regression based on spot moves and realized vol.
To date, we would consider this a positioning-driven crash, rather than the start of a recessionary bear market. It looks more similar to the Flash Crash, Volmageddon or Black Monday than to the GFC or the Covid Crash. Our base case is that in the short term, the macro data stabilizes and volatility parameters continue to gradually normalize. However, given the catalyst for this de-risking was a rapid deceleration in the macro data, we also consider how volatility might react if we do see a more recessionary environment. Vol is already well off of Monday’s highs and this could offer opportunities to strike hedges. We highlight our preferred SX5E and SPX hedges for a recession, as well as trades for a vol renormalization.DB: Fed Notes - FCI update: Stock crash just a flash in the pan for the Fed
In this note, we use our daily version of the Fed's FCI-G to show how financial conditions have moved during the recent market turmoil and quantify their impact on growth prospects. The recent market moves tightened the three-year FCI-G – the Fed staff's baseline metric – by about 15bps from the close on Wednesday July 31 after the FOMC meeting to the close on Monday August 5 (a similar sized tightening happened in the one-year version). This was the largest three-day tightening since the November 2022 FOMC meeting.
While the sharp nature of the recent tightening could be concerning, the level of the FCI-G suggests that financial conditions are still roughly neutral for forward-looking growth prospects. Moreover, at least some of this tightening could be reversed if the recent rebound in risk sentiment is sustained. Absent a sharper and broader (i.e., beyond equities) tightening of financial conditions, the recent market gyrations are unlikely to push the Fed towards more aggressive action.
DB: Asset Allocation - Q2 2024 Global Earnings Takes: Robust Rising Growth
Global earnings growth on track to rise for a fourth straight quarter
…Global earnings growth continues to rise
Global earnings growth is tracking a solid 10.3% in Q2, continuing its recovery for a fourth straight quarter. Earnings growth in Q2 is at its highest level in 8 quarters
Earnings growth has been rising even as global GDP growth has stayed flat in a 2.8- 2.9% range for three straight quarters
MS: Global Economics & Short Duration Strategy: Whither QT and the RRP?
Is QT about to end? We think the answer is "no." We explain why neither the flatlining of the RRP facility in recent months nor the markets' shift in expectations for rate cuts makes an early end to QT the base case.
Key takeaways
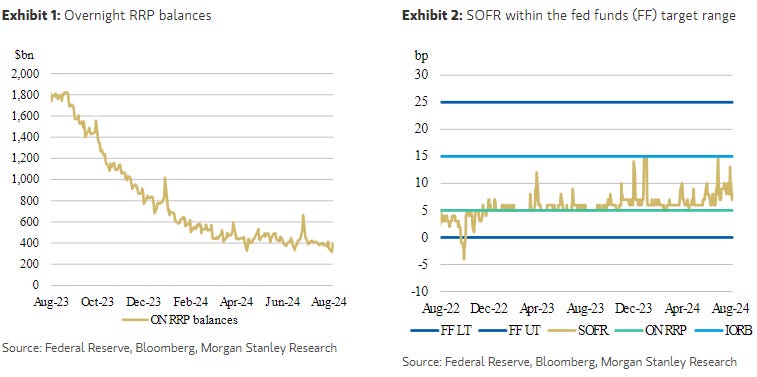
The Fed's RRP facility has flatlined over the past four months, so ongoing QT shrinks bank reserves. This fact prompts questions of whether QT will end earlier than expected.
SOFR has been drifting up, a fact that reinforces questions about whether QT will end early in order to avoid a replay of September 2019.
The market narrative is now on a possible 50bp cut in September (or even an inter-meeting cut) with fears of a "hard landing" swirling. A recession likely would spell an end to QT, but our base case remains a soft landing. Look for jobs data falling below 100k and trending down before expecting an end to QT.
Generally speaking, public comments from FOMC participants reveal a desire to have the RRP facility mostly eliminated. Should the RRP remain sticky, we foresee incremental reductions of the rate paid on the RRP, 5bps at a time. That path would extend QT and put downward pressure on SOFR.
…Macroeconomic considerations: Technical considerations are wholly separate from macroeconomic considerations. Balance sheet policy is both a market functioning tool and a macro-stabilization tool. We believe that if the FOMC saw a recession as a likely outcome, it would end QT.
With market speculation around a "hard landing" jumping after the July jobs report, and debates about 50bp rate cuts or even an inter-meeting rate cut to forestall such an outcome, QT should come into the discussion. Our baseline view is that the US economy is still on track for a soft landing and that the FOMC will start a series of 25bp cuts in September, taking the federal funds rate close to their perceived neutral rate.
In that scenario, we see no reason to end QT early. 50bp cuts, on their own, would not change that view on QT. If the FOMC concludes that inflation is no longer a concern and rapid reductions in the funds rate will extend the cycle, then 50bp cuts are clearly plausible.
But unless the FOMC begins large rate cuts because they believe that a recession is a likely scenario, we do not think they will end QT. To get to such a scenario, we would need to see nonfarm payrolls fall below 100k and appear to be trending downward convincingly.
Our US economics team has noted that 100k is probably a good marker to start expecting a 50bp rate cut in September. If so, the FOMC will also tee up conditions for an end to QT. Put simply, we still believe that short of fighting a recession, the FOMC still sees rates policy as their primary tool, and balance sheet policy will run in the background.
UBS: US employment data you can count
There is an eerie calm over the economic calendar. Weekly US initial jobless claims data may get more attention than normal. This is not survey evidence (people have to do something to make a claim), but it is also not comprehensive as unemployed new entrants to the workforce are not captured. The state breakdown may offer some helpful insights into the effects of Hurricane Beryl on Texas (and through that, national employment data).
The Federal Reserve has been late to cut rates, but sensationalist demands for an intermeeting cut can probably be dismissed. Financial markets are not so important as to justify a panicked policy response. We hear from Fed President Barkin today, who may give some hints as to the scale of the expected September rate cut (which might be 0.5 percentage points if the Fed wants to correct for failing to cut in the second quarter).
Equity markets have been meandering rather than moving with clear direction. The unwinding of more speculative trades should have concluded, allowing economic fundamentals to gradually reassert themselves.
Ukrainian action in Russia pushed up European gas prices yesterday, with a gas transit station being captured. Gas flows do not appear to be affected, and the economic impact is likely to be minimal.
Wells Fargo: Remember Inflation? July CPI Preview (already? sheesh …)
The July CPI report is likely to further the case that inflation is quieting down even if it has not yet returned to the Fed's target. We expect that both headline and core CPI rose 0.2% last month. Looking beyond July, with the labor market no longer putting upward pressure on inflation and mounting price-sensitivity among consumers, we expect the Fed will consider inflation is close enough to its target and embark on a rate cutting cycle at its next meeting…
Wells Fargo: U.S. Economic Outlook: August 2024
Implications of Less Restrictive Monetary Policy
Our August forecast update shows the economic expansion that has been in place since mid-2020 will continue. That said, the lackluster pace of hiring in July, combined with other labor market indicators continuing to weaken, implies weaker income growth which will eventually weigh on consumer spending.
In light of these adverse developments, we now look for the FOMC to cut rates by 50 bps at its meeting on September 18 with another 50 bps rate cut on November 7. We forecast the Committee will reduce its target range for the federal funds rate to 3.25%–3.50% by the middle of next year.
We have adjusted our consumer forecast and now look for real PCE to slow materially at the end of this year and start of next year before rebounding in the second half of next year amid less restrictive monetary policy.
Another area poised to eventually benefit from lower interest rates is housing, and we have taken up our residential forecast coinciding with recent declines in the mortgage rate and expectations for further rate softening next year.
We now look for the monthly pace of nonfarm payroll gains to average 116K over the next 12 months compared to 209K the past 12 months. The unemployment rate is likely to edge up to 4.5% in Q4, before less restrictive monetary policy and slower labor force growth helps turn the current upward trend around.
We have made no significant changes to our inflation outlook over the past month. The core PCE price index still looks set to increase 2.6% on a year-over-year basis in Q4-2024.
… At the start of the year, with a tight labor market and inflation trending lower, financial market participants wagered steep rate cuts were in store by year-end (Figure 1)…
Wells Fargo: Investing in the Future
Implications of the High-Tech Investment BoomSummary
It is unique to the current cycle that businesses today spend more on intellectual property products than any other category of capex. When combined with a building boom in hightech factories and a surge in outlays on information processing equipment, this opens the door to future productivity growth.Wells Fargo: Soft-Landing, or No Soft-Landing, That is the Question
Summary
In this first part of a series of reports, we introduce a new toolkit to predict the probability of soft-landing, stagflation and recessionary episodes.
Bernanke (2024) reviewed the Bank of England’s forecasting process for monetary policymaking, concentrating on the Bank’s forecasting and decision-making during times of significant uncertainty. Bernanke outlined some recommendations to design effective policy decisions, placing emphasis on accurately identifying and quantifying risks to the outlook.
We believe our proposed new framework would help decision makers effectively quantify potential risks to the economic outlook by moving away from the traditional approach of just forecasting recession probability and/or GDP growth rate predictions for the near future.
The recent monetary policy path has been different from both the recession and the soft-landing projections of 2023, emphasizing the importance of not just concentrating on recession and soft-landing scenarios to forecast policy decisions.
The toolkit helps analysts identify (a) whether the next phase is a soft-landing, (b) if stagflation is in the near-term picture and (c) whether a recession is coming.
This report sets the stage by showing why the three economic outlook scenarios are important for monetary policy decisions, particularly in gauging the potential pace of the upcoming easing cycle.
In the next installment of this series, we quantify historical episodes of soft-landings, stagflation and recessions.
Yardeni: Claims Will Tell
Tomorrow morning at 8:30 a.m. EST, the Bureau of Labor Statistics will release initial unemployment claims for the August 3 week and continuing claims for the prior week. We believe that both were boosted by Hurricane Beryl in Texas during July. So we expect to see both decline tomorrow. If we are right, that should help to relieve fears that an employment-led recession is underway. If we are wrong, there could be more chatter about the need for a Fed emergency rate cut or a bigger cut in September.
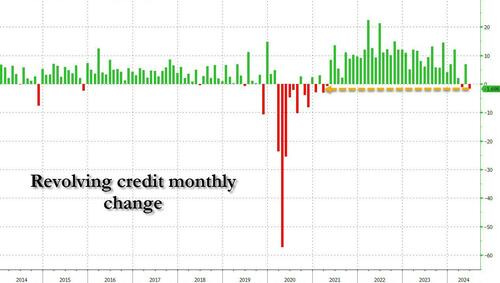
Recession fears might have been heightened by June's consumer credit report which came out today following the stock market's close. Revolving credit fell $1.7 billion m/m, well below the 12-month average monthly increase of $6.5 billion (chart). In addition, many consumer-related companies did mention in their recent Q2 earnings conference calls that consumer spending might be slowing.
Consumer credit problems usually occur during recessions as workers lose their jobs. Such problems don't usually cause recessions, but they do exacerbate them. We like to look at consumer credit per household (chart). The average household has $38,600 of consumer credit with $10,200 in revolving credit and $28,400 in nonrevolving credit. These are all at or near record highs.
However, they aren't unusually high relative to disposable personal income (chart).
Delinquency rates remain low, though the rate for consumer credit cards is relatively high at 10.9% for balances that are due by 90 days or more (chart).
Meanwhile, the sentiment picture improved in the stock market as bull/bear ratios tumbled along with stock prices (chart).
… And from Global Wall Street inbox TO the WWW,
Bloomberg: Steven Mnuchin Says It’s Time to Kill the New Treasury Bond He Created
Four years ago as Treasury head he revived the 20-year bond
It fell flat with investors. Now he says the US should dump it
It only takes a quick glance at the US bond curve to realize something is off. One Treasury security — the 20-year — is detached from the rest of the market. It hovers at yields that are far higher than those on the bonds surrounding it — the 10-year and the 30-year…
…“I would not keep issuing them,” Mnuchin, who served as Treasury Secretary under then-President Donald Trump, said when contacted by Bloomberg News. The conceit — to create another maturity to help lock in low borrowing costs for decades — made sense at the time, he contends, but things simply haven’t worked out as planned. “It’s just costly to the taxpayer.”
Mnuchin’s about-face echoes, in some ways, the go-fast-and-break-things approach to policy making that Trump and his team preferred. The Biden administration, by contrast, is taking a more conventional approach and sticking with the 20-year bond — albeit at a scaled-back size — to ensure continuity and stability in the government’s debt sale program. (A spokesperson for the Treasury declined to comment.)
… While the four years since their debut seem “like a long period of time in capital markets,” said Reganti, who is now a fixed-income strategist at Hartford Funds, “it’s actually quite a short period of time from a debt management perspective.”
Not for Mnuchin. The market, he said, has had more than enough time to render a verdict…
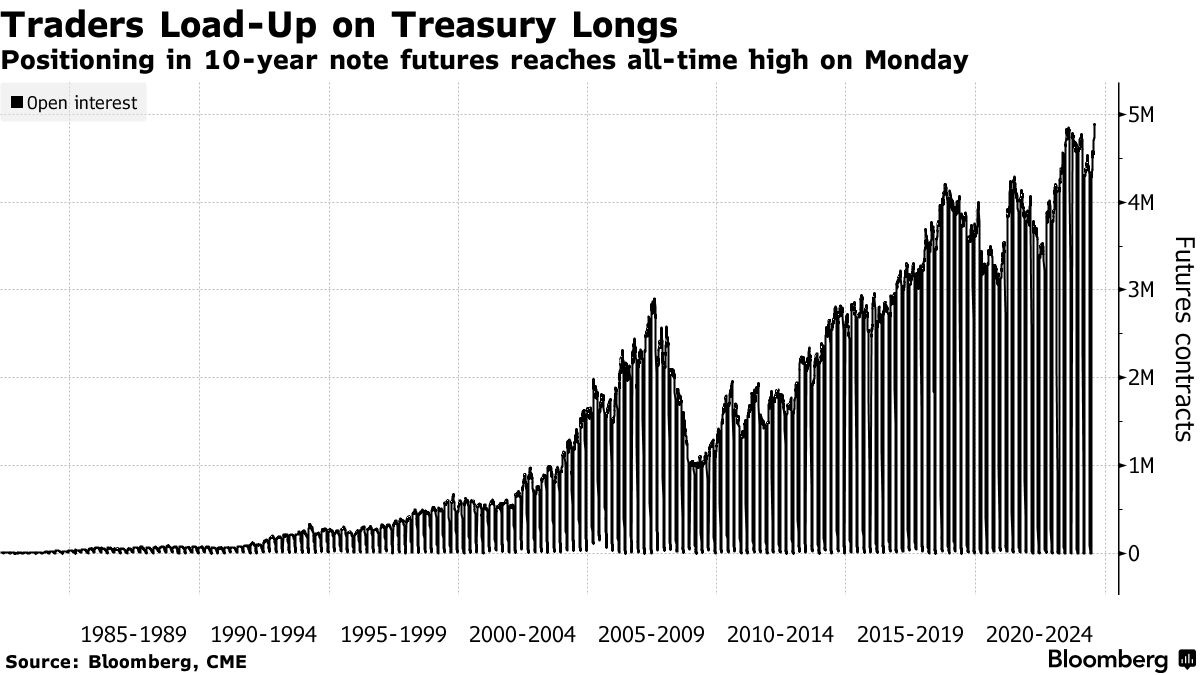
Bloomberg: Traders Are Starting to Cash In on Bets for Bigger Fed Rate Cuts
Open interest in 10-year note futures off their highs Monday
Until now money has been piling into bullish rate-cut wagers
Bloomberg: Central banks get sand kicked in their face again (Authers’ OpED)
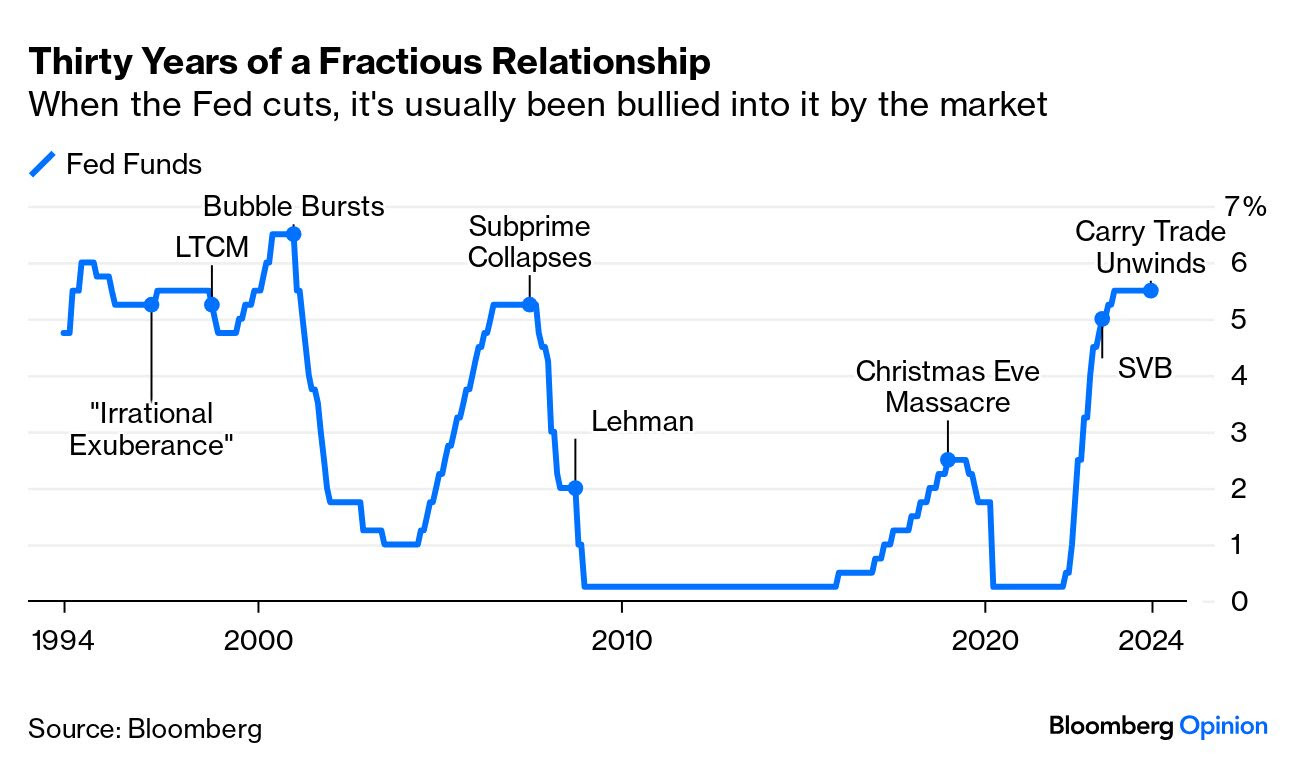
Markets are pretty good at bullying monetary authorities, and now the BOJ has fallen into a pattern that started after Paul Volcker.… Volcker, who left the Fed in 1987, once pushed the fed funds rate as high as 15%. For the last three decades, rates have never even reached half that. Financial markets sparked all the rate-cutting cycles in that time. The last time the Fed proactively raised rates to deal with the market was in early 1997, after Greenspan had warned of “irrational exuberance” in equities. He followed through with one rate hike, which triggered a brief correction in the stock market. Since then, the story has been of a series of financial accidents — from the Long-Term Capital Management meltdown in 1998 to the selloff 20 years later now known as the Christmas Eve Massacre — which brought easier money to the rescue.
The closest approach to an exception came with last year’s final two rate hikes after the US regional banking crisis. Now, the market is betting that this latest selloff will prompt the Fed to do something drastic. El-Erian’s notion that Mr. Market has been bullying the Fed for decades is very much born out by experience. The greatest attempt to slay moral hazard backfired. Letting Lehman Brothers fail in 2008 was meant to show the markets who was boss. Instead, it soon became clear that the financial system was close to disaster and that regulators could not possibly allow another major institution to go down. Moral hazard was instead taken to a higher level. (This is not something I grasped at the time, as I declared in a video that “the decade of moral hazard was over.”) …
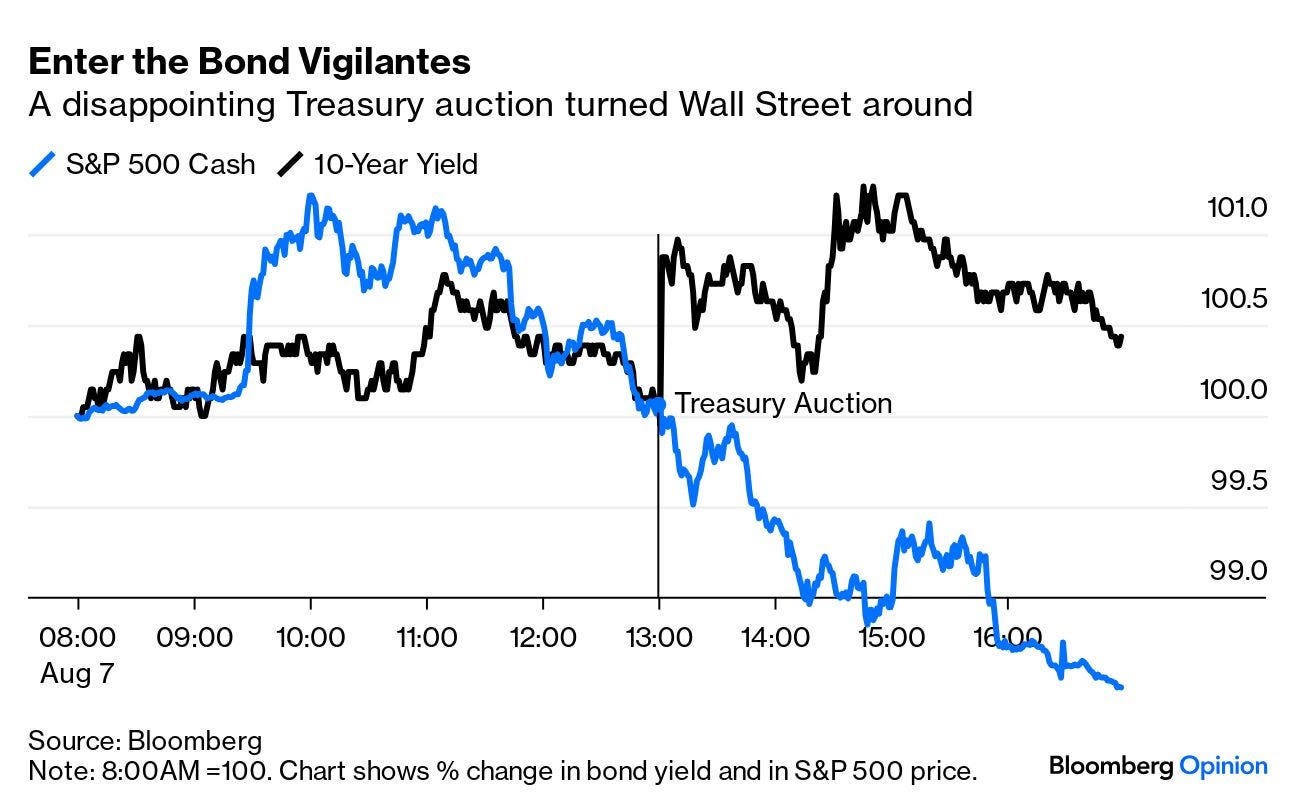
… It was the bond vigilantes who doused the enthusiasm Wednesday as a poorly received Treasury auction sent yields upward again. As this chart shows, that auction turned everyone around:
Maybe the Fed should try harder to stand up to the stock market. But everybody is prone to bullying by the bond market, and that won’t change.
EPB Research: Watch The (Modified) Duncan Leading Index (do yerself a favor and follow this fella … young Lacy Hunt or young/younger ECRI guy … got a grasp of things and able to visually contextualize to help view where we have been / are and are likely going …)
A comprehensive review of the structure of the economy and which segments you should track to understand the state of the Business Cycle.
… The Duncan Leading Index involves tracking three narrow segments of the economy: durable goods consumption, residential investment, and non-residential investment.
At EPB Research, we’ve found that it’s very easy to improve the Duncan Leading Index by tracking durable goods consumption, residential investment and business equipment investment.
We call this the “modified” Duncan Leading Index, and it’s superior to the original construction because the nonresidential investment in structures and intellectual property investment categories are not leading indicators but rather lagging….
… The chart below shows investment in nonresidential structures, including hospitals, office buildings, and shopping centers.
… As the chart shows, this category is not a leading indicator, often reaching a peak during a recession and forming a bottom way after a downturn is over.
… The modified Duncan Leading Index takes our three cyclical categories of GDP and plots them as a percentage of GDP. You can see that these three categories swing from 14% of GDP to 22% of GDP, falling sharply into recessions and rising rapidly in expansions.
These three categories are highly impacted by changes in the availability of money and credit. When the Federal Reserve started to tighten monetary policy in early 2022, this index started to decline, which was very much expected…
FirstTrust: Monetary Policy is Out of Control (best note from this shop I’ve seen in LONG while …)
The growth of bureaucracy around the world has led to a proliferation of rules. This creates multitudes of problems, one of which is that the state has made understanding what it is doing impenetrable, boring, nuanced, and technical. With vast resources, numerous employees, activist attitudes, and widespread presence, government bureaucracies have become so complex that few people can, or even want to, keep track of their activities.
There is no better example of this than the Federal Reserve. When the Fed was founded in 1913, the US was basically on a gold standard. Slowly, but surely, the standard was diluted until Richard Nixon finally closed the gold window in the 1970s. Though, even after that, at least interest rates were tied directly to the amount of reserves that were in the system…
… Nonetheless, the federal funds rate, the amount of reserves, and therefore the money supply were connected. It worked like this: if someone deposited $100 in a bank, that bank had to hold 10% reserves ($10) at the Fed. This made sense…even if government had no rules, banks still needed to hold reserves because deposits and withdrawals don’t always happen at the same time. Over time, 10% became the convention.
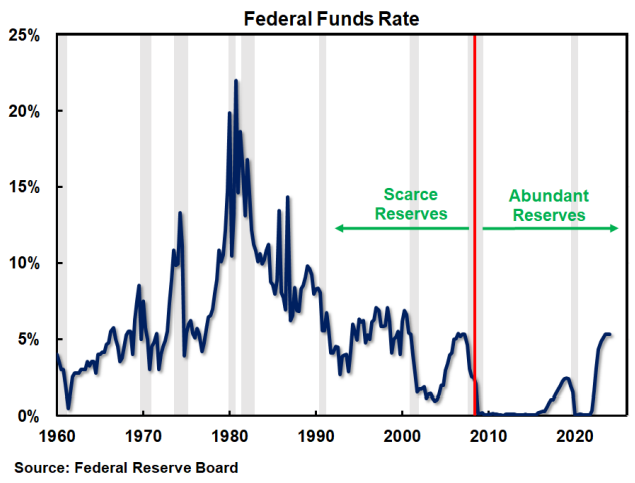
You can see in the chart below, from the 1960s through 2008, this is exactly how the system worked. Reserves averaged about 10% of M2 (a broad measure of bank deposits, including checking and savings accounts, CDs and cash). In 2007, the Fed’s Reserve Bank Credit (the Fed’s balance sheet) showed banks held $850 billion of reserves, while M2 was $7.5 trillion. This means banks held about 11% reserves at the Fed.
How did it all work? Banks had to report at least quarterly that they held 10% reserves. Just about every bank had a Federal Funds Trading Desk (unless they were small then they worked with larger correspondent banks). The traders on the desk were responsible for borrowing or lending reserves with other banks to keep everyone at the 10% level. If a bank made a big loan or had a big withdrawal of cash, it would need to borrow reserves in order to comply with the 10% rule. The more banks needed to borrow, the higher the federal funds rate would climb.
If the demand for money picked up (let’s say because home builders started building more and borrowed to do it), this would increase the money supply and banks had to hold more reserves. The trading desks would search for more reserves, and bid the federal funds rate up to get them. The Fed didn’t want this to happen, so it would inject money into the system by buying bonds, supplying more reserves. This brought the federal funds rate back down…
…So, where does the Federal Funds Rate come from? There are no traders (all the Federal Funds Trading Desks are gone). Virtually no banks need to borrow reserves anymore, a vast majority have excess reserves now. There is no market for fed funds. If there is no trading, then guess what? The Fed just makes it up. Seriously, 12, or 17, or whatever number, people sitting around a table in Washington DC just make up the interest rate. There is no longer a true market, we have government price fixing for the most important interest rate in the world.
Here is a chart of the Federal Funds Rate back to 1960. Look at the difference between how the market moved before and after 2008. The left side looks like a market, it’s volatile, the right side looks like price fixing, it’s smooth. Interest rates are supposed to compensate investors for inflation, but the Fed has held interest rates below inflation 80% of the time over the past 16 years.
Now consider if you are a government with a debt of $35 trillion and you also get to set interest rates, where would you set them? The 400 Ph.D. economists at the Fed decided that holding them at 0% for nine of the past 16 years was appropriate. Convenient! But at least 0% was more appropriate than the negative interest rates that were seen in Europe and Japan…
…The Fed’s shift to an abundant reserve policy moves the US more into the territory of Modern Monetary Theory, where Fed and Treasury policies are intertwined. It moves the US closer and closer to a National Bank. We keep reading from former Fed leaders that Donald Trump has a plan to make the Fed subservient to the government. It looks to us like this has already happened. No matter who is in charge, monetary policy should only have one objective…to keep the value of the dollar stable. Abundant reserves put that at risk more than any policy shift in the history of the United States.
FRBSF: Phillips Meets Beveridge
The Phillips curve plays a central role in the macroeconomics literature. However, there is little consensus on the forcing variable that drives inflation in the model, i.e., on the appropriate measure of “slack” in the economy. In this work, we systematically assess the ability of variables commonly used in the literature to (i) predict and (ii) explain inflation fluctuations over time and across U.S. metropolitan areas. In particular, we exploit a newly constructed panel dataset with job openings and vacancy filling cost proxies covering 1982-2022. We find that the vacancy-unemployment (V/U) ratio and vacancy filling cost proxies outperform other slack measures, in particular the unemployment rate. Beveridge curve shifts—notably, movements in matching efficiency—are responsible for the superior performance of the V/U ratio over unemployment.
ZH: On Verge Of Credit Shock: Credit Card Debt Posts Biggest Drop Since Covid Crash As Rates Hit Record High
… On one hand, non-revolving credit - which consists of student and auto loans - rose by $10.6 billion, which was the biggest monthly increase since last June.
However, a closer look here reveals that the entire increase here was due entirely to student loans, which are once again being repaid after the Biden repayment moratorium ended in late 2023…
… But while non-revolving credit saw a sizable increase, if entirely due to student loans finally catching up to where they should have been 3 years ago, it was revolving credit (i.e., credit card debt) that was the real shocked, because in June, revolving credit unexpectedly tumbled by a whopping $1.7 billion, the biggest drop since the covid collapse...
... and more ominously, every time there is a sizable drop in this category, some economic calamity either follows or has already started.
Finally, with a new simplified tax code announced, some UST issuance signals to gleen??
… THAT is all for now. Off to the day job…


