Apparently rates still matter … and apparently stock jockeys are all moar than just macro tourists, they are truly global central banking FedEXperts too.
Global Wall reacting TO CPI bein’ superHI …
… especially in context of 6 (or 7)CUTS morphing TO now NOT 6 (or 7) and MARCH now NOT March but first came May now being pushed further OUT the year (running right in to elections, no?)
Well … I certainly picked the wrong week to attempt noting anything BULLISH ‘bout rates … ?
Back TO the WEEKLY, bearish (2yy UP nearly 20bps on the day) I told ya so’s? Watching price action as week comes to a close and while today’s trading activity of YUGE significance, will NOT be dismissive of the fact there’s 3 more days left in the week!
My NEXT reaction to seein’ the data print likely borne out of a bit of jealousy …
I could not believe some out there are paid professional f’casters and not a one leaned into any potential UPSIDE and yet, here we are. It’s OK though because essentially no matter WHAT happens (ie putting the ‘CON’ in to the CONsensus guesstimates), Global Wall gets PAID …
First a few reCAPatory links from the intertubes …
BondDad: Jan 2024 consumer inflation: still a tug of war between gas and housing CalculatedRISK BLS: CPI Increased 0.3% in January; Core CPI increased 0.4% CR: YoY Measures of Inflation: Services, Goods and Shelter WolfST: Beneath the Skin of CPI Inflation, January: Powell’s Gonna Have a Cow when he Sees the Spike in “Core Services” Inflation ZH: CPI Prints Hotter Than Expected In January As SuperCore Soared ZH: Stocks, Bonds, & Bullion PukeAfter Hot CPI Print Hammers Rate-Cut Hopes
…. which leaves Global Wall, the Fed and frankly myself (for being ushered OUT of the great dart throwing game what seemed to be moments before the Fed’s hike cycle) like Buford T. Justice lookin’ for disinflation and 6 (or 7?) rate CUTS in 2024 …
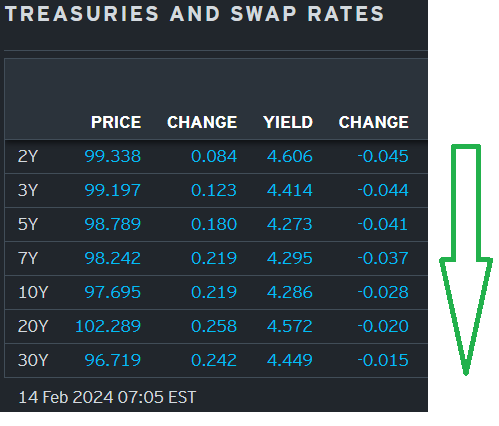
… so much for The Year of the Great ReSteepening? Again? More from Global Wall in a moment but here is a snapshot OF USTs as of 705a (been down so long they look UP):
… HEREis what this shop says be behind the price action overnight…
… WHILE YOU SLEPT Treasuries have rebounded with the curve steepening after UK CPI came better than feared while FV-TY block curve steepeners were seen earlier. DXY is little changed while front WTI futures are little changed as well. Asian stocks there were open were mixed, EU and UK share markets are higher (SX5E +0.3%) while ES futures are +0.35% here at 6:30am. Our overnight US rates flows opened lower in Asia but bounced as dip buyers were seen in the front-end and belly. After the London crossover, prices were generally stable at higher levels- supported by real$ demand for 5-7y sector paper in particular. Overnight Treasury volume was quite solid at ~165% of average according to our sheets.
… and for some MORE of the news you might be able to use…
NEWSQUAWK: US Market Open: Equities firmer, Bonds bullish post-UK CPI which led the Pound lower; Fed, ECB and BoE speak due…Bonds boosted in tandem with Gilt price action, which gapped up post-inflation data
Finviz (for everything else I might have overlooked …)
Moving from some of the news to some of THE VIEWS you might be able to use… here’s SOME of what Global Wall St is sayin’ … CPI (and couple NFIB)recaps / victory laps and PUSHBACKS as GOAL POSTS and previous forecasts are apparently being ripped UP and rewritten as we speak …
BARCAP January CPI: The wrong direction of travel (recap good but wait ‘til you read updated VIEW …)
Core CPI accelerated 0.4% m/m in January, and was up 3.9% from a year ago, amid an upside surprise from core services categories, including the important OER. Headline CPI accelerated to 0.3% m/m and was up 3.1% y/y.
BARCAP Federal Reserve Commentary: Change in Fed call: Stronger CPI to delay first rate cut (and … it continues … when the facts change Global Wall has every right and should be expected to change … pushing back from March to May and watching for all to coalesce ‘round June now … any later then we’re talkin’ elections…)
With January CPI inflation surprising to the upside, due to a continued tight labor market and resilient economy, we expect the FOMC to start cutting policy rates 25bp every other meeting starting in June, bringing the fed funds target range to 4.50-4.75% by the end of 2024 and 3.50-3.75% by the end of 2025.
… Within the details of core inflation, Rent was up +0.4% vs. OER +0.6%. Airfares gained +1.4% while Used Cars dropped -3.4% MoM. Overall, it was a decidedly stronger read on inflation that confirms well with Powell's unwillingness to discuss near-term rate cuts …
BloombergBNP US January CPI: Broad services strength means later, fewer Fed cuts (fact change … bla bla .. we bla…you get the joke)
KEY MESSAGES
The services-driven upside surprise in January CPI suggests that the “last mile” back to target inflation may indeed be more difficult than the largely goods-driven progress to date.
We think the January acceleration in OER is likely noise, but the broad-based strength across non-shelter services points to underlying inflationary pressures remaining intact.
While Fed Chair Powell said inflation prints do not necessarily need to be as good as in H2 2023 to initiate a rate-cutting cycle, we think the composition of January CPI will be particularly worrying to hawkish FOMC participants.
We have therefore pushed back our expectation of the first cut of the cycle to June (versus May prior). Given the context of above-trend growth and hiring of late, we also think the Fed cuts by less this year – we now see 100bp (versus 150bp prior).
Key Takeaways: Small business optimism remained at a historically low level at the start of 2024. Hiring intentions in January were the weakest level since May 2020, although job openings remained elevated. The net share of firms currently raising average selling prices continued to trend down, reaching the lowest level in three years, though the percentage of firms planning to raise prices edged higher. Small business nominal sales and earnings trends remained weak in January.
US yields shoot higher post the US CPI on Tuesday. Techs suggest yields could rise further, with double bottom formations across the tenors. We illustrate this with 4 charts.
US 10y yields:
Last week, we had warned that there is a need to be cautious of rising yields given rising momentum and the potential double bottom.
US 10y yields have now completed a clean break above the double bottom neckline at 4.19%, while also posting a bullish outside day. Taken in tandem with the fact that there are no clear resistances till the 4.50%-4.51% resistance levels (psychological resistance and Nov 27 high), we think we could see a continued rise in yields towards 4.5%.
US 5y yields:
Yields have broken above resistance at 4.29% (Dec highs) as well as the 200d MA resistance.
The building blocks point to further rises in 5y yields as well with a lack of further resistances till the 4.50-4.53% level (psychological level and Nov 27 high). However, we think the first key level to watch will be 4.4% (double bottom indicated target).
US 2y yields:
Like the 5y and 10y tenors, we have broken above the double bottom neckline, suggesting we could see a further rise in yields. However, the caveat here is strong resistance between 4.69%-4.77% (200d MA and Dec high). Furthermore the double bottom indicated target also falls between this level at around 4.71%.
Slotting in the building blocks, we think that a further rise in yields could be limited for the 2y tenor.
US 2s10s curve:
A bearish outside day for 2s10s. However, further downside may be limited given the 55d MA support at -36bps. IF we break below, subsequent support is at -40bps (Feb low and -61.8% Fibo retracement).
DB: January CPI recap: Heartbreak hotel for rate cut hopes?
The January CPI data came in strong, with both headline (+0.30% vs. +0.23% in December) and core (+0.39% vs. +0.28%) surprising to the upside. Taken together, the year-over-year rate for headline fell by three tenths to 3.1%, while that for core fell by about 7bps, but failed to round down, remaining at 3.9%. This upside surprise unwinds some of the recent progress on disinflation, with the three-month annualized rate increasing seven-tenths to 4.0% and the six-month annualized rate rising by four-tenths to 3.6%.
At the component level, goods were again a large drag on inflation, falling by 32bps, the third largest monthly decline post-covid. This was largely due to a 3.4% drop in used cars and truck prices, though other goods categories such as apparel and medical care commodities also posted large declines.
The upside surprise was driven by services, which remained sticky across all three major categories. Owners' equivalent rent spiked up to +0.6%, but this could potentially be anomalous given that primary rents continued to trend downwards. A sharp increase in hospital services, strong professional services, and a slight acceleration in health insurance served to push overall medical services inflation higher. Core services outside of rents and medical services also posted the strongest monthly gain in almost two years.
Regarding Fed expectations, the market now is now pricing a fed funds path that is close to our current forecast, namely that the first cut is likely to happen at the June meeting, with about 100bps of cuts through year-end.
That being said, the passthrough from the CPI data to the January core PCE print is likely to be somewhat muted. Indeed, we have penciled in +0.24% for the latter. This Friday's January PPI will be critical for rounding out our core PCE forecast, providing an update on key PCE inflation components such as healthcare services, airfares, and portfolio management.
Goldilocks: Core CPI Exceeds Expectations on January Effect and Owners’ Equivalent Rent Strength
BOTTOM LINE: January core CPI rose 0.39%, 9bp above consensus expectations and compared to +0.28% in December. The year-on-year rate was unchanged at 3.9% compared to consensus of 3.7%. The strength largely reflected start-of-year price increases for labor-reliant categories such as medical services, car insurance and repair, and daycare, and we assume inflation in these categories returns to the previous trend on net in February and March. However, the large and persistent owners’ equivalent rent category (OER) was also surprisingly strong, perhaps driven by the rebounding housing market. Used car prices fell sharply, and we continue to expect further declines in February and later this year. We tentatively expect core PCE prices rose 0.34% in January (mom sa). We will update our estimate after this week’s import price and PPI data.
JEFF: Jan CPI +0.3%, Core +0.4%... Troubling Resurgence in Core Service Prices Will Keep the Fed on Hold
■ The January CPI rose +0.3% (+0.305% unrounded) with core up 0.4% m/m (+0.392% unrounded). Both measures came in 0.1% above the consensus forecast. ■ The upside surprise is broad-based, and likely quite troubling for the Fed. Were it not for a 3.4% decline in used car prices and a 3.2% decline in energy goods, this data would have looked far worse. Service prices continue to show very sticky upward pressure that is proving very difficult to stamp out, given that many of these services are non-discretionary and do not have clear substitutes. ■ Shelter prices came in surprisingly strong, further widening the gap between market-observed rates and the components of the CPI. This gap should narrow over time, but it is taking longer than expected. ■ Looking through the surface-level measures to the so-called "super core" of core services ex-housing, inflation accelerated to +0.9% m/m, the biggest sequential increase since April 2022. ■ Although there are a number of upside surprises within the details of the data, nothing sticks out as particularly anomalous. There is nothing in the composition that suggests we should necessarily see a reversal next month.
RBC: U.S. CPI growth shows underlying signs of inflation reacceleration
…Bottom line: A disproportionate share of price growth is still coming from the lumpy shelter/rent component. But broader signs of reacceleration in inflation pressures coming in the wake of another surge in employment and faster wage growth in January are reinforcing the risk that the Fed won't need (or be able to) pivot to interest rate cuts as quickly or aggressively as previously expected. No members of the Fed's policy setting committee expect to hike interest rates further, and our own base case has long assumed the central bank will pivot to gradual rate cuts by mid-year. But that outlook is contingent on a softening economic backdrop and easing inflation pressures, with risks tilting to a later and/or slower pace of cuts should the run of resilient inflation and economic growth numbers persist.
… Another solid report likely in February We currently project the headline CPI will increase 35bp in February (seasonally adjusted) and the core CPI will increase 31bp amid rising gasoline prices, though less upward strength from OER. Given the large base effects 12-month inflation is likely to continue to slow in the coming months. Looking further ahead, we expect 12-month core CPI inflation to trend down through the year amid increasing goods supply (particularly for motor vehicles), the pass-through of slower new lease rents into CPI rents, and a general easing in the economy
UBS (Donovan): Spending power improves (this guy is KILLIN’ me … hashtag economics? almost sounds like he himself will do anything for a click…am curious if he ever traded an actual bond. or an actual anything….)
Yesterday’s US consumer price inflation rate slowed slightly less than expected—in the world of hashtag economics that was “hot” and a cue for hysteria. In reality, the fictitious owners’ equivalent rent drove most of the inflation. Moreover, inflation is geographically concentrated. For homeowners in most of the US, inflation in reality (excluding OER) is around 2%—bad luck if you live in Texas or Florida, where it is approaching 5%.
UK inflation was stable (consensus expected a rise). The weirdness of UK energy pricing pushed prices higher (it will push the numbers lower later this year). Food price inflation continues to slow—sponge cakes are a disinflationary force, apparently. Wages pressures have not materialized—the shift to flexible working and online retail may mean that wage fears are overstated more in the UK than elsewhere.
Across price data, consumer durable goods prices continue to be in deflation or disinflation. US durable goods price levels are lower than September 2021. In the UK, durable goods price levels are the lowest since August 2022.
Wells Fargo: January CPI: A Great Disservice (rate cut chances slippin’ into summa)
Summary The January CPI data came in hotter than expected and did little to give the FOMC the "greater confidence" it needs to start imminently cutting rates. Gasoline prices declined for the fourth month in a row, but an outsized jump in energy services and food prices tempered any enthusiasm from the decline in fuel prices. Excluding food and energy, core CPI rose 0.4% in the month, a tenth stronger than the consensus forecast. Core goods prices remained in deflationary territory amid the ongoing normalization between supply and demand for many of the subcategories, such as used autos. However, core services inflation came in hot at 0.7%, the largest gain in 16 months, amid a move higher in price growth for owners' equivalent rent, medical care services and travel-services such as airfares and hotels.
On a month-to-month basis, the inflation data can be noisy, and this is particularly true in January when businesses adjust prices at the start of the calendar year in a way that may not always be well captured by the seasonal adjustment process. We suspect inflation will resume its downward trajectory in the coming months. That said, today's report is a reminder that the road back to 2% inflation likely will have some potholes, and it reinforces the hawks on the FOMC who have expressed skepticism that an imminent easing of policy is warranted. There are still two more CPI reports between now and the May FOMC meeting, in addition to a slew of other economic data, but the timing of the first rate cut is at risk of slipping to the summer.
Wells Fargo: Small Business Optimism Declined in January. Inflation, Labor Issues and Lower Sales Expectations Further Weigh on Sentiment
Summary Small Business Owners More Downbeat to Start 2024 The NFIB Small Business Optimism Index took a step back in January as the headline index fell to 89.9 from 91.9 in December. Overall, sentiment continues to hover at a low level, well below its long-term trend. Many of the challenges that small firms have faced since the pandemic, such as inflation, labor shortages, supply chain snags and tighter credit conditions, generally have improved over the past year. That noted, an uptick in the share of firms expecting to raise prices is a sign that business owners are still contending with a higher cost environment against a backdrop of dimming prospects for stronger future sales. All told, January's downturn in small business confidence is consistent with our expectation for a solid, yet slower pace of economic growth in 2024.
Yardeni: Inflation Scare (from 7 there are now 4…and he’s thinkin’ 2-3 … makes sense to ME)
Today, January's CPI inflation rate was slightly higher than expected. But the upside surprise was enough to convince investors and traders that the Fed is less likely to cut the federal funds rate (FFR) soon or by as much as they expected over the next 12 months. The 12-month federal FFR futures rose to 4.44% today, up from 3.74% on January 15 (chart). That amounts to 4 cuts of 25bps rather than 7 cuts. We are still thinking more like 2-3 cuts during the second half of this year.
We still think inflation will fall to the Fed's 2.0% target by the end of this year. However, we are also expecting that the economy will remain relatively strong. So why should the Fed rush to lower the FFR?
As promised, we are focusing on today's headline and core CPI excluding shelter. They were up just 1.6% and 2.2% y/y through January (chart)! Rent inflation is still moderating on a y/y basis, but it is doing so very slowly.
The S&P 500 and Nasdaq 100 fell 1.37% and 1.58% today as investors and traders took some profits. Remember: We aren't rooting for a meltup. So we aren't rooting for the Fed to cut the FFR too soon or too fast. We view today's setback as a healthy development for the sustainability of the bull market. Our hunch is that the S&P 500 might test and find support at 4800 (chart). We are still targeting 5400 for the S&P 500 by the end of this year NOT by the end of this month!
… And from Global Wall Street inbox TO the WWW,
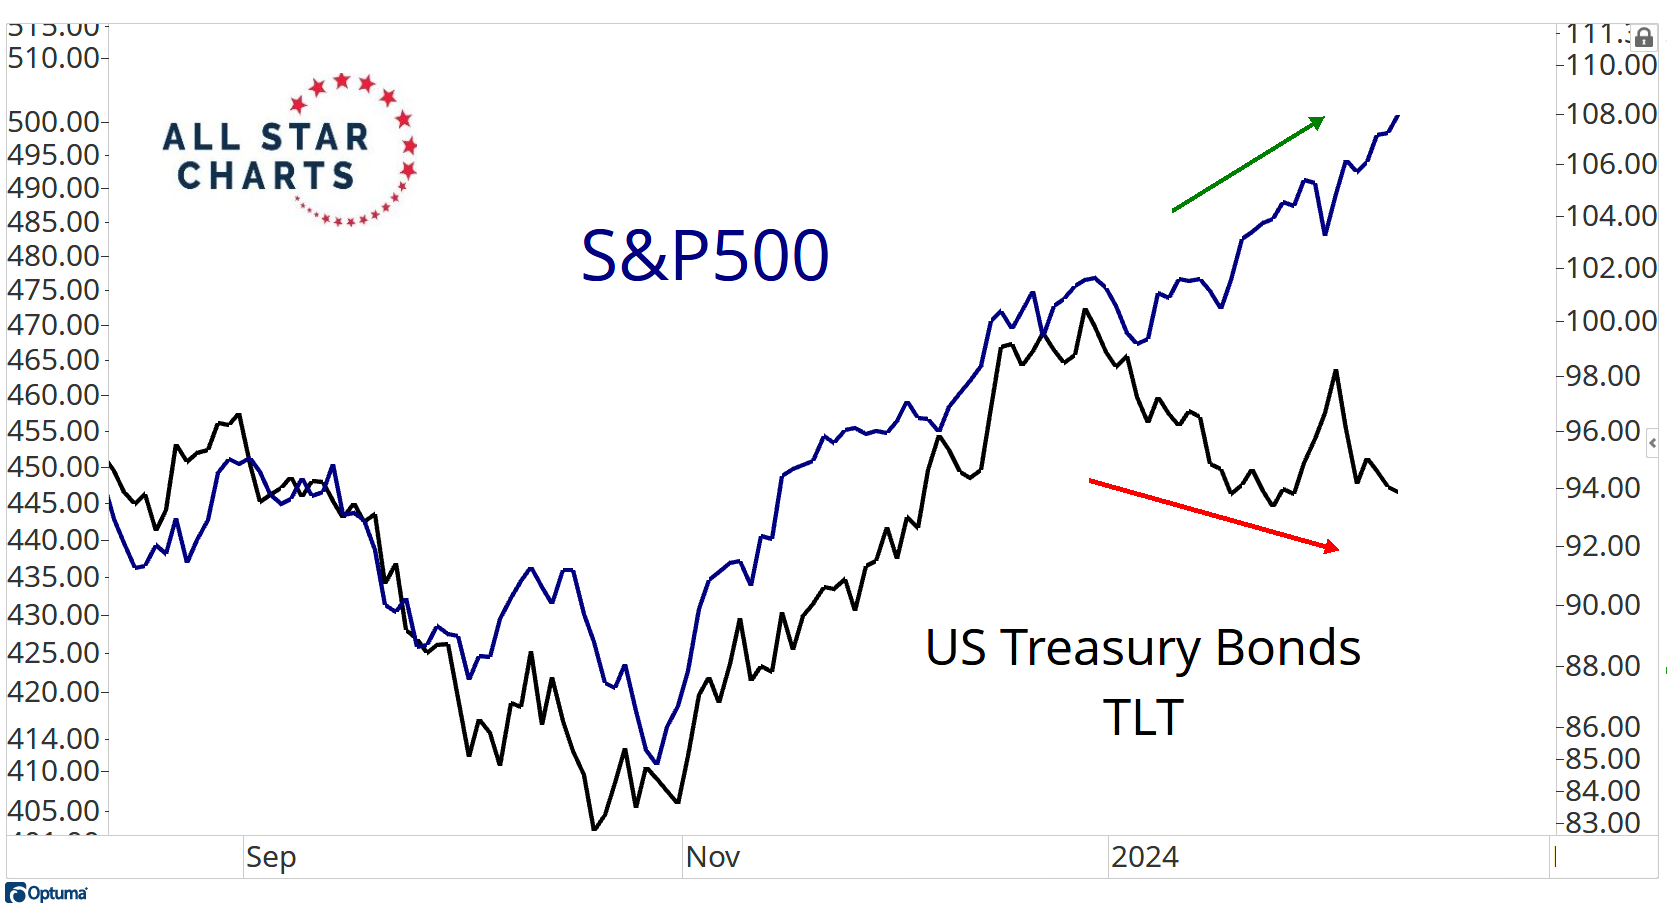
AllStarCharts: Rug Pull Season > Football Season (QQQs vs TLTs — who ya gona trust, stocks or bonds … THEY — the allstars — are #shortstocks)
… Remember, the majority of stocks on the NYSE are down for the year.
So while the S&P500 and Nasdaq are up 5-6% for 2024, you’re just not seeing it at the individual stock level.
Newsletter writers are the most bullish they’ve been in years. In summer and Fall of 2022, they were telling you to sell stocks, just as stocks were bottoming. Now they’re telling you NOT to sell stocks.
Seasonally this Q1 of Election years is one of the worst quarters of the entire 4-year cycle. This time seems no different.
We’re short equities. We’re betting on lower prices for stocks continuing, as we’ve seen all year.
The risk for those of us who have plenty of money, is for prices of stocks to continue to fall…
The Atlanta Fed's sticky-price consumer price index (CPI)—a weighted basket of items that change price relatively slowly—increased 6.7 percent (on an annualized basis) in January, following a 4.2 percent (revised) increase in December. On a year-over-year basis, the series is up 4.6 percent.
Bloomberg: Global Bonds Erase All Gains Since Powell’s Pivot in December
Treasury 10-year yields advance following US CPI data
TD Securities sees risk of price pressures shifting higher
… Global bonds slumped this year as Fed Chair Jerome Powell led major peers in pushing back strongly against market bets that central banks would start rapid easing moves as early as March. The rout accelerated after data on Tuesday showed US inflation in January was stronger than expected, while prompting traders to push back bets on the first Fed interest rate cut to July.
“January CPI is a game changer — the narrative that Fed disinflation provided scope for insurance cuts is clearly now on the chopping board,” said Prashant Newnaha, Singapore-based senior rates strategist at TD Securities Inc. “There is now a real risk that price pressures begin to shift higher. The Fed can’t cut into this. This should provide momentum for further bond declines.”
Bloomberg: 5 Things You Need to Know to Start Your Day (Asia)
… The bond market’s worst fears about US inflation pretty much came to pass with the release of January data. The surprise was strong enough to force traders to push back their base case for the first Federal Reserve interest-rate cut to June. It’s been a very rapid climbdown — a month ago March was favored — and the market now sees better-than-even odds that the Fed will in fact deliver three quarter-point reductions as it forecast; in mid-January traders saw chances for as many as seven.
The depth of the market’s disappointment can best be seen though in the way that investors have almost fully wiped out the steep declines in yields that followed the US central bank’s pivot toward easing at the Dec. 12-13 meeting. That shows how investors’ expectations for a rapid switch to Fed rate cuts have been vaporized. It also underscores the potential that yields can march higher still as longs capitulate, especially if there are further data shocks.
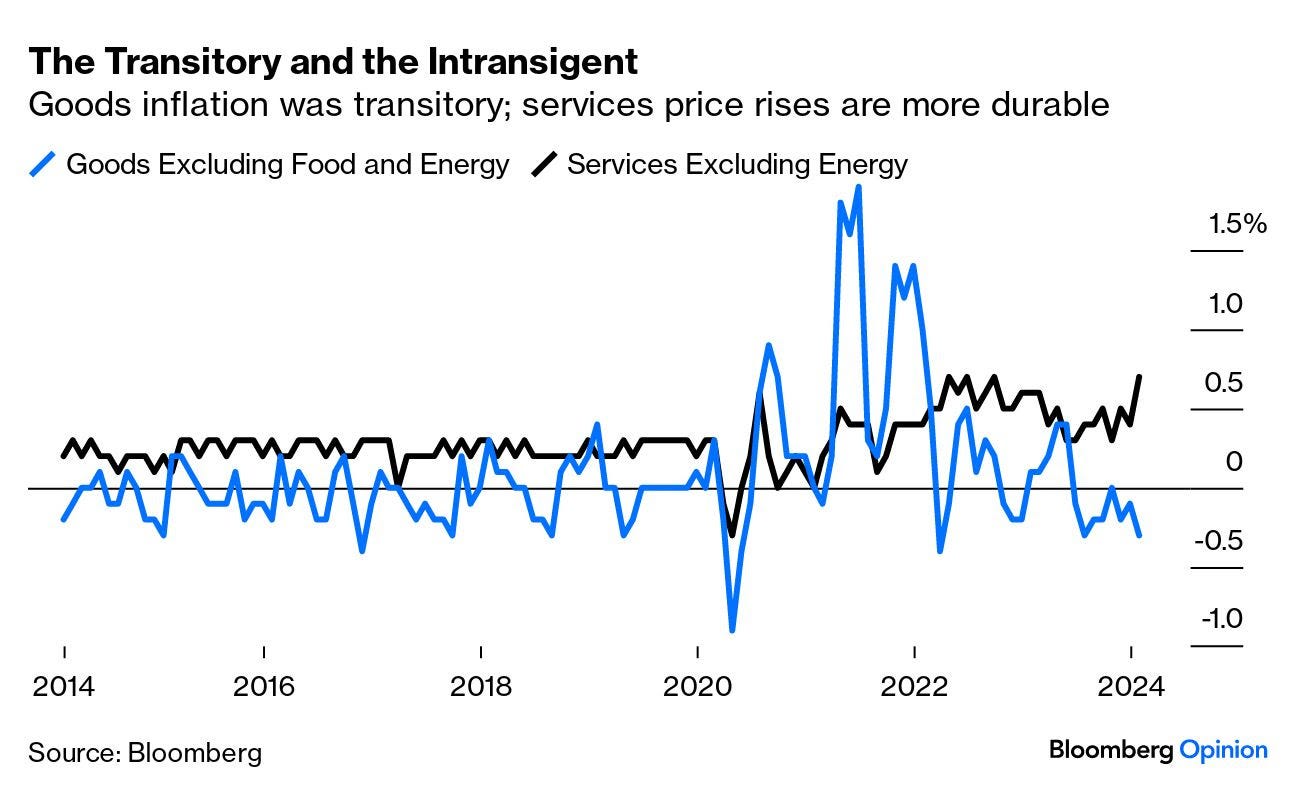
Bloomberg: First there was Transitory. Now comes Intransigent(Authers’ OpED)
These Numbers Were Too Hot to Handle Goldilocks should be careful she doesn’t burn her lips. After a startling US inflation report for January, it’s plain that her porridge isn’t too cold, at least not yet — but it very well might be too hot. That led to an interesting readjustment on markets, as traders pondered the possibility that Team Transitory hadn’t been right after all.
The debate throughout 2021 was whether the inflation then taking hold was truly “transitory” — driven by temporary supply blockages caused by the pandemic — and would come down without the help of hawkishness from central banks. Team Transitory lost that battle, but they certainly had a point that much of that extreme spike was indeed short-lived. That shows up if we compare month-on-month rises in goods (excluding always erratic food and energy) and services. Goods suffered a huge shock that is now over; services inflation, however, has moved to a level notably higher than before the pandemic. Goods inflation fell last month, while services rose:
To illustrate how the price-shock pig worked its way through the python, the following screenshot from the Bloomberg terminal’s ECAN <GO> function shows the contribution over the last five years of food, energy, services and goods. Goods and energy drove it at first. Now, services (in yellow) is substantially all of the problem:
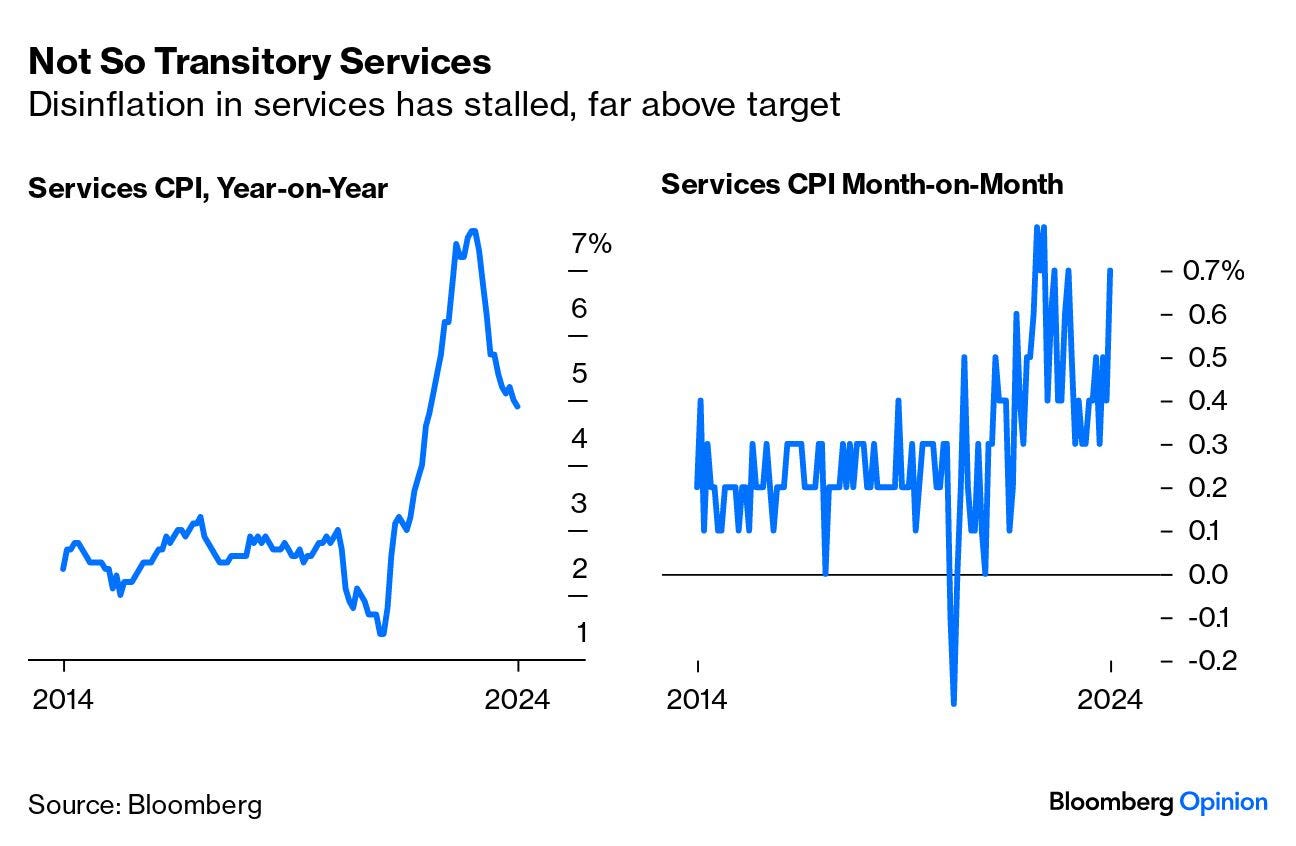
It’s the month-on-month figures that show the problem clearest. On a year-on-year basis, services inflation is coming down, though a little disappointingly slowly. Month-on-month, it’s back close to its peak:
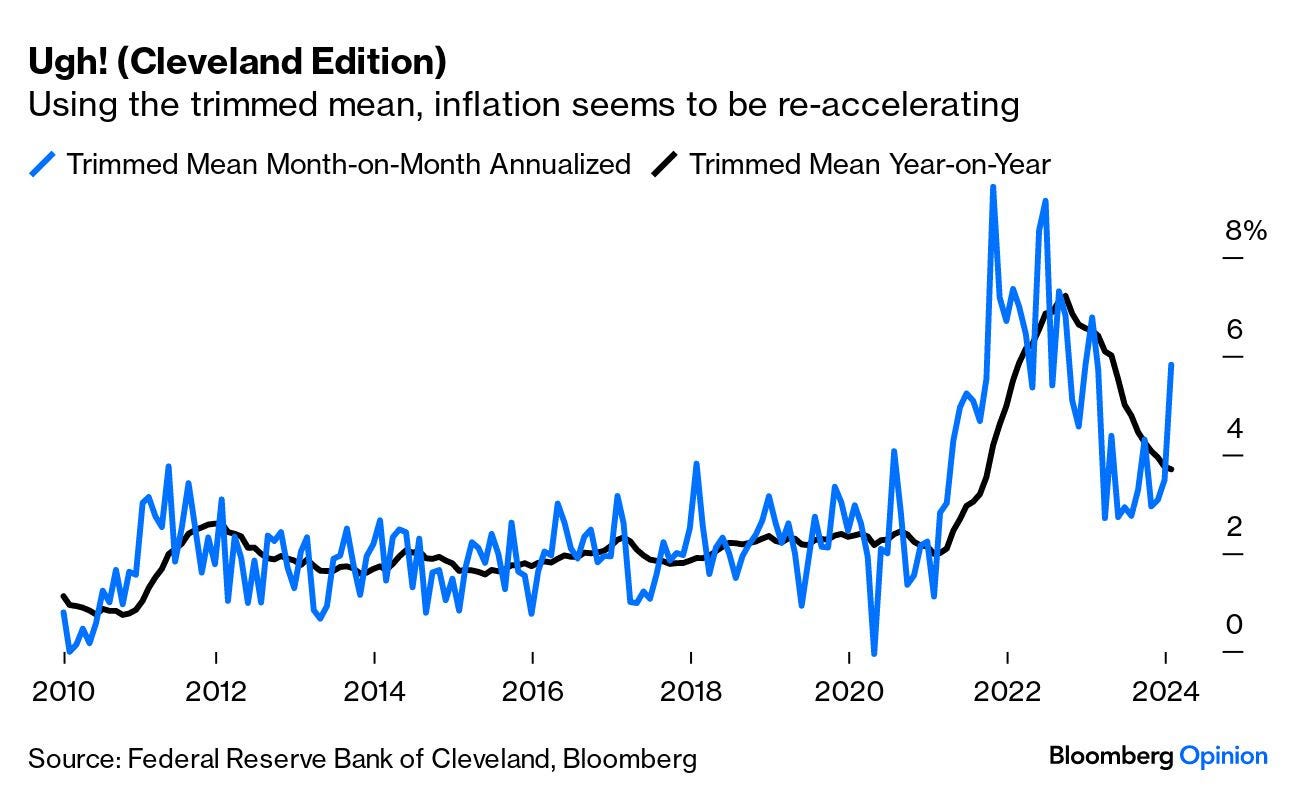
… However, it would be dangerous to dismiss January as a quirk. More sophisticated statistical measures carried out by different research groups within the Fed confirm a picture of rising, not falling, inflationary pressure. The Cleveland Fed’s trimmed mean, which excludes the biggest outliers in either direction and takes the average of the rest, saw its biggest rise last month since early in 2023. The overall year-on-year measure is barely below 4%. So this can’t be attributed to some quirky outliers:
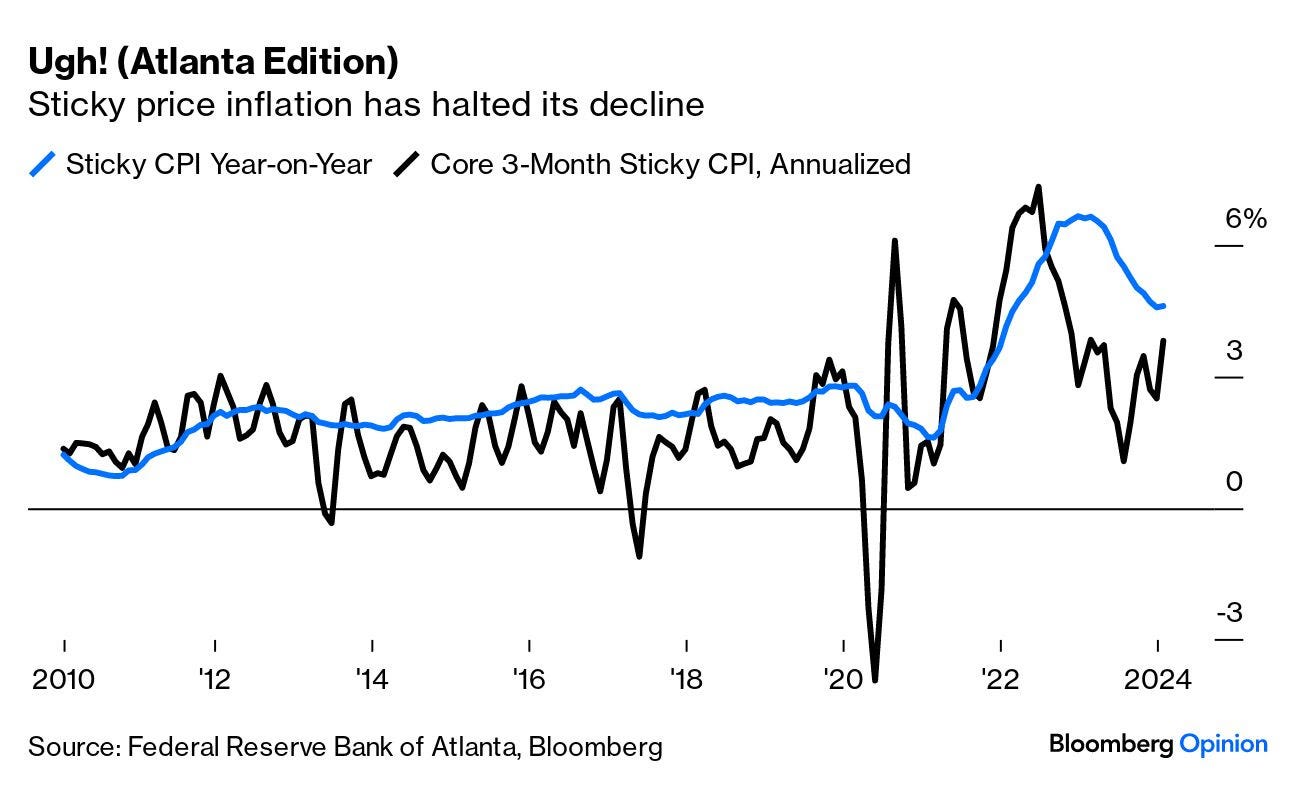
The Atlanta Fed keeps an index of sticky prices, for goods and services whose prices take a long time to change and tend not to go down. As a rule, it’s when this number develops momentum that central banks need to fear that inflation has become engrained again. And over the last three months, sticky price inflation has picked up. The decrease in the year-on-year measure has stalled:
None of these numbers suggests disaster, or anything like it. But they clearly suggest that it would be premature to declare victory…
… Meanwhile, that view of the Fed is also expressed in the bond market, which saw a major selloff. The yield on 10-year Treasury Inflation Protected Securities (TIPS) has gone back above 2%, while the benchmark 10-year nominal rate is now firmly above 4% again. Both are very much higher than would have been predicted a year ago, and much closer to the top of their recent range than the bottom:
The January CPI overshot expectations by 0.1% and the stock market had convulsions. It's absurd.
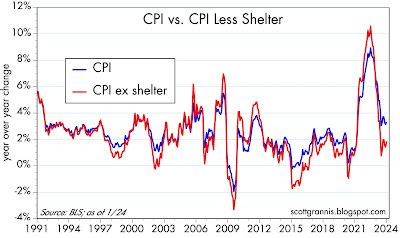
If it weren't for shelter costs, which now comprise 25% of the CPI, the year over year change in the CPI would have been 1.6%, well below the Fed's target and very good news for everyone. But the way the BLS calculates shelter costs has boosted the reported year over year change in the CPI to 3.1%. Over the next 9 months, it is highly likely that shelter costs will fall by more than half, thus subtracting significantly from reported CPI. Meanwhile, the ex-shelter version of the CPI has been very well-behaved.
This is all a statistical tempest in a teapot.
Chart #1
Chart #1 shows the reported change in the CPI (blue line, 3.1%) and what it would have been ex shelter costs (red line, 1.6%).
FirstTRUST: The Consumer Price Index (CPI) Rose 0.3% in January
…Implications: Inflation accelerated at the start of the year, showing that it is still an important problem and the Federal Reserve should not rush into cutting rates. Yes, the M2 measure of money is down in the past year, but that aggregate may not be directly comparable to history and, even if so, the lags are long and variable…Meanwhile, the US economy and labor market continue to chug along. No matter which way you cut it, the Federal Reserve has little reason at this point to start cutting rates anytime soon. How they respond to the incoming economic data in the months ahead could determine whether we repeat the inflationary 1970s.
ING: Sticky US inflation reaffirms Fed caution on rate cuts
US inflation failed to moderate as hoped with housing costs, air fares, medical care and recreation all keeping the run rate for month-on-month inflation hot. Their favoured measure of inflation, the core PCE deflator, may be cooling nicely, but the mixed messages means the Fed can't relax, with little inclination for imminent rate cuts
AND a true story t(r)old by markets TO Fed yesterday …


FED on HOLD, indefinitely......
Smart Money likes pretty Dumb, today.....What were they thinking ????
7 rate cuts, starting in March......a hedge fund fantasy.....
AHAHAHAHA that comment on UBS Donovan