Good morning … especially for those invested in BITC, stocks here AND over there, as in Japan ….
Reuters: Japan government considers calling end to deflation, Kyodo reports
… and another story, nearly 40yrs in the making …
… and while this is all well and good, stealing the hearts and minds of investors, traders and magazine covers (more on that below), these equity moves being overshadowed BY none other than BITC … I’m NOT a fanboy and know what I do NOT know and so I’ll leave that bitcoin and futuristic (I know … the future is now) trading TO the pros and suggest that some of these moves are NOT without a word of caution…
… and in other news AND for NO apparent reason, an updated DAILY look at 20yy which, when I view, I spy with my little eyes, something to SELL, or at least to put on the WATCH LIST as momentum near …
20yy DAILY: momentum (stochastics) crossed BEARISHLY or are on verge …
… support up nearer 4.60% and resistance down closer TO 4.30% …
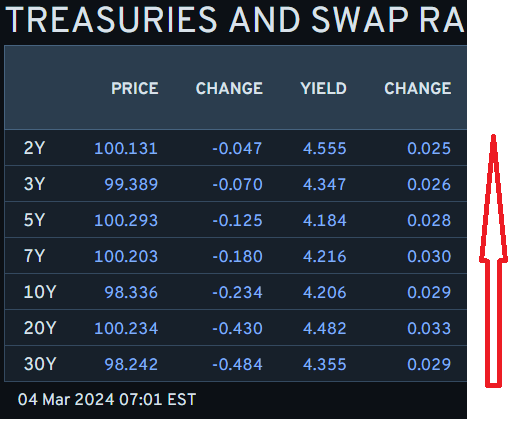
AND … here is a snapshot OF USTs as of 701a:
… HEREis what this shop says be behind the price action overnight…
… WHILE YOU SLEPT Treasuries are modestly lower with the curves a touch steeper amid a quiet start to the week. DXY is little changed while front WTI futures are modestly lower (-0.6%). Asian stocks were mostly higher, EU and UK share markets are mixed/lower while ES futures are showing +0.15% here at 6:45am. Our overnight US rates flows saw a sleepy Asian session with real$ selling of intermediates noted. In swaps, fast$ names added 5s10s flatteners. During London's AM hours, real$ sold the long-end and helped to steepen the curve a touch. Overnight Treasury volume was ~85% of average with 30yrs (109%) seeing the highest relative average turnover this morning, matching our [London] flows…
… At the other end of the curve, TLT's have loosely held support derived by their January low (93.10) and now momentum guides higher and to levels further above said support.
… little bit different look than MY view on 20yy above BUT … noted.
… and for some MORE of the news you might be able to use…
NEWSQUAWK: US Market Open: Equities mixed & Crude softer despite OPEC+ cut extensions, BTC climbs above USD 65k; Fed's Harker due … Bonds are mixed but rangebound, Treasuries underperform slightly
Reuters Morning Bid: Stocks hold records with Powell in view, Nikkei tops 40,000
Finviz (for everything else I might have overlooked …)
Moving from some of the news to some of THE VIEWS you might be able to use… here’s SOME of what Global Wall St is sayin’ … In addition TO what was NOTED THIS WEEKEND (Global Wall Street rantings HERE — BMO stopped OUT short 10s; JPM remains long 5s; MS neutral) …
NFP on Friday will be the week’s key risk event, but with numerous seasonal factors impacting the number, we think markets will take the print with a grain of salt.
Across markets, we continue to advocate strategies to collect carry.
Super Tuesday will return politics to the spotlight. Tune in this week for our US politics call on Wednesday.
… What information matters most? For now, it’s inflation. As per Figure 1, end-2024 Fed pricing has moved nearly 1:1 with 2024 inflation pricing. Here, we continue to believe that market risks around the data are asymmetrically skewed. Given the recent focus on 3m/6m annualized rates of inflation, we think higher inflation prints will dent confidence that inflation will sustainably return down to target, likely resulting in even more cuts being removed from the curve – most probably for 2025. Meanwhile, although lower inflation prints can allow the market to relax about rate hikes needing to be put back on the table, we doubt that such prints result in significantly more cuts being repriced, given the US economy’s current growth trajectory.
… OTHER TECHNICAL DEVELOPMENTS WORTH NOTING US 10y yields: Friday’s slide in yields means that we are testing support at 4.16-4.20% (200d MA, February 15 low, January high). A break below this level will be significant as it would represent a move out of the 4.18%-4.33% range we have seen since February 13. Subsequent support at 4.08% (55d MA).
US 2y yields: The key support level to watch is 4.48% (Jan high), while resistance is at 4.73%-4.77% (200d MA, Dec high).
We're currently on a run that you may not see again in your lifetimes. The S&P 500 last week completed a run of 16 positive weeks out of the last 18 for first time since 1971. If this carries on for another week it'll be 17 out of 19 for the first time since 1964. A remarkable and relentless period of performance…
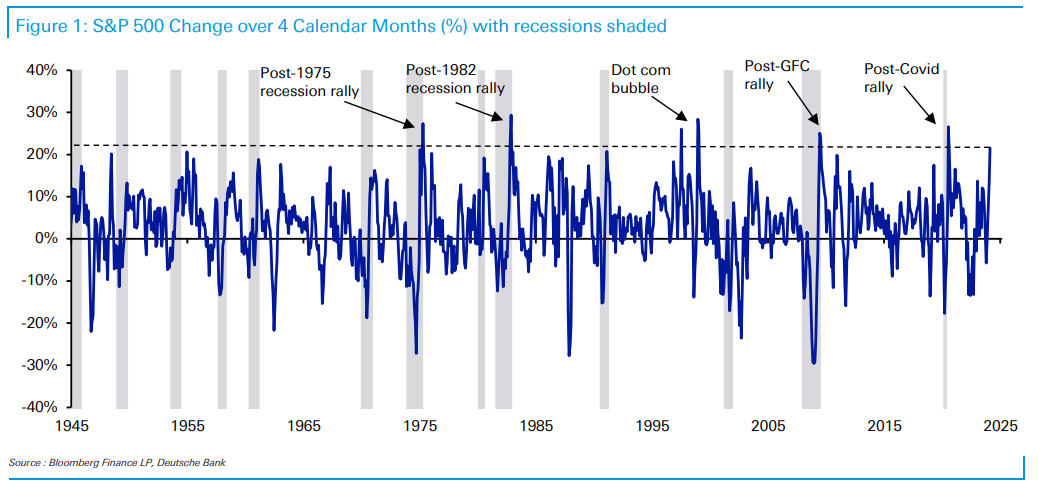
DB: Mapping Markets: Some warnings from history about the current equity rally
The historic equity rally has shown no sign of stopping. For the first time since 1971, the S&P 500 has advanced for 16 of the last 18 weeks. And over the four calendar months since end-October, the S&P 500 has risen by +21.5%.
But since WWII, there are only two scenarios when we’ve seen a rally this fast over four months. The first scenario has been when the economy is emerging from recession, such as after the Covid-19 pandemic or the Global Financial Crisis. The other scenario was during the dot com bubble, when stock markets saw incredibly rapid gains that they proved unable to sustain.
The interesting thing about today’s rally is that it has similarities to both. A recession was the consensus expectation of economists by late-2022, and sentiment was very bearish. So growing hopes for a soft landing led to a significant rally, and there’s a strong parallel to be made with other post-recession scenarios. But then again, the stock market gains over 2023 and into 2024 have been very narrow by historical standards, with tech stocks driving the outperformance. So there are clear parallels to the dot com bubble as well.
…What happens next historically? After these previous strong rallies since WWII, the S&P 500 has actually continued to advance over the next 6 and 12 months on every occasion. However, it’s also worth noting that most of the time that’s because the economy has emerged from a recession, which isn’t happening this time. In the other instance, those further gains happened during the dot com bubble, and substantial declines then followed afterwards.
Conclusion It’s rare to see a rally this fast, and when they happen it’s usually because the economy is emerging from recession and the stock market has just been through a slump. The only time in post-war history that this wasn’t the case was during the dot com bubble.
That might raise fears that this rally is also a bubble. But then again, this also has a clear resemblance to the post-recession rallies of recent history, particularly since a recession was the consensus expectation among forecasters. Given markets are forward-looking, they were clearly going to factor that in, and growing hopes for a soft landing over recent months are having the reverse effect.
Either way, it is rare to see such a sustained period of outperformance. And with 16 out of 18 positive weekly performances for the S&P 500, the index now stands at a joint record since its creation.
The Fed and ECB are recording losses. We look into the mechanics of the balance sheets.
Since Covid, central bank balance sheets expanded substantially, and while policy rates were zero (or negative), the accumulated assets meant that central bank profits skyrocketed. But as policy rates rose, earnings fell, and the Fed and the ECB are among the major central banks with losses.
For the Fed, total assets jumped from $4.2trn in the beginning of 2020 to a peak of $8.9trn two years later. The Fed’s interest-bearing assets are Treasuries and MBS, and it pays interest on some liabilities, namely bank reserves and the reverse repo facility (RRP). Two other key liability items, currency in circulation (physical paper money) and the Treasury’s account at the Fed pay zero interest. The Fed tightened policy by paying higher and higher rates on reserves and the RRP, while the income from the assets stayed essentially fixed. By September 2022, interest expenses outstripped interest income, and the Fed was running an operating loss.
Normally, the Fed makes a profit and remits earnings to the Treasury each week. The Fed does not mark its assets to market, so a loss is only realized if the Fed sells assets outright or net income turns negative. In that case, the accounting is a bit more tricky. Instead of marking down capital, the Fed books a “deferred credit asset” which essentially cumulates the losses each week. The remittances to Treasury resume only after the Fed starts making a profit again and the Fed “pays down” the asset.
Will the Fed return to profitability? Almost surely, and here is a very, very rough demonstration. QT is shrinking both assets and liabilities, reducing the negative income. Currency in circulation is $2.3trn and continues to grow, and in our baseline, the RRP falls close to zero. Just over a year from now, we expect reserves to reach roughly $3.2trn, and the other half of the balance sheet will be liabilities that do not pay interest. As of January 31, the average coupon for the Fed was 2.26%. A policy rate fall (and thus interest on reserves) to 4.5% or below—that is less than twice the coupon, means net earnings will turn positive.
MS Sunday Start | What's Next in Global Macro: Buy the Numbers
We kicked off 2024 by highlighting the three secular themes we think will make the difference between being ahead of or behind the curve in markets – longevity, AI tech diffusion, and decarbonization. Given their potential importance, we pledged to deliver in-depth, cross-asset, collaborative research on each theme over the course of the year. While our work thus far has primarily uncovered insights and opportunities at the sector level, macro investors should take note, as it won't be long before our themes' broader impact becomes apparent. Here are some of the more notable takeaways we’ve uncovered, distilled in key numbers:
… US$140 billion and US$77 billion – these are our colleagues' total addressable market projections for smart-chemo (over the next 15 years) and obesity treatments (by 2030), respectively. In terms of our longevity theme, we see companies increasingly investing in and achieving breakthroughs that can extend life. While the theme will have myriad macro impacts we’re still exploring, the tangible takeaway here is that there are clear beneficiaries in pharma to pursue…
… Simply put…the macro impacts are complicated, but critical to understand. We remain on the case.
It’s a quiet start to a busy week. The ECB makes a policy decision later this week—no one is expecting a change, but it allows for an official statement and ECB President Lagarde will speak. While Lagarde speaking might lack a certain scarcity value, the tone of recent comments from ECB members has tended towards rate cuts being later.
Federal Reserve Chairman Powell testifies to Congress later in the week. Recent Fed speakers have tended to suggest a slower pace of rate cuts than was the case with rate increases. This is logical— rate increases were taking policy from an emergency setting to neutral, and then overtightened. Rate cuts are designed to keep real interest rates more or less stable.
OPEC seems unhappy with disinflation forces and has pledged to extend oil production cuts until June. Against this, non-OPEC production has been increasing, and a poor European ski season (also known as a mild winter) has affected demand.
There is a lot of political noise this week. The US "Super Tuesday" primaries are not likely to move markets (investors have firm assumptions about the presidential candidates). There will be policy speeches at China's National People's Congress—the interesting question is how to improve the quality of growth.
… And from Global Wall Street inbox TO the WWW,
Bloomberg: The Fed isn't gonna carry that weight for gold (Authers’ OpED … noting he talks ‘bout THE magazine cover …)
Double, Bubble, Toil and Trouble… Is there a stock market bubble? The S&P 500 rose above 5,100 for the first time to end the week. But the more persuasive evidence came from The Economist. Business magazine covers are notoriously good contrarian indicators, so this one provoked plenty of interest:
This immediately followed Bridgewater’s Ray Dalio, one of the world’s most influential investors, publishing a piece titled Are We in a Stock Market Bubble? His answer was “not yet.” Old friend James Mackintosh came to the same conclusion in the Wall Street Journal. That so many are asking the question might show awareness of the risks, so we cannot be in the final bubble stages yet. It’s also fair to argue that The Economist cover captures a belief that this rally in stocks is being levitated solely by hot air — in which case, if it’s a contrarian indicator, it could even be a bullish one. But it’s noticeable how many people suggest that a bubble is forming, and that this isn’t one yet. To quote Peter Atwater of Financial Insyghts, a veteran sentiment-watcher:
With Dalio and now Mackintosh concluding, “It’s not a bubble YET,” we could soon see a rush of cash into the market. Nothing creates a bubble like the crowd’s simultaneous and collective belief that a bubble is still yet to come. Still, I can’t help but wonder if Mr. Dalio and Mr. Mackintosh have just said the quiet part aloud. It’s hard to look at the stock price of Nvidia without thinking that everyone already thinks the best is yet to come.
What are the arguments that this isn’t a bubble thus far? Valuation was much more overdone just three years ago, peaking during the meme stock madness. As the chart shows, the Magnificent Seven stocks and the Nasdaq 100 were far more extended then than now. Nothing as absurd is around at present, with excitement conservatively centered on the biggest companies with the biggest profits. If we use trailing price/earnings as a gauge, the Magnificent Seven are much more closely aligned with the broader market than three years ago — and the S&P 500, on an equal-weighted basis, still looks very much cheaper:
Another argument that we’re not there is in the relatively subdued amounts of margin debt. Several readers have pointed out that options activity, particularly in the form of ODTE options that effectively bet on one day’s performance, could be creating more leverage. Dalio suggests otherwise. Single stock option volume in calls (betting on stocks to go up) has recently risen sharply. It’s still nowhere near the heights reached during the meme stock bubble:
In the Magnificent Seven, options activity looks plum average. For all the excitement and money that the Magnificents are creating, the numbers trying to bet on them with options are unexceptional:
If a bubble is forming, it might not be directly visible in financial market prices. Many standard measures suggest the market is not as overblown now as three years ago, let alone at the top of the dot-com bubble in 2000. The exception is the multiple of sales at which the tech companies are trading, now at an all-time high:
If multiples of revenue have increased this much, it suggests great confidence in profit margins. Several of the tech giants have delivered impressive results of late, which brook no argument. If there’s a bubble, it might be in the profitability that Big Tech is currently recording. Is it really sustainable? For the time being, however, the view is that a bubble is forming, and has further to go. The greatest risk to it comes from rates:
Will the Fed Cut Rates This Year? Bubble scenarios tend to be built on rate cuts — cheaper money has been a vital catalyst for history’s investment bubbles. Both the Fed and the fed funds futures market currently expect three rate cuts this year. But what if the Fed doesn’t cut at all? Torsten Slok, chief economist at the Apollo Group in New York, had the nerve to put his head over the parapet and predict that they won’t. All of his arguments are based in the economics. I summarize as follows:
The economy isn’t slowing down, it’s reaccelerating. The Fed’s “pivot” toward lower rates in December eased financial conditions (without the central bank doing anything).
The labor market remains tight, jobless claims are low, and wage inflation is sticky between 4% and 5%.
Small businesses say they’re planning to raise selling prices and workers’ pay.
Manufacturing and services ISM surveys show a higher trend in prices paid.
Asking rents are rising again, as are home prices.
Financial conditions are easing.
This is a pretty cogent list. I’d add that politics (the later they wait, the harder it is to cut as the election approaches), and the Fed’s natural desire to avoid repeating historic mistakes (cutting too soon led to more inflation in the 1970s, and to the bubble at the end of the 1990s) stack the deck further against cuts. It’s possible that the very startling Powell pivot was an ingenious attempt to loosen conditions without taking great reputational risk of starting the cutting process.
This year has 10 more months to run. If the labor market and inflation data start to turn, and particularly if there is a financial crisis of some kind, then the picture changes again and we can expect cuts. But I think Slok is right that at this point, it’s not clear we should expect any cuts at all. Which would be bad for the gold price, but might also help head off a bubble…
Discipline Funds: Weekend Reading Magazine Covers and Market Caps (magazine cover STUDY and visual caught MY attention …)
…3) Bearish Magazines. There’s an old theory that magazine covers tend to be a contrarian indicator. Ah, if only it was that easy. The story is always more complex than pure sentiment and as the old saying goes, “markets can remain irrational longer than you can remain solvent”.
Still, it’s interesting in the context of the last few years because the S&P 500 is only up 11% since 2022. Factor in inflation and that return is actually negative. So it might feel euphoric because of the last 12 months, but maybe it’s not that euphoric. Then again, you do have signs of frothiness and high valuations. As an individual asset class I try not to waste too much time obsessing over the short-term performance of stocks. They are, as I’ve often noted, inherently long-term instruments that should mostly bought and ignored.
But an old study that was reported in, awkwardly, The Economist, found that after 360 days the bearish covers generated 18% returns and bullish covers were followed by -7.5% returns. And frankly, perhaps the very best thing that could happen to this stock market rally is that it dies down a little. After all, if we get really euphoric the Fed is going to have to respond and if they move higher from 5.5%, to say, 6 or 7% then things are going to get really interesting. And probably not in a good way.
… wo hyped developments of late are the boom in artificial intelligence (AI) technologies and the emergence of GLP-1 drugs. Both are innovations that are expected to have far-reaching implications.
This past week came with bullish Wall Street research on each.
Here’s Morgan Stanley on AI (emphasis added):
… there is a notable amount of overlap among the industries discussing operational efficiency most prevalently and those that have the potential to realize more significant AI-driven efficiency gains based on the new framework we introduce in this report. … We see AI-driven productivity adding an additional 30 bps to 2025 net margin for the S&P 500 (13.0% net margin in the base case) though we believe risk is skewed to the upside/our bull case in this respect — 50 bps of added impact.
One of the biggest stories in the stock market in recent years has been the persistence of historically high profit margins. AI could prove to be a key tailwind that enables companies to turn a little bit of revenue growth into a lot of earnings growth.
Here’s Goldman Sachs on GLP-1 drugs (emphasis added):
… GLP-1 drugs could significantly reduce obesity, and obesity-related health complications subtract 3% from per capita output according to academic estimates. Under reasonable estimates for uptake and effectiveness, we estimate that GLP-1 drugs could raise GDP levels by 0.4%, with the effect rising to 1% if the number of users reaches the 60mn benchmark our equity analysts see as possible.
This is also encouraging, especially as some of the major economic tailwinds of late fade and GDP growth cools.
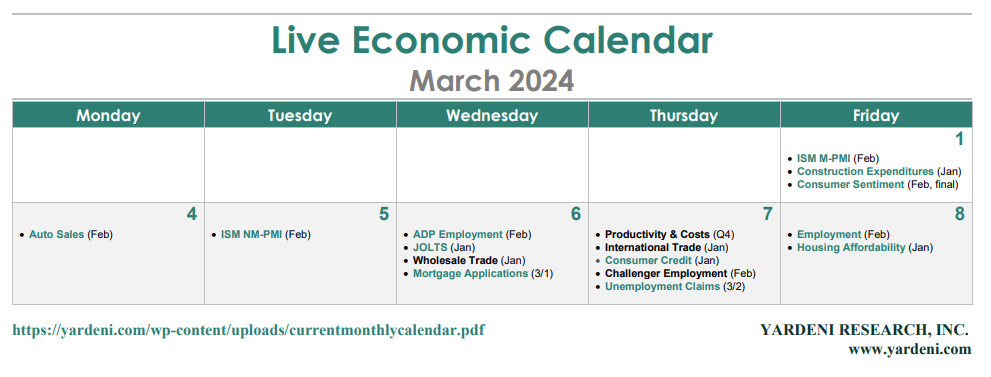
… AND finally, for those who fancy yet another / different economic calendar, in addition TO what was NOTED THIS WEEKEND …
I overhear Ozampic conversations at work, it's really just a Hunger Suppressant, w/some nasty, potentially Life-Ending side-effects. Guess I'm old girls just used to do some Speed/Meth/Crystals to loss wt & fit in that tight dress, at least they did when I saw Alice in Chains in 2015 :)
Gold AND The Bitcoin off to the races today you rarely see that....although BTC is up over 6% today vs Gold's 1-something %, which means the Laser Eyes should be OK but 1 never knows. Mabey Gold needs a Halving? They can have their Blockchain I'm sticking w/my Pet Rock!
I saw something crazy, more than half of retail BTC traded is Fractional BTC....I don't hear about Fractional Amazon shares anymore what gives?!