while WE slept: USTs 'modestly' higher, curve 'a hair' flatter on LIGHT volumes; CPI precaps first to be followed by victory laps; NYFed on UST market DEPTH
Ahead of this mornings CPI, there should be little to add as rates and equity futures are largely UNCH, awaiting further marching instructions. With that in mind, a quick topical peek at 2yy (a front-end rates reflection of what has happened in effort to glean something as far as what next) …
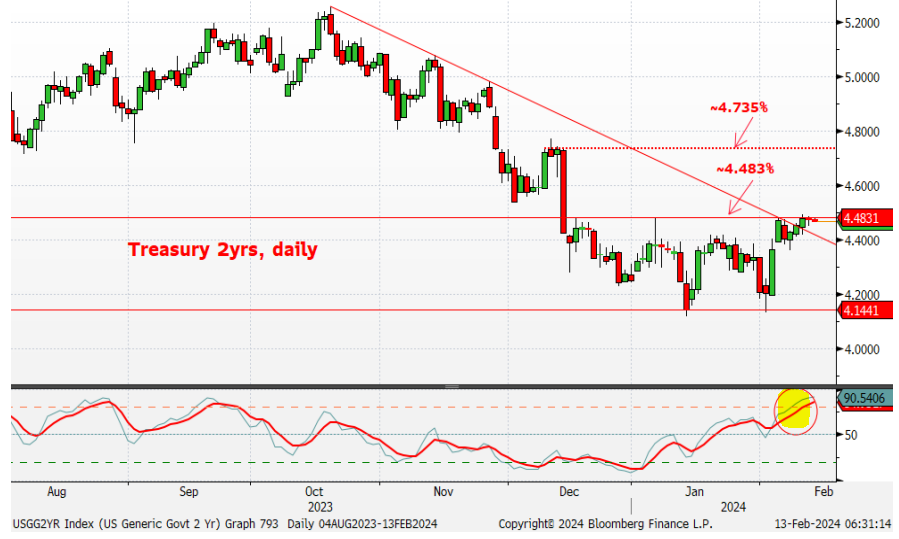
2yy DAILY: bullish momentum (ie OVERSOLD), broken TLINE, support nearby
… WHY I’ve chosen to focus on more bullish DAILY is mostly because all the popular kids ARE expecting CPI to decline and so, a soothing rates backdrop which then would also be wind in the sails of risk (even beyond Mag7). Now if one were to think buying here (or on some sorta dip) made sense, I’d keep 4.60% in mind as it was a level noted from LAST March (SVB gapping lower) and may be an interim speedbump if we DO begin to press higher.
Which was noted as more likely on WEEKLY chart offered HERE this past weekend (when it was noted a close in / around 4.50% was worth keeping in mind) ... CPI will lead the way and so lets jump in … here is a snapshot OF USTs as of 702a:
… HERE is what this shop says be behind the price action overnight…
… WHILE YOU SLEPT Treasuries are modestly higher with the curve a hair flatter ahead of CPI this morning. DXY is modestly lower (-0.1%) while front WTI futures are a touch higher (+0.65%). Asian stocks that were open were mostly higher, EU and UK share markets are mostly lower (SX5E -0.85%) while ES futures are showing -0.37% here at 6:45am. Our overnight US rates flows saw a mild downtick during Asian hours before prices firmed during London's morning session. We saw net better selling in the belly and real$ interest further out the curve. Overnight Treasury volume was ~87% of average all across the curve...
… We posted and chatted about Treasury 2yrs recently and their 4.483% support level. This morning's fresh update makes it look like locally 'oversold' 2's are waiting for permission to see what's above 4.48%, lol.
Appears to ME we’re all reading it same way … and for some MORE of the news you might be able to use…
NEWSQUAWK: US Market Open: Equities softer as US CPI looms, GBP bid post-jobs data & CHF lags after cooler CPI, Crude firmer … Bonds are divergent, with USTs in a holding pattern ahead of US inflation, whilst Gilts were pressured on the regions jobs/wage data, since pared
Reuters Morning Bid: Nikkei and Nasdaq stalk records, CPI lurks (VISUAL, “Investors reduce bets on central bank rate cuts)
Finviz (for everything else I might have overlooked …)
Moving from some of the news to some of THE VIEWS you might be able to use… here’s SOME of what Global Wall St is sayin’ … and WHY they choose to give us a preview within 12-24hrs of the print only to have to go right back TO the narrative drawing board just after and recreate … AND then combine with their uncanny ability to spin as I TOLD YOU SO … well this all never ceases to amaze me … (DB does offer some context worthy of note)
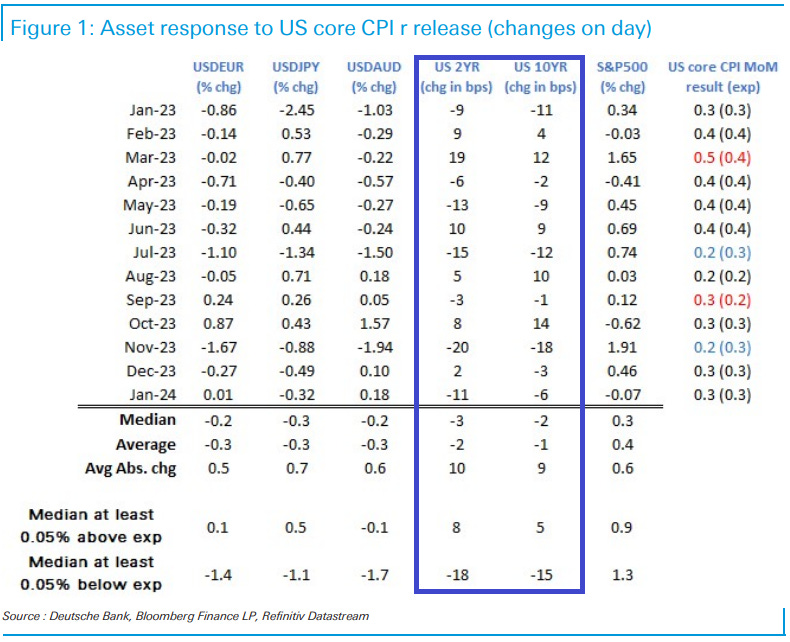
DB: Trading the CPI report (read entire report for what happens a week out)
As per Figure 1, for the last ten CPI releases, we have had seven as expected numbers (when rounded to one decimal place), two downside surprises, and one upside miss. CPI rarely misses by much, but the market reactions are often sharp and dependent not least on the breakdown.
Expect a sharper reaction to 0.4% core CPI even if such a number fits with the grain of recent strong data surprises, but with a solid reaction also to a lower than expected number, because it provides a reawakening and fresh avenue for the rate bulls to pursue.
On soft data, carry is likely to outperform, as it fosters the perception that the US can play the role of global locomotive, without engendering an acceleration in inflation, and risks of renewed Fed tightening…
We expect a 0.38% increase in January core CPI (vs. 0.3% consensus), corresponding to a year-over-year rate of 3.90% (vs. 3.7% consensus). We expect a 0.20% increase in January headline CPI (vs. 0.2% consensus), which corresponds to a year-over-year rate of 3.03% (vs. 2.9% consensus). Our forecast is consistent with a 0.45% increase in CPI core services excluding rent and owners’ equivalent rent and with a 0.29% increase in core PCE in January. We will update our core PCE forecast after the CPI and PPI are released…
… The January report will also incorporate two annual methodological changes to the CPI. First, the CPI will feature updated seasonal factors, which the BLS revised last week. The revisions boosted month-over-month core CPI inflation by 1.5bp in January 2023, suggesting that a given non-seasonally adjusted reading would be slightly higher on a seasonally adjusted basis in this month’s report. Second, this month’s CPI will be calculated using updated weights for 2024. The new weights will likely be somewhat inflationary, as the weight on owners’ equivalent rent—where inflation is likely to remain above overall core inflation— will increase by 0.8pp, while the weight on new and used cars—which have turned deflationary—will decrease by 0.7pp each.
Going forward, we expect monthly core CPI inflation to come down to 0.15-0.20% as the start-of-year effect fades. We see further disinflation in the pipeline from rebalancing in the auto, housing rental, and labor markets, though we expect a small offset from a delayed acceleration in healthcare. We forecast year-over-year core CPI inflation of 2.9% and core PCE inflation of 2.2% in December 2024.
The Truth About Inflation is a complex subject, worthy of a book. The challenge for economists with today’s US consumer price data is stripping away the fiction to get at the reality. The largest part of the consumer price index is owners’ equivalent rent, which rose 6.3% in December. It is a price no one pays, and it means middle-income homeowners have a lower cost of living increase and thus more spending power.
Of note in the detail today will be evidence of profit-led inflation continuing to retreat (the transitory durable goods price inflation has been in deflation for 13 months, and is not a focus). Food prices may also matter because these are a political focus. So-called “shrinkflation” is captured by the data. Rounding up of prices has been prevalent, and can be seen in the very rapid vending machine inflation…
UBS: CTAs' Latest Positioning and Flows - Biweekly Update
CTAs' inflows into stocks and USD should moderate from here but not reverse. Bonds are likely to remain under CTAs' selling pressure as outflows could intensify … CTAs have halved their duration risk in 2024 and we expect the outflows to continue/intensify in the near term. Based on our forecasting model, CTAs' reaction function is clearly skewed toward more selling …
… Levels to watch on UST 10y (TY) If we take the example of simulation 8, it shows the UST 10y would rally linearly from 4.16 to 3.83 (33bps rally, Figure 13UST 10yimulated Yilsand Figure 14UST 10yimulated Chngs(bp) over the next 2 weeks. After 7 business days, UST 10y should be at 3.93 (-23bps) and as a result, the signal would move from -0.02 to +0.13 (Figure 15UST 10yExpectd Signal, respont imulaed yis), i.e. a +0.14 change in signal (Figure 16UST 10yExpectd Changei Sl,nrespo timulaed yis). CTAs' position in UST 10y would switch from $+0.31 DV01mn to $+2.36 DV01mn (Figure 17UST 10yExpectd Posin($DV01 mn),irespon timulaed yis), i.e. a buying flow of $+2.67 DV01mn (Figure 18UST 10yExpectd Flows($DV01 mn),irespon timulaed yis). Extrapolating the UST 10y change in signal to all bond futures, we get a total bond future flow of $+29.00 DV01mn (Figure 19Total BndFutre ExpctdFlows ($DV01mn), irespon timulaed yis)
… And from Global Wall Street inbox TO the WWW,
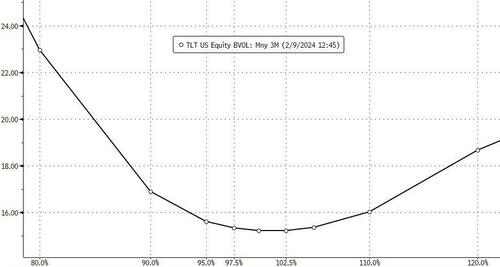
Bloomberg (via ZH): Inflation Uncertainty Leaves Global Bonds On Thin Ice
… Bonds have been trading with a negative skew, shown for the TLT (ETF of long-term USTs) below, which means that poor liquidity is more likely to lead to lower prices, higher yields.
This comes at a time when there are compelling signs of a cyclical upswing in global growth.
The combination of supported growth, receding US recession risk, heightened inflation uncertainty, and a deterioration in bond liquidity is a complete recipe for higher bond yields.
The risk is compounded when taking account of the rarefied view that US bond yields – which have a significant influence on DM yields – will move much higher this year, according to bank surveys.
Bloomberg: 5 Things You Need to Know to Start Your Day (Asia with visual of equities leavin’ bonds in the dust…)
Equities and bonds are diverging in the US after they went up and down together in the second half of last year. That highlights the narrative that the Federal Reserve will indeed meet its goal of delivering a soft landing for the economy this year as inflation wanes and the labor market remains modestly strong — enough to avoid a surge in joblessness even as a wage-price spiral is avoided.
For stocks, the end to interest-rate hikes and the promise that the next move is down seems to be more than enough to underpin gains, especially as the latest earnings season came in stronger than many had forecast.
Bonds are stuck in a funk because investors in the asset class had palpably expected rapid and deep rate cuts that look to be well and truly off the menu. Even a substantial downside surprise for inflation figures later on Tuesday could fail to spark a sustained rally, unless Fed officials respond by signaling that they are now open to easing policy sooner. That would seem to be an unlikely outcome — by now, the economy’s resilience means slower inflation is only a necessary ingredient for rate cuts, without being sufficient on its own to drive them.
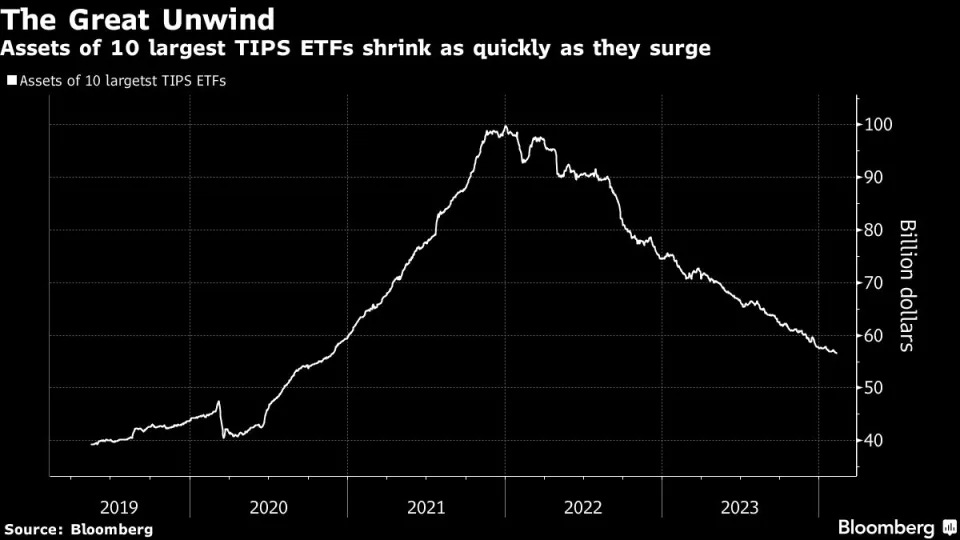
Bloomberg: Great Inflation Hedge Unwind Sees TIPS ETFs Lose $43 Billion
Outflow shows reduced need for hedge as Fed cools inflation
Retail investors yanked money after record TIPS losses
The great market inflation hedge of the pandemic era is officially over.
Between cash outflows and capital losses, the combined assets of the 10 largest US exchange-traded funds that focus on inflation-linked bonds have tumbled from a peak of more than $99 billion in early 2022 to around $57 billion. That’s about what they held in late 2020, before the outbreak of the nation’s first major consumer-price surge since the early 1980s.
The pullback underscores how confident investors are that the Federal Reserve has brought inflation back under control. That’s expected to be evident Tuesday, when economists predict the Labor Department will report that the annual increase in the consumer-price index pulled below 3% for the first time in roughly three years. In June 2022, it was rising at about three times that pace…
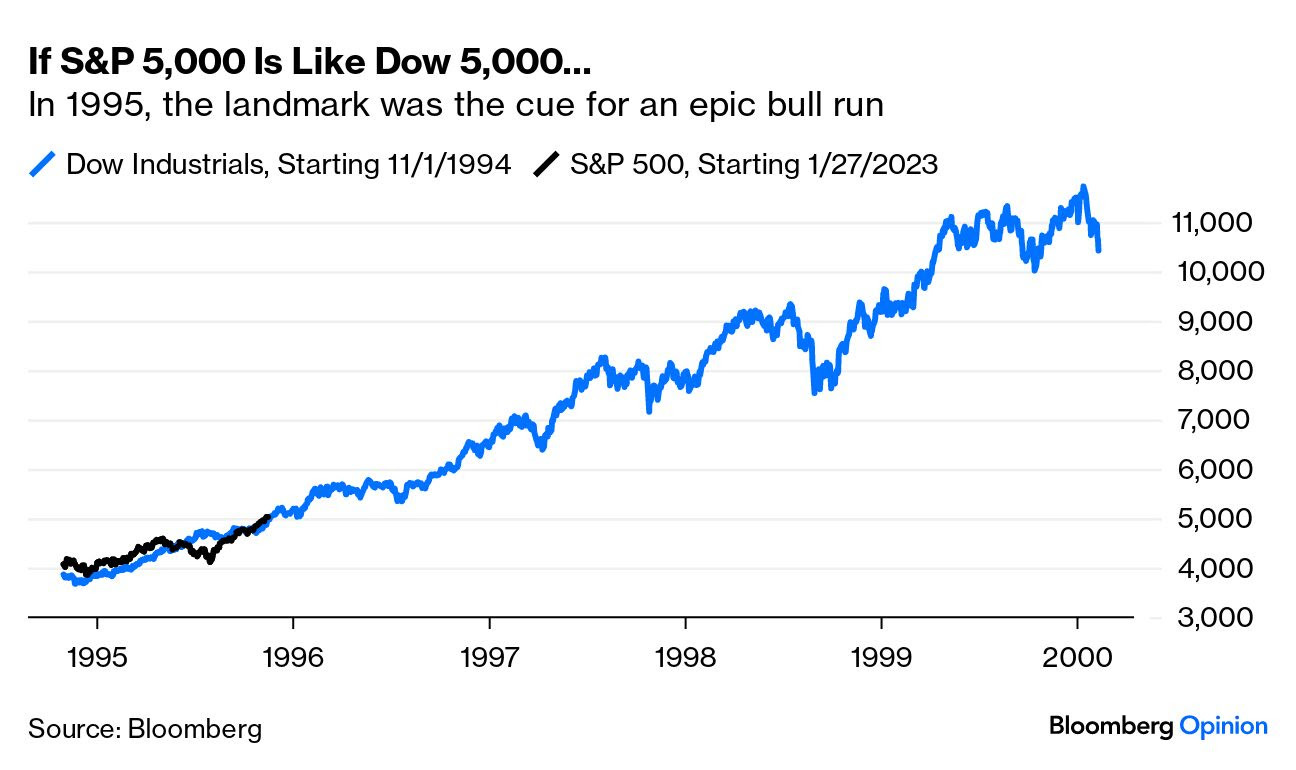
Bloomberg: C-Day landing is the moment of truth for markets (Authers’ OpED with overlay of DOW from 1990s vs S&P today)
…From S&P 5,000 to… Infinity and Beyond? The S&P 500 topped 5,000 for the first time ever last week, and is still there a trading day later. Big round numbers like these shouldn’t matter — but of course they do. As Bloomberg Opinion colleague Jonathan Levin points out, when the Dow Jones Industrial Average first hit 5,000 in late 1995, it was a cue for an extraordinary bull market. It took barely three years to double, and then surged from 10,000 to 11,000 in a month. To be clear, the Dow was far more widely cited in the media than the S&P, even now when the rise of indexing has made the latter index hugely important. Mathematically, each extra thousand-point increment involves a smaller percentage increase, and is therefore easier to achieve, but the succession of landmarks stoked excitement and gave many the impression that the market was doing even better than it really was:
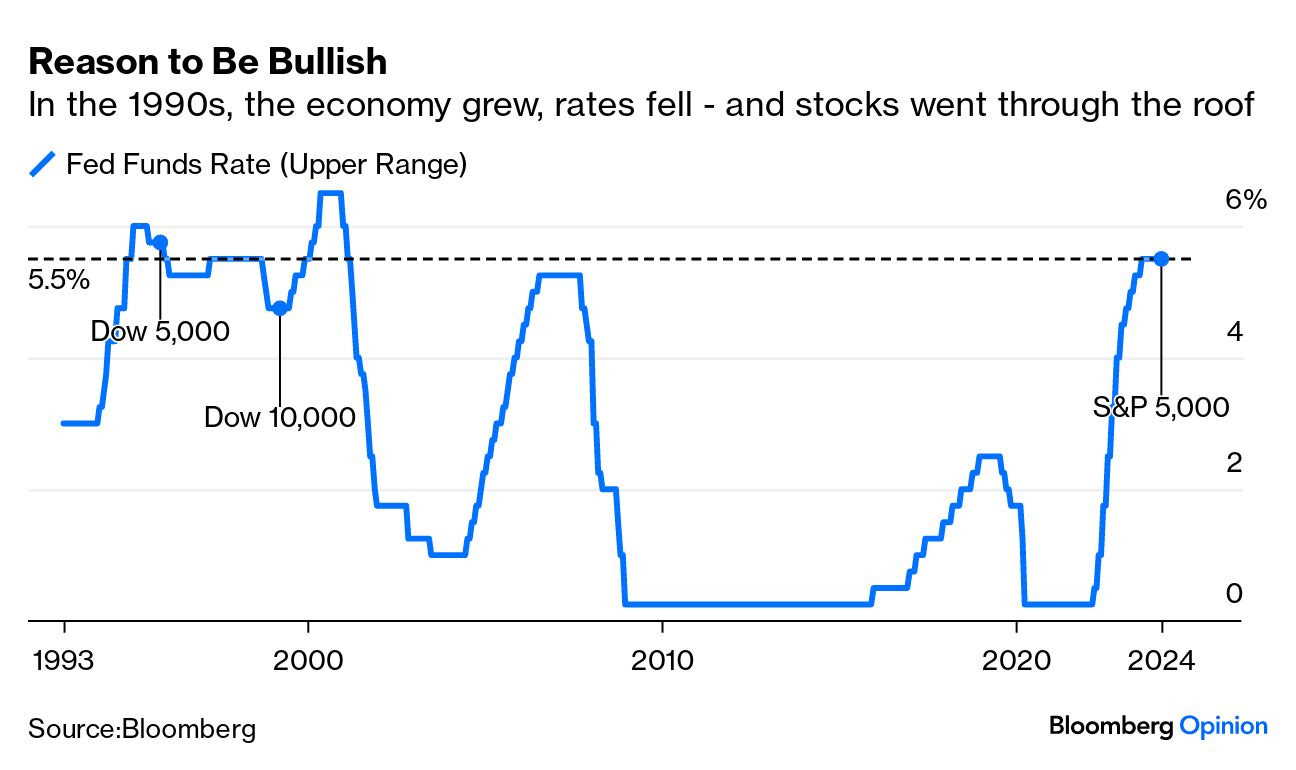
Could this happen again? If the market is right in its hopes for steady rate cuts even as the economy expands, it just might. The last five years of the 1990s offered one of the most stable rate environments on record. The Fed under Alan Greenspan hiked the fed funds rate by 25 basis points to 5.5% early in 1997, in the wake of his famous warning of “irrational exuberance” in stocks. Even though markets grew ever more exuberant in the years that followed, the Fed didn’t raise rates above 5.5% until the first month of the new millennium. There werevarious reasons why rates stayed flat during one of the greatest economic expansions on record. Suffice it to say that this was unusual. If the economy is booming, you’d expect the Fed to be trying to keep it on the rails.
This is where the crucial similarity between Dow 5,000 and S&P 5,000 comes in. If the current consensus is right, we have economic expansion and lower rates to look forward to, all starting from an all-time high:
This points to why the inflation figures matter so much…
Liberty Street Economics: Measuring Treasury Market Depth (when the NY Fed speaks, usually a good idea to slow down and listen)
A commonly used measure of market liquidity is market depth, which refers to the quantity of securities market participants that are willing to buy or sell at particular prices. The authors review the many measurement decisions that go into depth calculations and show that inferences about the evolution of U.S. Treasury market depth, and hence liquidity, are largely invariant with respect to these decisions.
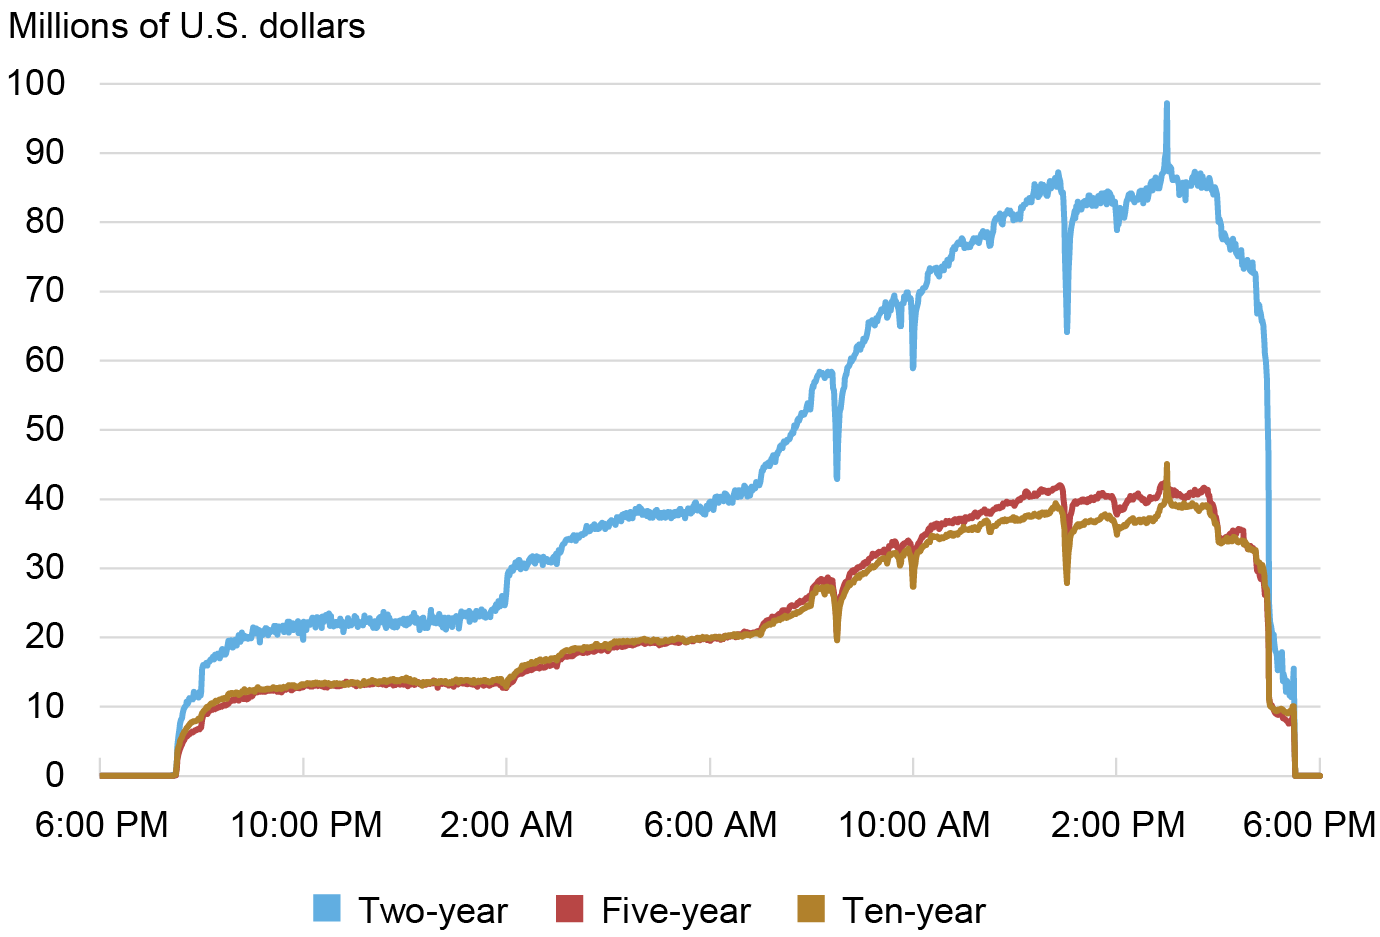
…Treasury market depth for certain securities can be observed in the interdealer broker (IDB) market, in which dealers and certain other market participants trade among themselves. IDBs operate central limit order books, which collect and consolidate trading interests from platform participants. A snapshot of an IDB’s standing limit orders for a particular time and security is plotted below. It shows that platform participants stood ready to buy $35 million of the on-the-run (most recently auctioned) five-year note at the best bid price and sell $14 million of the note at the best ask (or offer) price. Additional buy (and sell) quantities were available at slightly lower (and higher) prices.
…Order Book Depth Plunged in March 2020 and March 2023
…New York vs. Global Trading Hours A third consideration when summarizing depth is the trading hours over which depth is averaged. Treasuries trade nearly round the clock during the week, as described in this Economic Policy Review article. Liquidity is appreciably better (and trading activity higher) during the more active New York trading hours, roughly 7 a.m. to 5 p.m., as shown in the next chart. It follows that average daily depth is higher if the calculations are done over New York trading hours only (as they are in this post). That said, the time series patterns of average daily depth are virtually indistinguishable whether depth is calculated over New York trading hours or the full global trading day.
Depth Is Higher during New York Trading Hours
…Summing Up Many decisions go into the calculation of market depth from order book data. Although these decisions have meaningful effects on the average level of computed depth, they have little effect on inferences about Treasury market liquidity made from changes in daily depth over time. Whether it’s bid vs. offer side, inside tier vs. many tiers, or New York hours vs. all hours, market depth has been challenged in recent years by the pandemic, bank failures, and interest rate uncertainty generally, and bears watching (along with other liquidity measures) going forward.
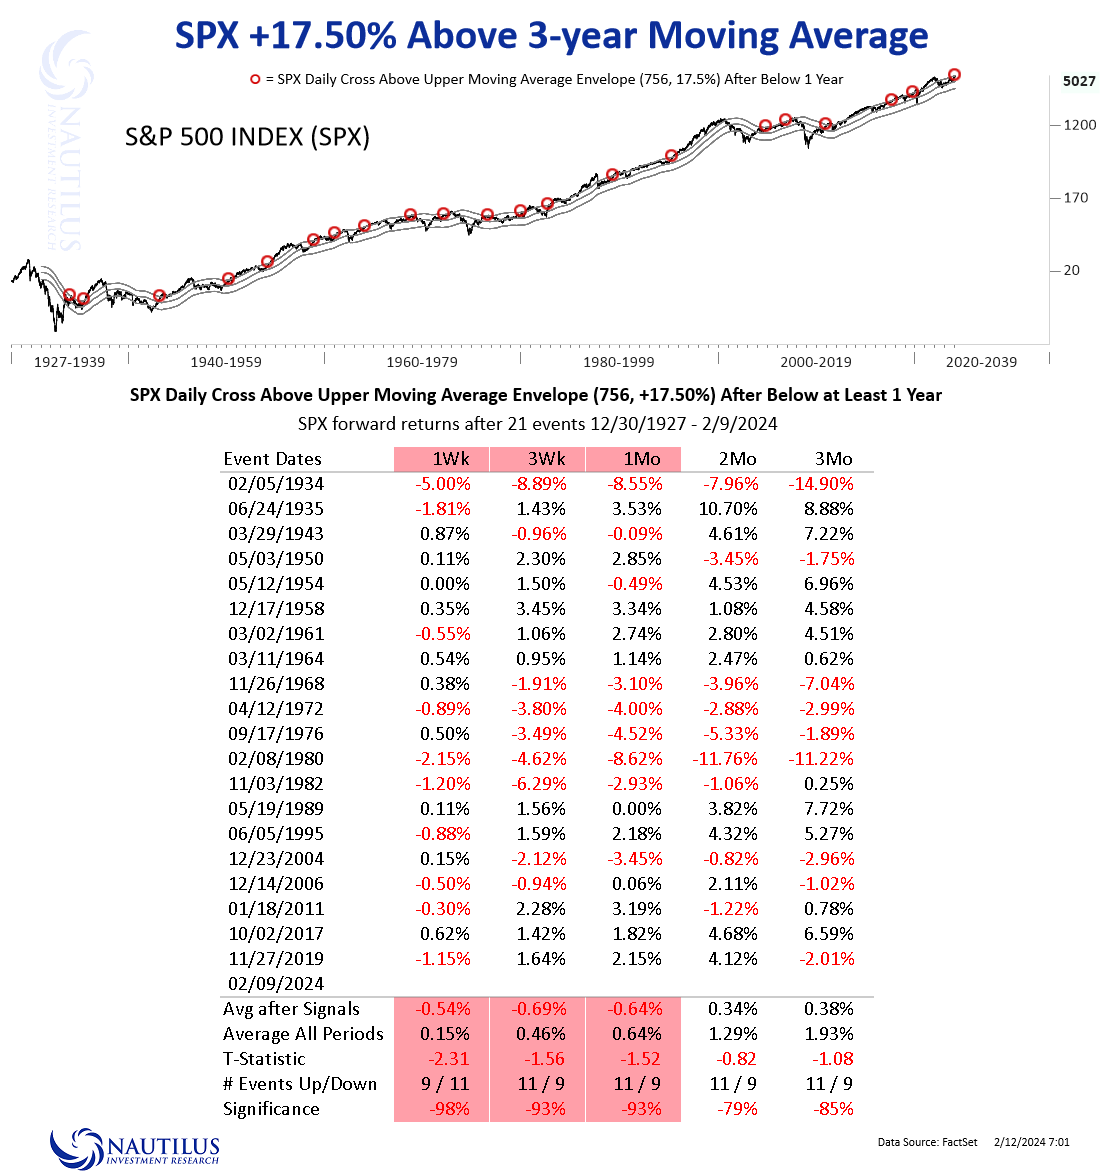
Returns When S&P 500 Closes > +17.50% Above 3-year Moving Average
In essence, a robustly performing index typically maintains a position significantly above its long-term moving averages, contrasting with periods where it struggles to sustain gains. Many of our past posts on Subtack have highlighted milestones in momentum, suggesting further upside potential. However, it's crucial to note that our intention here isn't to insinuate an imminent danger for the SP500. Rather, we find ourselves in a less common territory, where we are entering thinner air.
Historical analysis indicates that when the SP500 closes more than 17.50% above its 2-year moving average, momentum tends to taper off in the short term. Therefore, while it has been undeniably challenging to bet against U.S. equities since the lows of October 2023, it may now be prudent to consider a period of consolidation.
ZH: 3-Year Inflation Expectations Tumble To Lowest On Record, As Earnings Expectations Suddenly Surge
And for any all interested … TODAY ONLY (until next storm…)
FREE SNOW SHOVELING CLASS: This afternoon I will be holding a FREE snow shoveling class in my driveway. Come and join the class and learn about the proper ways to shovel. Reviewed techniques will include the scoop and throw method, the down and push method (AKA the plow technique), as well as the upside down scraping technique. Don't miss out on this amazing opportunity to enhance your snow lifting techniques without throwing your back out! I will provide the driveway and multiple walkways to ensure your training is conducted in the most life-like situation, I only ask that you bring your own shovel (Ergonomical designs suggested). Spaces are limited and handled on a first come first served basis.


I knew a guy who bought a tractor to capitalize on the 'clearing the driveway of snow' business :)