while WE slept: USTs mixed / flatter on ~90% avg volumes; a bearish techAmental setup; a coming shutdown; stocks UP 15 of last 17wks (only happened 1x in last 50yrs...)
This past weekend I offered up a couple visuals (2s and 5s — daily and WEEKLY — pick / choose one for your specific timeframe) for you to mull over ahead of today’s double header of UST SUPPLY.
With very little happening overnight AND for somewhat more on 2s (and 10s) specifically, see CitiFX just below where they remind …
… Yields are testing resistance at 4.69%-4.77% (200d MA, double bottom formation indicated target and Dec high). Given the strong resistance at this area, we think 2y yield upside could be limited…
REMINDER — DEC highs nearer 5.25% and if / when we were to revisit those levels, I’d bet 10s up nearer 4.50% which seems to be magical level for Global Wall to suggest buying — either to get long and / or cover short — noted over the weekend HERE) … and with that, we’ll move on and get right TO a snapshot OF USTs as of 712a:
… HEREis what this shop says be behind the price action overnight…
… WHILE YOU SLEPT Treasuries are mixed with the curve a hair flatter overnight ahead of double-barreled Treasury supply today and Thursday's PCE data. DXY is lower (-0.16%) while front WTI futures are too (-0.5%). Asian stocks were mixed, EU and UK share markets are also mixed while ES futures are UNCHD here at 7am. Our overnight US rates flows saw Treasuries trade firm during Asian hours. But after the London crossover, there has been little follow-through with our flows mixed (some real$ demand for 20's plus light interest in 5s10s steepeners). Overnight Treasury volume was ~90% of average …
… 2's held their range support near 4.735% (drawn in) like a champ on Friday. However, the still deeply 'oversold' momentum study has yet to flip bullishly as the recent flattening of the curve means that longer maturity instruments are ahead of 2's in generating new bull momentum signals. As an example, our fourth attachment of Treasury 30yr yields shows the clear bull momentum signal after it held range support near 4.47% on last week, leaving the support behind on Friday. Put the 2yr and 30yr charts and their momentum studies together and... it seems like the tactical winds still blow favorably for flattening curve expressions. Anyway, let's look at Treasury 5's in our second attachment where we can see a few interesting developments: 1) 5yr yields are back below their 1H December range highs, 2) Friday's price action traced out a bit of a reversal candle with a new move high in yields rejected while Friday's close was below Thursday's rate low and 3) if you squint you can see the emergence of a possible bull momentum signal (lower panel, circled) off the deep 'oversold' readings of the past few weeks...
… and for some MORE of the news you can use » The Morning Hark - 24 Jan 2024 and IGMs Press Picks (who CONTINUES to be sportin’ that new, fresh look) in effort to to help weed thru the noise (some of which can be found over here at Finviz).
… and for some MORE of the news you might be able to use…
NEWSQUAWK: US Market Open: Equities slip & USD pressured modestly as newsflow slows after a busy weekend … Contained start with specifics light into ECB’s Lagarde for EGBs while USTs await US supply, Gilts modestly outperform
The better LNY holiday data suggest some sequential recovery in Q1, though property remains a key risk. We note restrained post-reopening consumer spending patterns, and more signs of deflation expanding from goods to services. Meanwhile, we take improved credit data with a pinch of salt.
We think US policymakers remain on track for a first cut in June, but we think rates vol offers an attractive hedge to the risk that rate cut expectations reduce further from here.
With the risk rally remaining on track, we have added to short EUR carry and short EURUSD gamma, and upgraded our outlook for GBP, while hedging higher rates risk through ULC payer spreads in US rates.
In the coming week’s US data, we think January PCE is likely more significant than the second print of Q4 GDP. Beyond data prints, attention will likely increasingly focus on Powell’s Capitol Hill testimonies on 6-7 March.
US 10y yields have posted an outside day off resistance at 4.33% (Feb 14 high).
Why it matters: This is a reversal indicator, suggesting we may be in for lower yields. However, downside may be limited with multiple layers of support nearby, with the closest at 4.14%-4.19% (Jan 19 high, Feb 15 low, 200d MA).
Taken in to context, we think techs suggest that we could range between 4.14% - 4.33% this week. Check out my colleague Stephen Spratt’s weekly Coffee break series on why investors may be reluctant to be short rates despite solid US price data.
Longer term: Double-bottom techs setup continue to suggest we could see a renewed US rates selloff, with 10y yields potentially rising another 30+ bps.
Technical indicators:
Double bottom formation with neckline at 4.2%, and a formation indicated target of ~4.58%. We saw a second weekly close above this level.
Bounce off resistance at 4.33% (Feb 14 high), while posting a bearish outside day.
Charts
OTHER TECHNICAL DEVELOPMENTS WORTH NOTING US 2y yields: Yields are testing resistance at 4.69%-4.77% (200d MA, double bottom formation indicated target and Dec high). Given the strong resistance at this area, we think 2y yield upside could be limited…
… Back to the US, we have new (today) and pending (Thursday) home sales with the focus on whether higher mortgage rates and bad weather in January has had a big impact. Then we have durable goods and consumer confidence (tomorrow), the second reading of Q4 GDP on Wednesday, the personal income and spending data (Thursday), and the ISM manufacturing data as well as unit auto sales as we close out the week by welcoming in a new month on Friday. Friday is also the day that we could see a partial government shutdown if Congress fails to pass the 2024 budget that has already been agreed to. Our economists think that it's possible we get a short-term continuing resolution for an extra week which would push it past the "Super Tuesday" primaries on the 5th and coincide with the deadline for the second tranche annual funding bills. See their latest election state of play here. There is also a fair degree of Fed speak which you can see in the calendar at the end as usual alongside all the other data. Chinese PMIs on Friday might be the most interesting non-US data, and should include the lunar new year holidays in the sample period, so one to watch.
Since late-October, markets have been on an astonishing rally. Several major equity indices are at all-time highs, including the S&P 500 and the STOXX 600, whilst the Nikkei even surpassed its previous peak from 1989.
But we’re now at a point where this rally is incredibly unusual by historical standards. For instance, the S&P 500 has now advanced for 15 of the last 17 weeks, which has only happened one other time in the last 50 years, back in 1989. And if the index were to post a further gain this week, it would mark 16 out of 18 positive weeks for the first time since 1971, and also be a joint record.
In light of this, we take a look at how this rally is almost unprecedented by historical standards, along with some of the drivers and potential vulnerabilities it faces…
MS Sunday Start | What's Next in Global Macro: The Fed…Before and After the Election
January’s FOMC meeting, labor market data, and inflation data have all pushed the market from pricing nearly 200bp of Fed rate cuts starting in March to broadly aligning with our view of cuts starting in June and cumulating to 100bp at the end of the year. But between now and year-end comes the election…a fact that has driven client questions about the implications for Fed independence…
… Overall, we are highly convicted that Fed policy this year will not be swayed by the fact of the election. The place simply does not work that way. And for the first year of the next administration, whoever wins, Chair Powell’s place is secure. A new Fed chair could very well shift the FOMC’s reaction function at the margin, and each president and Senate get to express their views about the best candidate. But the institutional process is designed to guard against the extreme case of a Fed that is directed by the White House instead of the dual mandate.
UBS: Commercial real estate and shadow banking: what we worry about... and what we don't
… We do not think US CRE credit losses pose a financial stability risk (Figs 1-6) US CRE property values were estimated at ~$20tn in late 2023, backing CRE debt of ~ $5tn; for comparison, EU CRE figures are about 55%/40% lower at EUR ~9tn and 3tn, respectively. The largest holders of CRE equity, namely open and closed-end funds, are most at-risk. But overall US (and EU) CRE debt is still a smaller share of GDP at ~20% (~15%). For comparison, US C&I and mortgage debt are ~50-55% of GDP. The largest US sub- sector is multifamily at ~$2tn, of which half is backed by agency/ GSE pools and implicitly lower credit risk. The US office sector is under the most pressure from higher delinquencies due to rising vacancy rates and falling property values. For US, office property values are estimated at ~3tn, backed by about ~0.75tn in debt. For context, a 50% decline in office property values, or $1.5tn unlevered, is less than the ~$2tn rise in the value of the S&P 500 in month-to-date. Focusing on office (and downtown retail) debt of ~1.1tn, about two-thirds (0.7tn) is held by banks, of which 71% (0.5tn) is on the smallest bank balance sheets (below $100bn in assets)…
… A solid corporate outlook should ease shadow banking risks (Figs 15-18)
Wells Fargo: Soft Landing and Lower Interest Rates Emerge as Green Shoots for CRE in 2024
Summary Resilient Economic Growth Continues to Support CRE Demand The strength of the U.S. economy was a major theme throughout 2023. In a year marked by rising interest rates and predictions of a looming downturn, real GDP rose 2.5% in 2023 as a whole, above 2022's pace and slightly stronger than consensus estimates of potential GDP growth. The pick-up was largely owed to the U.S. consumer, as robust real disposable income growth resulting from a strong labor market and moderating inflation propelled spending. Considering these tailwinds appear to be carrying over into 2024, we believe that the U.S. economy will avoid a recession this year. While the risk of a downturn remains highly elevated, a moderate pace of expansion seems likely moving forward and near-term economic growth looks poised to remain firmly in positive territory.
Although property pricing and transaction activity continue to be negatively impacted by higher interest rates, the sturdy pace of recent economic growth appears to be bolstering commercial real estate (CRE) demand. Outside of the office market, net absorption continues to be positive, although demand looks to be normalizing back to trends more consistent with 2019 averages. During Q4-2023, net absorption for retail and industrial properties was weaker than in the same quarter in 2022. However, net absorption for both property types was generally on par with the levels seen pre-pandemic. Hotel room demand also moderated in Q4, but was still in line with 2019 levels.
What's more, multifamily net absorption appears to be normalizing after dropping at the end of 2022. Apartment demand softened somewhat in Q4, but net absorption still registered the second strongest final quarter of the year since at least 2000. Scarce resale supply and worsening affordability in the single-family market clearly have been boosting rental demand. Nevertheless, the strengthening in net absorption throughout 2023 indicates that subsiding inflation and solid employment and income growth is supporting household formation.
… And from Global Wall Street inbox TO the WWW,
Apollo: Comparing the Fiscal Position in the US and Italy (NOT a comparison what any of us in ‘Merica wanna wake up to but …)
The government budget deficit is bigger in the US than in Italy, see the first chart.
Government debt levels are currently higher in Italy than in the US, but according to IMF forecasts, they are converging over the coming years, see the second chart.
Government net interest payments are similar in the US and Italy, see the third chart.
Despite these similarities, Italy has a BBB rating, and the US has a AAA rating.
If the US continues on the fiscal trajectory forecasted by the CBO, the risks are rising that the US will be downgraded later this year.
Bloomberg: Dollar strength is looking like a new normal
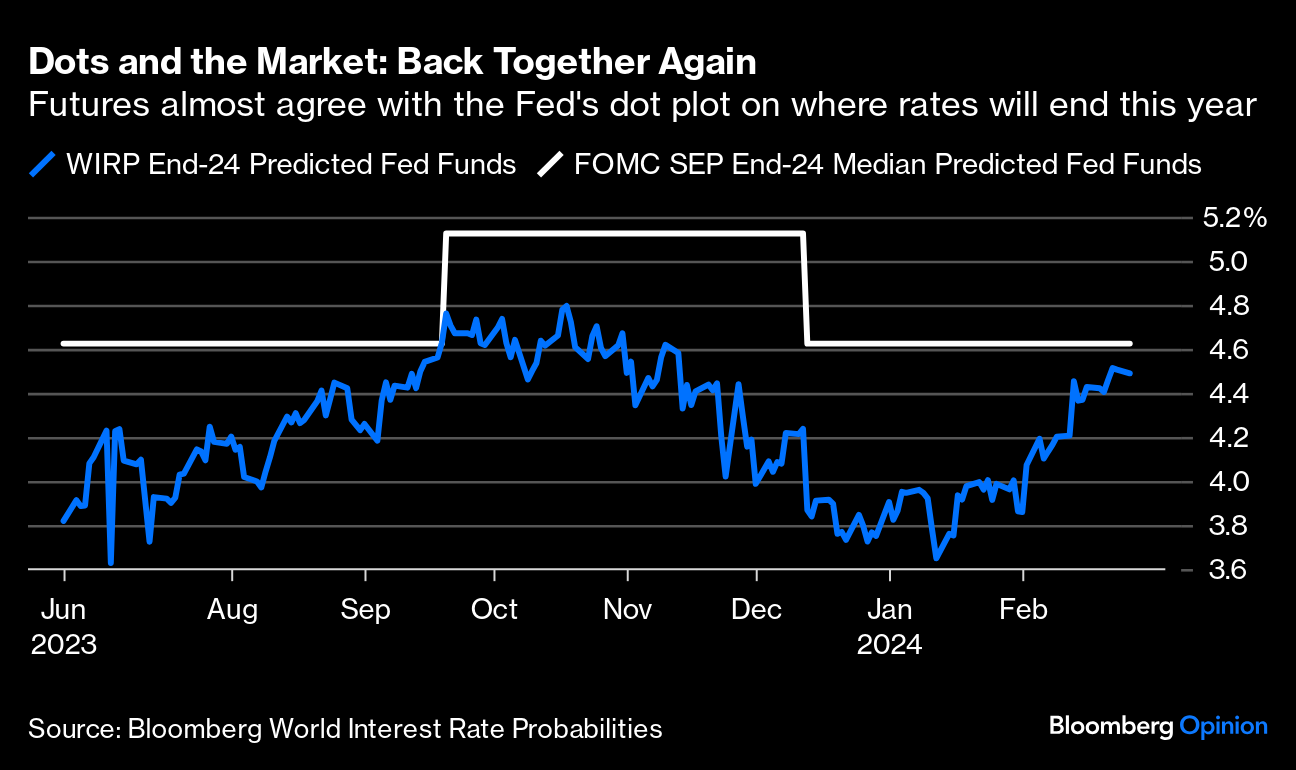
…Rate Expectations More recently, the prevailing high interest rate has also been a source of strength to the dollar. By now, we all know that rates aren’t coming down any time soon, with Bloomberg’s World Interest Rates Probability function, derived from fed funds futures prices, showing the odds for a rate cut by June have almost been eliminated.
At present, the market is in harmony with the Fed to the greatest extent in months, as traders and central bankers seem to be coalescing around a view that the fed funds rate will be about 75 basis points lower by year-end. The chart shows the median prediction for where the rate will be at that time, from the Fed’s summary of economic projections, updated every three months and known as the dot plot, against futures’ predictions. The cut in December’s dot plot unleashed heavy speculation that rates would fall far more; now the market has swung back into line. If the Federal Open Market Committee resists further revisions at next month’s meeting, rates might find some stability — at a level that supports the dollar:
The shift in expectations toward cutting rates later and by less than previously anticipated is boosting the outlook for the greenback, says Jefferies LLC’s Brad Bechtel, because it maintains the high extra yield that can be made in dollars compared to other major economies.
Data Regardless, the only rate action the market sees is a cut, rather than a hike — that’s never been in doubt. Bannockburn Global Forex’s Marc Chandler sees softer economic data in the coming weeks helping cap US rates.
At the same time, the technical condition of many of the G-10 currencies has improved and momentum indicators are turning higher. Growth impulses from are still faint in most other high-income countries, but the key, as seen in the fourth quarter of 2023, are the developments in the US.
In other words, if the US really does start to show deteriorating growth, bringing back a recession as a serious possibility that will weaken the dollar. Many of course expect something along those lines. However, the next important data point is expected to move in the other direction. This week will see the publication of the Personal Consumption Expenditures data for January. This is generally regarded as the Fed’s favored measure of inflation and, as colleagues from Bloomberg Economics show, it’s expected to take an active step up:
This matters because until now, the PCE has offered a rosier picture of steady disinflation than other better-publicized measures, as summarized in this chart from Win Thin of Brown Brothers Harriman:
If this is broadly accurate, then the belief that inflation is already licked could take another step back. But the expectations bar has also been shifted so that a lower-than-expected PCE could revive rate cut hopes. Either way, this matters to the dollar at a time when inflation seems to be settling in at a slightly higher level in the US than the rest of the developed world.
… A simple way to calculate the ratio is to take the total U.S. stock market value and then divide it by the annualized GDP.
Calculating this ratio back a few decades, we can immediately see some interesting trends. During the dot-com bubble in ‘99 and the zero-interest hype of ‘21, the Buffett Indicator was two standard deviations above the historical trend line, highlighting that the market was significantly overvalued (before the crash). At the same time, the indicator is not foolproof, as it was barely above the historical average just before the Global Financial Crisis.
As of today (25th Feb 2024), the Total Stock Market index is at $50.1 Trillion, and the annualized GDP is ~ $28 Trillion. This brings the Buffett Indicator to 178%, suggesting the U.S. stock market is overvalued.
Sam Ro from TKer: Warren Buffett's greatest trade (not what you think — AAPLE — but as always, a great recap and look at macro cross currents…)