weekly observations (02/26/24): Uncle Warren's got lots of cash; rates forecasts were meant to be revised (thats why I never made 'em...)
Good morning / afternoon / evening - please choose whichever one which best describes when ever it may be that YOU are stumbling across this weekends note …
First UP a couple / few Berkshire Hathaway related links
Bloomberg: Buffett Sees No Chance of ‘Eye-Popping’ Results With Record Cash
CNBC: Berkshire Hathaway operating earnings jump 28% in the fourth quarter, cash pile surges to record
CNBC / SCRIBD: Warren Buffett's 2024 annual letter to shareholders
FT: Warren Buffett admits Berkshire’s days of ‘eye-popping’ gains are over
… with this in mind, I’ll just say over the course of MY rates centered career I’ve never followed him closely but do have standard expected level of respect for his investment prowess. I ALWAYS found him able to afford himself opportunities that weren’t avail to the rest of us (think some of the funding deals he made back in GFC for example, with Goldilocks…) and at the same time braggin’ on politics where he paid less than his secretary in taxes.
THIS always bothered me as nobody was EVER stopping him from writin’ the check.
ACTIONS, IMO, continue to speak louder than his words … be that as it may, MSM will fawn over any / ALL his words and attempt to play along with his deeds pouring over his filings and letters.
Given his deed of having RECORD CASH on the books …
… and the cavalier attitude of what’s best for THEE may not be so for ME — can anyone, anywhere BLAME the guy for holding cash and in RECORD AMOUNTS as he’s now being compensated to DO SO??
When or IF that will change is beyond me but it does remind me of a great song … and so now, we must all pause and reflect on Uncle Warren’s greatest stockpile of cash EVER … in context of choosing to NOT make an investment choice … or is he …
… If you choose not to decide
You still have made a choice …
He … and many others playin’ along at home … have and will continue to make a choice…
Whatever. Back TO boring world of rates and with regards to the BID for bonds at weeks end, NatWEST …
… Treasuries broadly rallied today in a bull flattening move that was led by an 8bp leg lower in 30y yield. The week’s most significant curve move comes amidst no significant data released in the US and the fewest Fed speakers (one) in the last two days, leaving us searching for a driving factor. Some color from our trading desk prognosticates that the long end bid might be an asset reallocation into longer USD denominated products, although this wasn’t quite substantiated by moves in currencies (as we’ll touch on below). Additionally, steepener type of trades have been very popular, but painful to hold and these moves could be from unwinds of those as well. But to be fair, gilts and EGBs also rallied today in even greater scale, so it may be just as likely that global markets are coming off a bit from the sharp Feb declines, which for Treasuries means a breather from the near 40bp move in 30s seen this month. This could especially be the case ahead of next week’s PCE (although our economics team expects the risks to fall on the high side of the 0.4% consensus reading following strong CPI and PPI). The only Fedspeak today certainly didn’t alter the move – Fed’s Williams said that rate cuts are likely later this year and that hikes aren’t in his base case.
… with THAT in mind, lets go TO THE Axios interview …
Axios: TRANSCRIPT: New York Fed chief John Williams on rate cuts, home prices, AI and onions
… Axios: So with all that said, what does that mean in terms of what you're thinking about for rate cuts this year?
Williams: So we really want to see the data continue to move in the right direction. We've seen a lot of progress over the last year or two now—both on the labor market and on the inflation front. And like I said, things are moving [in] the right direction. I just want to see that continue.
At some point, I think it will be appropriate to pull back on restrictive monetary policy, likely later this year. But it's really about reading that data and looking for consistent signs that inflation is not only coming down, but is moving towards that 2% longer-run goal.
I don't think there's any formula, or one indicator, or something that will tell you that. It's really looking at all the information together, including these signs in the labor market and others and extracting the signal.
… Lots to noodle over here and one obvious thing stands out — seems to ME to be an important distinction to be made — easing policy / reducing policy restraint VS cutting of rates.
Betting on 7 rate CUTS not same as reducing restraint and … well … we see in real time how THAT all is playing out.
Be that as it may, the bond market BID at weeks end escaping reasonable explanations and so I won’t labor the point but instead, will simply look ahead TO the week ahead.
There is a supply double-header with 2s and 5s auctioned on Monday with 7s right behind on Tuesday. This would seem to ME to be natural curve flattening input — call it a concession if you’d like — and perhaps that was some of the price action at work as the week came to a close.
Jumping in with a couple / few visuals of 2s and 5s (daily and weekly) where I’ll note that it’s good NOT to make a forecast and throw darts because once wrong, you’ve got to market your view to the market — see JPM below for most recent example — and I’ll hide behind an effort to stay in the moment, assessing where it is in my humble, NO LONGER PROFESSIONAL view, the path of least resistance lies … As always, sizing of your positions and YOUR timeframe and tolerance is KEY …
2yy DAILY — bullish setup, 4.80 and then 4.90 support
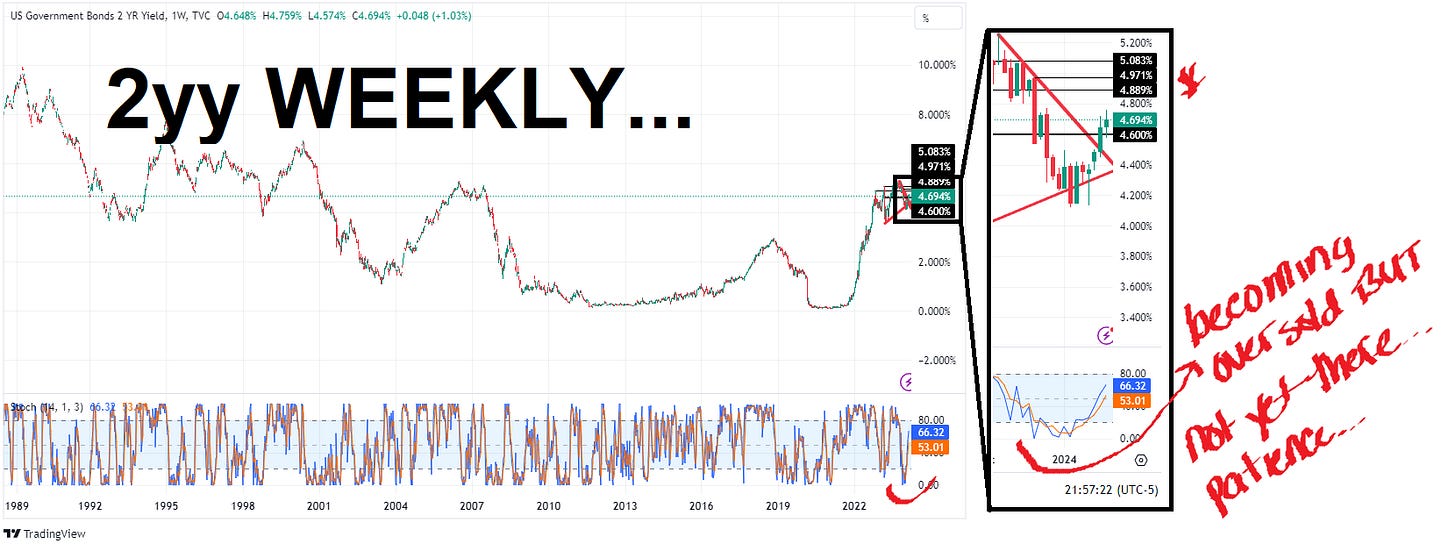
2yy WEEKLY — quite the opposite with momentum remaining quite BEARISH and a cluster of ‘support’ up nearer 5.00%
5yy DAILY: momentum crossing bullishly from oversold levels, I’d watch 4.40% …
5yy WEEKLY: bearish momentum remains, watching 4.50% supp
… I’ll have some sorta update on 7s Tuesday and for now, I’ll move on AND right TO the reason many / most are here … some UPDATED WEEKLY NARRATIVES … some of THE VIEWS you might be able to use.
NOTE — JPMs revisions were out earlier on in the week and these upward revisions ARE STILL QUITE BULLISH relative TO closing levels AND … THEY are not alone. TD out with similar feel / vibe — revising HIGHER a call and yet, we seem to lose sight of the fact that they are still quite bullish … in any case, THIS WEEKEND, a couple / few things stood out to ME …
BAML rates weekly, “Cut it out” (patience is a virtue…)
… Rates: What’s the rush?
US: Risks to higher rates near term stem from strong data, easy financial conditions, and risk of more hawkish Fed commentary …… Bottom line: We recommend investors hold back on adding duration until 10y is closer to 4.50%. Front-end pricing can push higher underpinned by Fed communication shifting more hawkish on recent data, but levels currently are more risk neutral. Bear-steepening can become a risk if higher-for longer challenges macro conviction in dip-buying, compounds interest rate costs, and if QT taper timing gets pushed out.
BMO rates weekly, “Leaping into March“ — booked PROFIT in 2s30s flattener and getting SHORT 10s @ 4.25 (tgt 4.40%, stop 4.18)
Citi Rates Weekly, “The pain trade is the flattener” (you don’t say …)
… The pain trade in rates space is a continuation of the flattener. A combination of higher asset valuations, a Fed on hold, recession worries getting pushed out and relatively benign structural, i.e. long-term inflation dynamics argue for continued flattening. On the latter point, a diffusion view of inflation sectors, which we originally published in the 2024 outlook and updated with the Jan CPI data, confirms that the longer-term inflation picture is still benign…
JPM: Revising our interest rate forecasts (out Thursday, 2/22 … when the facts change, Global Wall changes — marks to market — what do YOU do … somethin’ somethin’ …)
… We raise your year-end targets to reflect greater risk premium and a longer QT runway than previously expected. We raise our year-end 2-year Treasury forecast from 3.25% to 3.80% and our year-end 10-year target from 3.65% to 3.80%, implying less steepening than we had previously expected …
… The 5-year note stays under bearish pressure, but has lost some momentum near the 4.30% 100-day moving average and 4.37% Oct 50% retrace. Even if the market runs the stop level for our current short strategy that sits just through that support, we ultimately expect a bullish trend reversal from no cheaper than the 4.45-4.515% support cluster and resumption of the developing bull market …
SocGEN FI Weekly, “The painful wait” (why yes, yes it is … and so, BTFD it is…interesting to NOTE the buy zone similar to the BMO cover short — aka BUY zone)
Same story, different week. Central banks continued to push back the timing of rate cuts, but we suspect the market’s further removal of rate cuts this week is more inertia rather than any new news. It has been a painful wait for those with long duration positions, with yields gravitating around our upside scenario forecasts of 4.25% on 10y UST and 2.5% on 10y Bund. We believe these are levels at which investors should comfortably increase their duration exposure as further upside risks to yields should be limited.
TD rates weekly, “Hurry up and wait”
… Following the change in our Fed cut expectations and projection for a softer landing, we now expect 10y rates to finish 2024 at 3.45%. Despite likely shallower rallies in rates, we remain buyers on dips as we view nominal 10s in the 4.25-4.50% range as attractive. We remain in 5s30s steepeners, 5y swap spread wideners, and 30y swap spread tighteners.
Sensing a coalescing of a view where lots of smart folks looking at 10s TO 4.25% to back up the truck and BUY for one reason (covering a short) and / or another … Kindly have at link and check out any / all nuance of BMO, JPM, SocGen and TD calls … AND more. MUCH, much more…
Moving along and away FROM highly sought after and often paywalled and Global Wall Street narratives TO a few other things widely available and maybe as useful from the WWW
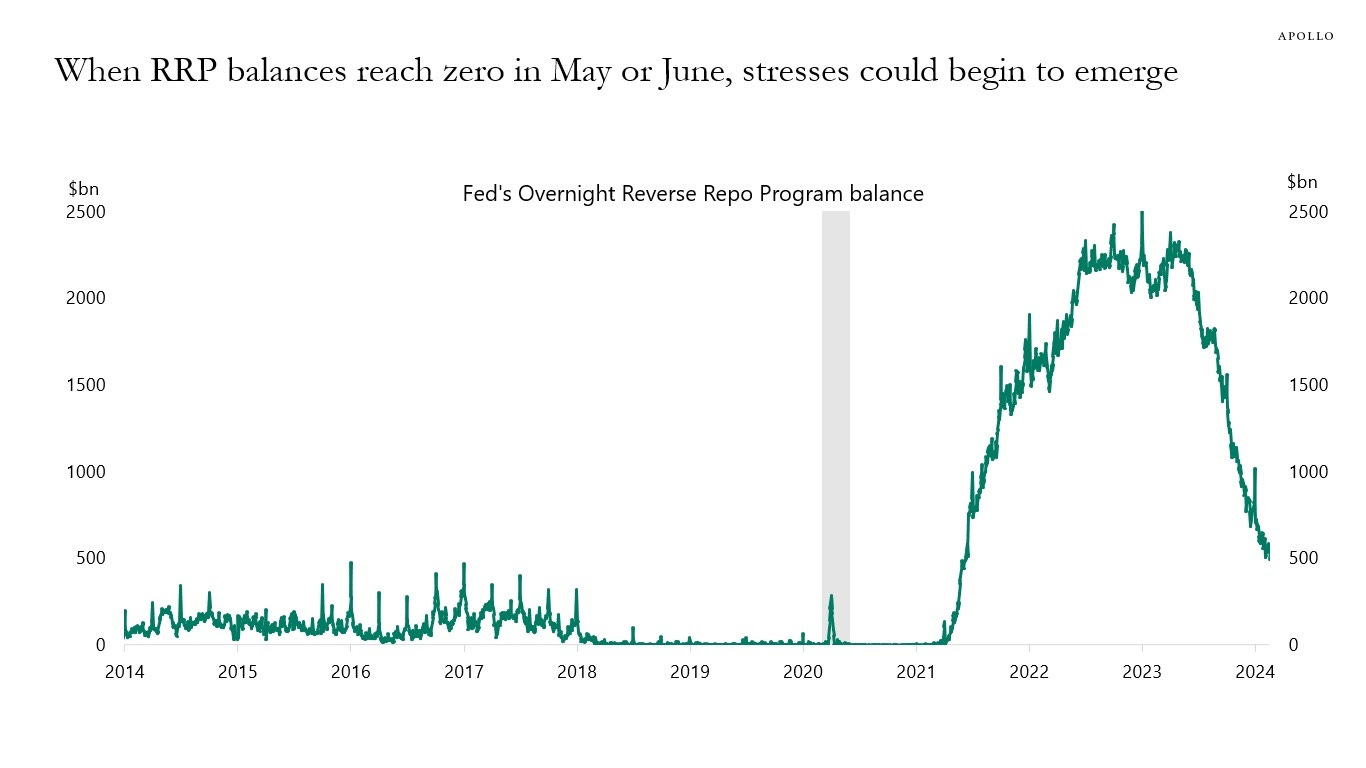
Apollo: What Happens When RRP Reaches Zero? (accidents happen, they say, but this one might very well be taking place in slo mo as we all watch on … at least that is what rate cut ‘ista’s are thinkin ‘bout)
The Fed’s Reverse Repo Program (RRP) is a measure of excess reserves in the banking sector. If banks have excess cash, RRP balances go up and vice versa.
With Fed cuts on the horizon, there is an emerging debate about what will happen once RRP balances reach zero, in particular if QT continues, see chart below.
The worry is that once there are no longer abundant reserves in the banking sector, then reserves will be scarce, and the consequences could be less support for T-bills, duration, and credit markets, or stresses in money markets similar to what we saw in September 2019.
The bottom line is that credit investors should keep an eye on RRP balances because as they are depleted, we will find out if reserves in the banking sector are scarce, abundant, or ample.
In short, once RRP reaches zero in May or June, there may no longer be abundant reserves in the banking sector, which increases the probability of an accident somewhere in the plumbing of the financial system.
Bloomberg: The Economic Time Bomb in Empty Office Buildings (specifically related TO latest from Apollo, just above…?)
Bloomberg: Boy, This Economy Is Hard to Read. Mea Culpa. (Conor Sen, OpED)
Hedgopia CoT: Peek Into Future Through Futures, How Hedge Funds Are Positioned (10yr and 30yr short covering…but still short)
Nordea Macro & Markets: The perfect soft landing is fading away
The consensus expects a perfect soft landing but that is an extremely tight rope to walk when there are upside and downside risks to the economy. Recent data indicate that upside risks are growing and that is a bigger problem than it sounds.
… The CPI report was uncomfortably firm and showed that core CPI prices rose by 0.4% m/m in January, which is the highest growth rate in six months. Core CPI services excluding housing, a measure that is tightly connected to the labour market, rose by an alarming 0.8% m/m. Prices of goods, which have been a large factor in lowering inflation, continued to fall. There are likely some technical quirks in the January inflation report, but the overall firm price pressure is hard to ignore. Inflation continued to broaden in January as a larger share of categories experienced inflation and a smaller share of categories experienced disinflation or deflation. The median core CPI figure, which measures the breadth of inflation, rose by 0.5% m/m and is showing a clear trend of rising inflation.
The upside risk should not be that surprising. The big rally across financial markets that began back in October has eased financial conditions and will be a significant growth impulse to an economy that is already too strong. Record-high prices on stocks and real estate will strengthen household demand and much lower bond and credit yields will make borrowing much cheaper today compared to just four months ago. The National Association of Home Builders (NAHB) just posted its third consecutive monthly gain and reported that buyer traffic is improving as even small declines in interest rates produce a disproportionate positive response among likely home purchasers. Similar pent-up demand was observed among US companies, which took advantage of lower longer-term borrowing costs, by issuing a record amount of corporate bonds in January. Important to consumers, oil and gasoline prices have declined by 20% since September, which is a decline that is unrelated to the US economy, but yet frees up a meaningful amount of cash for spending on other goods and services.
The upside risk scenario has two implications for the Fed. First, it strongly indicates that monetary policy is not that restrictive on the economy. Second, that means that there is no rush to ease monetary policy and stimulate the economy. Right now, growth concerns seem overdone, and the economy seems to be stabilising on a strong trend. Recent economic data flag the risk that the economy and inflation is actually accelerating. If that happens on a sustainable basis, then the next move could be an interest rate hike instead of a cut.
… AND for any / all (still)interested in trying to plan your trades and trade your plans in / around FUNduhMENTALs, here are a couple economic calendars and LINKS I used when I was closer to and IN ‘the game’.
First, this from the best in the strategy biz is a LINK thru TO this calendar,
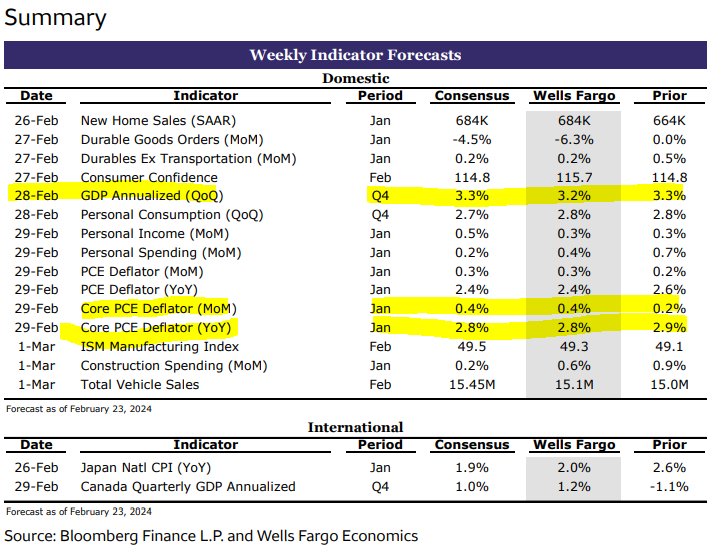
Wells FARGOs version, if you prefer …
… and lets NOT forget EconOday links (among the best available and most useful IMO), GLOBALLY HERE and as far as US domestically (only) HERE …
THAT is all for now. Enjoy whatever is left of YOUR weekend …


https://youtu.be/hJxnjKD1CBs?si=WMwW_X0xdC9jHry3
Talking Data Episode #286: Is “Last Mile” the New “Transitory?”
Bianco Research
Will read soon..........
Wanted to post this:
https://youtu.be/jCNLUGmSqYs?si=8QUtJzEAt9mwisbd
Real Vision Daily Briefing Episode #976: What’s the Best Way to Hedge Inflation With Jim Bianco