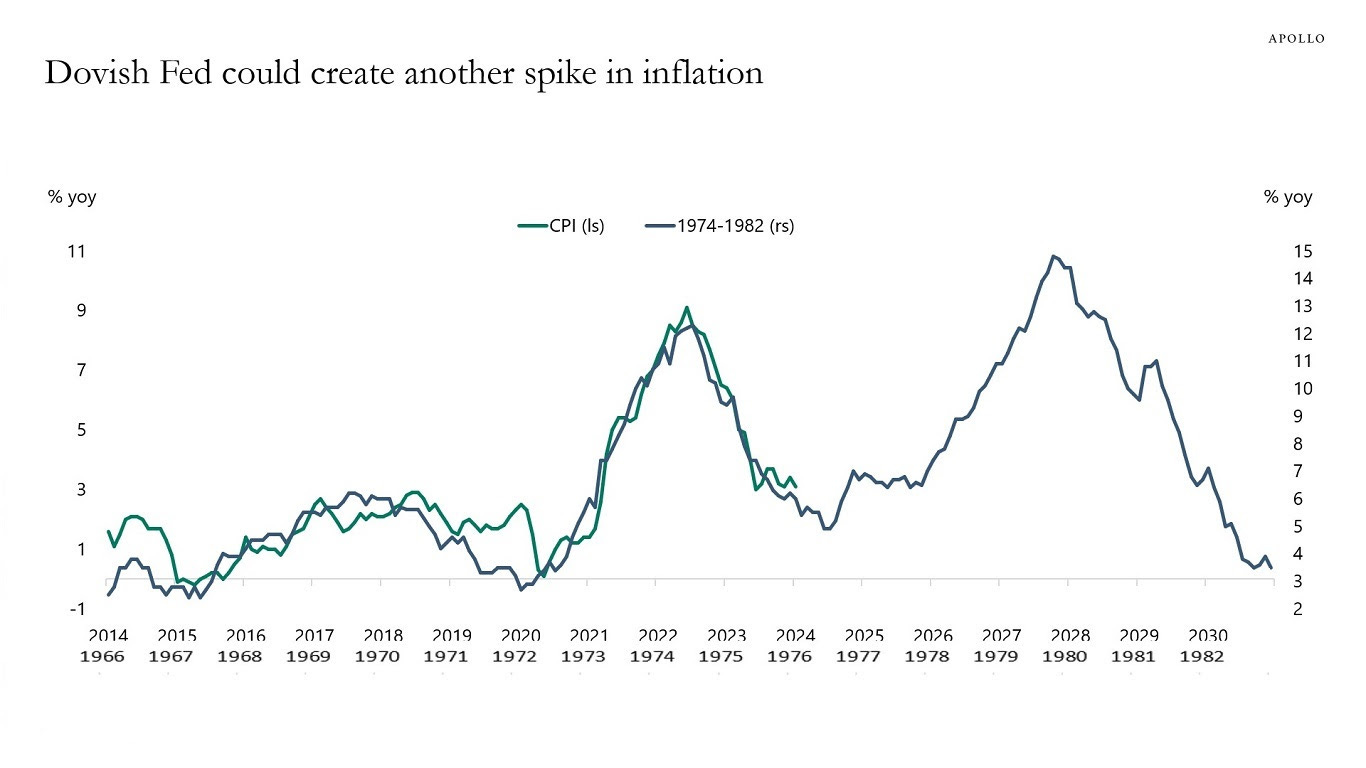
while WE slept: USTs mixed, curve twisting flatter on light volumes; sellers of 10s; geopolitics matter; and how a, "Dovish Fed could create another spike in inflation"
Good morning … In addition TO some news below of China un-deflation’ing, tight ranges and ECB comments, an early look at 3yy in addition TO weekly look over weekend (HERE)
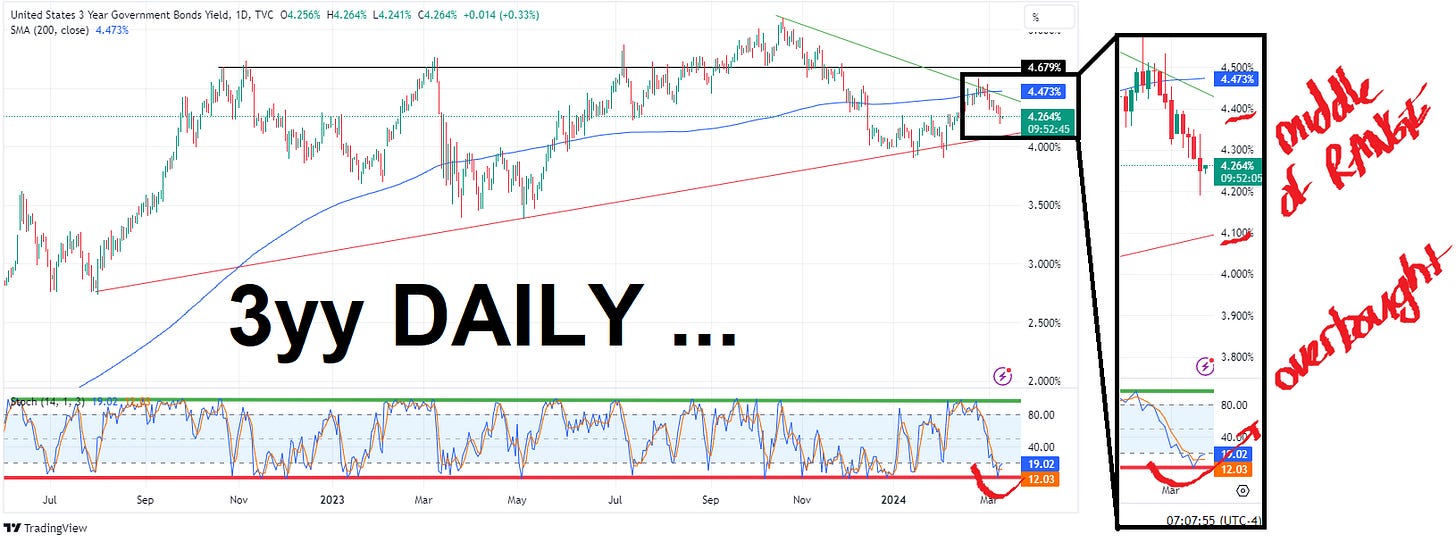
3yy DAILY: middle of range with bearish momentum ahead of supply where one positive is widespread anticipation rate CUTS (not an easing, remember, they are different) are imminent (as in next couple / few meetings = imminent)
AND … here is a snapshot OF USTs as of 705a:
… HERE is what this shop says be behind the price action overnight…
… WHILE YOU SLEPT
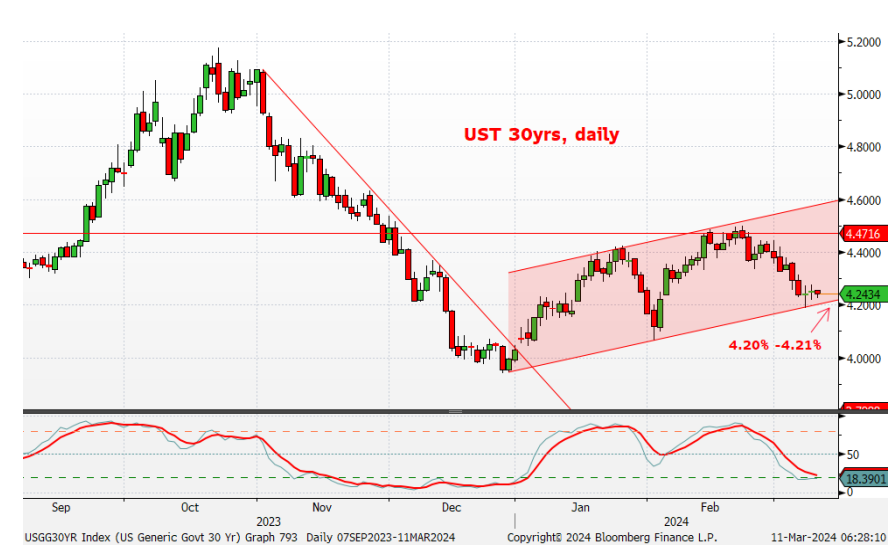
Treasuries are mixed with the curve twisting flatter around UNCHD 10yrs and ahead of a $56bn 3-year Tsy auction. DXY is UNCHD while front WTI futures are little changed too. Asian stocks saw gains in China and weakness elsewhere (especially in Japan after the BOJ's balk at an ETF buy operation), EU and UK share markets are all lower (SX5E -0.65%) while ES futures are showing -0.13% here at 6:45am. Our overnight US rates flows saw another subdued Asian session with real$ buyers in the front-end alongside selling in intermediates. After the London crossover, fast$ was a light seller out the curve with 3yrs lagging on curve ahead of their auction this afternoon. Overnight Treasury volume was ~75% of average across the curve…… our attention turns next to Treasury 30yr yields and whether they will soon break free of their bear channel in place since December 28th. The channel bottom or bear trendline intersects at 4.20% to 4.21% this week so here is one resistance level to watch this week.
… AND will come back to this one on Wednesday — AFTER CPI and 10s and ahead of long bond auction … and for some MORE of the news you might be able to use…
IGMs Press Picks: March 11 2024
NEWSQUAWK: US Market Open: Tech weakness weighs on European indices, JPY bid post-GDP & Bonds contained … Bonds are contained within relatively tight ranges; ECB’s Kazimir sparked a modest hawkish reaction …
Reuters Morning Bid: Nvidia, Nikkei knocked - China dodges deflation
Finviz (for everything else I might have overlooked …)
Moving from some of the news to some of THE VIEWS you might be able to use … in addition TO a compilation of Global Wall Street narratives offered over the weekend HERE), a few other things which Global Wall St is sayin’ and sellin’ …
BARCAP rates weekly, “Defying gravity” (worth a read ahead of tomorrows 10yr auction)
… Treasury yields have moved lower over the last few weeks and are now not far from levels that prevailed in January. We find this odd as economic data have surprised to the upside since then, on activity (growth forecasts are higher), labor markets (job gains forecasts are higher) and inflation (strong Jan core print). While the Fed still seems to be sticking to its baseline of cuts starting this year, the case for a meaningful easing cycle has weakened in our view raising the risk of the Fed forecasting a shallower easing cycle. Estimates of term premium are also not far from levels that prevailed late last year. Net supply of notes and bonds should ramp up over the coming months and in the more medium term, the Fed is considering reducing the maturity of its Treasury portfolio which also means more duration supply to investors.
We believe flows have exacerbated the move and recommend shorting 10y US Treasuries…
BARCAP China: CPI back to inflation on holiday distortions (they’ll take it however they can get it …)
The return of CPI inflation was driven in part by the different timing of LNY. Average Jan-Feb CPI inflation suggests goods deflation persists and services inflation remains soft, despite some recovery. We think CPI inflation is unlikely to sustain as the holiday effect fades, and we expect the PPI to remain in deflation.
February: 0.7% y/y for CPI, and -2.7% y/y for PPI
Bloomberg consensus forecast (Barclays): 0.3% (0.2%) y/y for CPI, and -2.5% (-2.5%) y/y for PPI
January: -0.8% y/y for CPI, and -2.5% y/y for PPI
BNP Sunday Tea: Disruptions (only thing that could upset the apple cart would be CPI)
KEY MESSAGES
Real yields have moved lower thanks to stable Fed messaging despite still solid growth momentum, setting up a positive backdrop for risk. We maintain our positive carry bias across asset classes.
The ECB also delivered a more dovish message than the market expected. We continue to expect 100bp of cuts this year, starting in June and stay in EUR-funded carry trades.
The key event risk this week comes from US CPI. A stronger-than-expected print would challenge our pro-risk bias.
… Inflation the risk once again: This week’s event risk comes from US CPI. A hotter print would disrupt market momentum by driving a bear flattening across core rates, a sell-off in risk assets and a broad strengthening in the USD, in our view. We remain long front-end real rates in the US but took partial profit last week (see US rates: Taking partial profit on long front-end TIPS, dated 6 March). We also find value in holding a EUR 9m30y ATM/+40bp payer spread as we head into US inflation week, taking advantage of YTD declines in gamma and 30y swap rates close to tactical lows.
CitiFX Techs: US stocks slide? It is not so grim yet.
Nasdaq Composite & S&P 500 posted bearish outside days off the trend highs on Friday. While this is usually a bearish indicator, we think we should look past it till we see additional indicators to support this narrative…
… To suggest a turn lower, we would like to see a cross lower from overbought territory on the weekly slow stochastics. It would be preferable to see a cross below key support levels to set a new “lower low” and suggest a break in the uptrend. Support levels:
Nasdaq Composite: 15452-15449 (Feb 21 low, 55d MA)
S&P 500: 4920 - 4908 (Feb 13 low, 55d MA).
… OTHER TECHNICAL DEVELOPMENTS
US 10y yields are testing the very pivotal 4.03% (55w MA), having slid past the 55d MA last Friday. A weekly close below would open a further ~25bps move lower towards subsequent support at 3.75% (Dec 2023 low). We illustrate the chart and more details in CitiFX Techs - Dollar’s on the verge of giving wayDB: Geopolitics: 2000 years of long-term charts (long term charts ALWAYS have my attention…an excerpt and a chart from the deck…)
This pack shows how the global geopolitical situation got to where it is today in the form of long-term charts and maps. It also tries to understand the likely paths going forward.
Geopolitics is heavily linked to the changing nature of economic, military and demographic power across the world. These tectonic plates can grind against each other for years or decades, before shifting dramatically and causing a major upheaval in the global balance of power. Since WWII, geopolitical risk has been ever-present but we have fortunately avoided a major global war, and today's era has been one of relative peace by historical standards. Nevertheless, there are signs that global tensions are building in a meaningful way again, as the global economic balance of power has shifted dramatically since the end of the Cold War.
As an example of the shifting geopolitical landscape through history, we show maps of Europe in the appendix covering every century from 1000 to 1700, and then with more regular frequency from 1780 as the modern world emerges.
Perhaps the biggest lesson from the pack and from history is that in the world of geopolitics and international relations, there are few permanent fixtures, only constant change.
… 6m moving average of the Geopolitical Risk (GPR) Index by component
Source: Caldara, Dario and Matteo Iacoviello (2022), “Measuring Geopolitical Risk,” American Economic Review, April, 112(4), pp.1194-1225, Deutsche Bank. Note: The Caldara and Iacoviello GPR index reflects automated text-search results of the archives of 10 newspapers. The index is calculated by counting the number of articles related to adverse geopolitical events in each newspaper for each month (as a share of the total number of news articles).
JPMs FI weekly (soundin’ a bit like ZH … perhaps there’s some ‘there’ there? NO just recap of what Waller did / did NOT say … whatever the case may / may not be, other side of the BARCAP get short 10s coin is JPM, also a seller, but here is to get outta 5yr LONG … same? NO … as much the same as rate CUTS being equal to Fed EASING)
…Treasuries
February employment picture raises the probability of a soft landing, but the pace of labor market rebalancing is a bit slower than we had expected. Rising growth expectations are supportive of higher yields
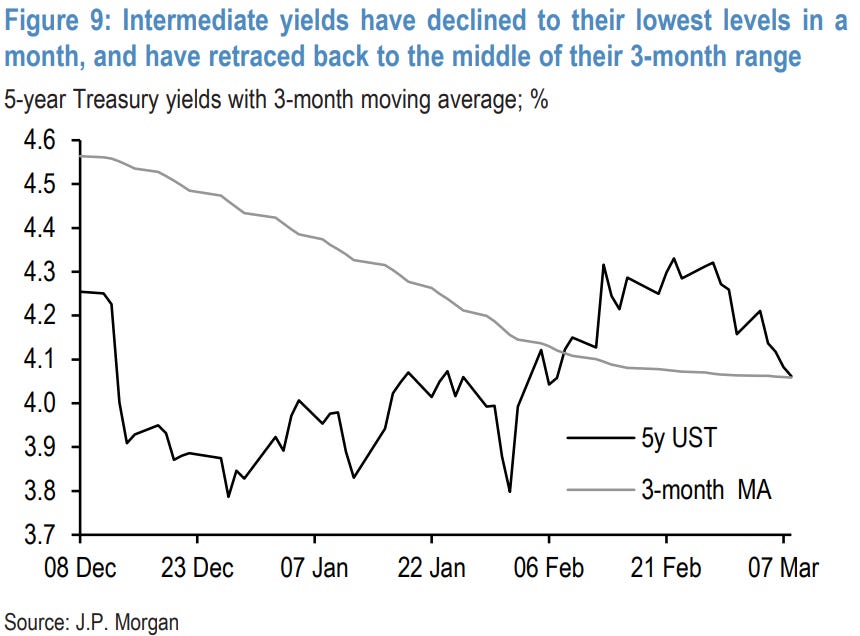
Yields are in the middle of their recent ranges and valuations appear fair in the context of the market’s Fed policy, inflation, and growth expectations, indicating two-sided risks to yields...
...while duration and curve positioning is cleaner now as well, also indicating two-sided risk over the near term. We are neutral on duration and recommend using extremes in ranges to add or reduce duration
Nevertheless, Fed on hold cyclicals suggest intermediates have room to outperform on the curve, and the belly is flagging as cheap: maintain 2s/5s flatteners and 5s/30s steepeners
Powell indicated he supports the Fed’s Treasury holdings shortening in duration over time, but over the “longer term” and this is a 2025 event in our minds, should it come to fruition
We review auction cyclical trading strategies. There’s limited evidence of long-end curve steepening ahead of long-end supply in recent months, but butterfly trades have generally been more consistently profitable. The profitability of auction cyclical trades has been small in recent months, particularly in the context of still-high delivered volatility…
Market views
Treasury yields declined 5-11bp over the week, with intermediates outperforming, similar to what we have observed in other Fed on hold periods…With these moves, Treasuries have retreated squarely into the middle of the ranges they’ve held the past three months, and range volatility has drifted to its lowest levels since early-2022, before the Fed embarked on its torrid tightening campaign …MS US Equity Strategy: Weekly Warm-up: Ambiguity and Liquidity
The fundamental backdrop remains ambiguous with many conflicting data points—i.e., classic late cycle. Asset prices, inflated by easier financial conditions and generous liquidity, have supported the bullish view. We stay up the quality curve and focused on operational efficiency.
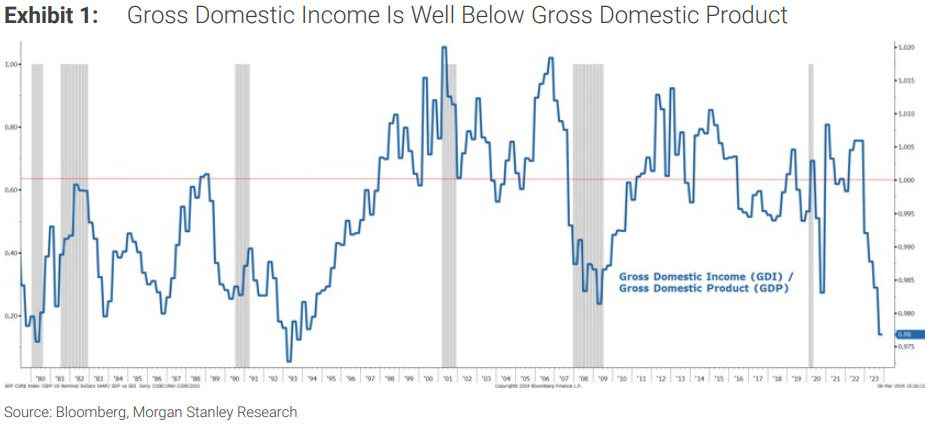
… One way to illustrate the increasingly ambiguous backdrop is the spread between Gross Domestic Income and Gross Domestic Product. Rarely do we see such a wide spread between two series that should be aligned conceptually, and historically such divergences do get reconciled. In short, the private economy will likely need to step up from a growth rate standpoint to match high expectations going forward.
As a result of the better than expected economic data assisted in part by fiscal stimulus, the Fed remains on hold with respect to its interest rate policy in an effort to avoid restoking inflation. However, rates remain quite high for many businesses and consumers, particularly those with leverage. We note that the Fed Funds Rate is well above both the 10-year and 2-year Treasury yields. This inversion is a signal from the bond market that the Fed may be too tight. Borrowing costs are very high for many companies and consumers which is why rate-sensitive areas of the market/economy have faced headwinds.
MS The Weekly Worldview: The Fed's Influence
The Fed is on track to cut in June, but if they delay, what would it mean for other central banks?
… For the Fed, we think it would take either inflation’s decline stalling well above 2.5% or a reacceleration in the real side of the economy. But a related question is how a change in the Fed’s path might affect other central banks. One of the main channels through which the Fed’s monetary policy spills over to other economies is the exchange rate. In the euro area, our baseline view is that the ECB cuts in June, essentially at the same time as the Fed. But, if we are wrong, and the Fed moves later than June, our colleagues across the Atlantic have noted that the ECB will likely still cut the policy rate in June, but there would likely be fewer successive cuts in 2024 due to considerations about the euro. The issue for the ECB is not whether or not to cut, but how much cutting can happen in the context of a higher Fed path.
MS Sunday Start | What's Next in Global Macro: Private Credit – Competitor or Complement to Public Markets? (worth a look … but ultra SHORT version is private credit relying heavily on rate CUTS and while these private credit ‘istas know the difference of cuts vs EASE, don’t think for a minute they CARE as long as the prices for assets owned goes UP …)
… Given the higher overall borrowing costs as well the need to provide stronger covenant protection to lenders, what motivates borrowers to tap private credit versus public markets? In our view, three key factors explain the recent rapid growth in private credit and show how private credit both competes with and complements the public credit markets:
Small and medium-sized companies that used to rely on banks had to find alternative sources of credit as banks curtailed lending in response to regulatory capital pressures. A majority of these borrowers have limited access to syndicated loan and bond markets, given the modest size of their borrowings. Thus, as banks, particularly regional banks, withdrew, private credit lenders stepped in to provide capital access to companies unserved by the public market. As noted here, the average size of deals in private credit is notably smaller.
Because of the small number of lenders per deal – frequently just one – private credit offers speed and certainty of execution as well as term flexibility. These advantages have played an important role in the last two years of monetary policy tightening. The uncertainty around how high policy rates would go and how long they will stay elevated led investors to be cautious and pull back. For the BSL market, with its heavy reliance on sponsorship from CLOs, lackadaisical CLO new issuance meant that arrangers faced execution uncertainty.
The pressure on interest coverage ratios from higher rates resulted in a substantial pick-up in rating agency downgrades into the B-/B3 and CCC/Caa categories. Portfolio guidelines and the unique structural features of CLOs limit the appetite of CLO managers for such loans. Absent a CLO bid, private credit became the only viable source of financing for such deeply distressed borrowers. The refinancing in the private credit market of US$25 billion of CCC/B- rated public debt at par provides a telling illustration of the complementary role that private credit has played. While this by no means ensures that all companies with challenged business models and troubled balance sheets can get on the path to recovery, it is reasonable to think that private credit could help to smoothen default cycles.
Where do we go from here? With confidence growing that policy tightening is behind us and the next Fed move will be a cut, the conditions that contributed to deal execution uncertainty are fading. Public credit markets, both BSL and HY bonds, are showing strong signs of revival. CLO new issuance is also off to a strong start in 2024. Thus, the competitive advantage of execution certainty that private credit lenders offer may become less material. Furthermore, given the amount of capital raised for private credit that is waiting to be deployed ('dry powder'), the spread premium in private credit may also need to come down to be competitive with the public markets.
In summary, we see private credit as both a competitor and a complement to public debt. Its competitive attractiveness will ebb and flow, but we expect its complementary benefit as an avenue for credit where public markets are challenged to remain and grow.
Yardeni Market Call: The Front-Cover Curse Already? (more and more attention being paid …)
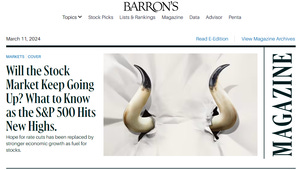
The front cover of this week's Barron's shows the horns of a bull apparently charging through a big white sheet of paper. Only the horns are visible in the picture. Usually a bull appearing on the front cover of a major financial magazine rings alarm bells for contrarians, who view such events as major sell signals. However, the editors of Barron's might have dodged this front-cover curse by hiding the bull's face.
To their credit, our friends at Barron's ran a remarkably prescient cover story on October 27, 2023 titled "It's Time to Stop Crying About Bonds and Buy Them Instead." That was truly among the great calls in financial market forecasting history. We started to like bonds at 4.25% last year before they spiked up to 5.00% near the end of October. We then thought that buyers would be attracted to such a high yield. They were and now the yield is back down to 4.09% (chart). We are neutral on bonds figuring they will trade between 3.75% and 4.25% for a while.
Semiconductor stocks took a breather on Friday as Nvidia dropped $51.41 (5.6%) to $875.28 (chart). That same day, our friend Cathy Wood told Bloomberg Businessweek Radio that semiconductors are due for a correction. We've previously observed that the industry is prone to double and triple ordering when there are shortages of popular chips. That sends their prices up. Then supply catches up with demand and prices come back down. Cathy observed that supply of the GPUs that run AI software programs may be increasing relative to demand…
… And from Global Wall Street inbox TO the WWW,
Apollo: Is the Fed Done Fighting Inflation? (hitting inboxes on a Sunday with this one makes ME think Torsten’s feed may be worse … or better (?) than mine …)
Since the Fed turned dovish in December, financial conditions have eased dramatically, with the S&P 500 reaching all-time highs, credit spreads tightening, IPO activity picking up, and M&A activity picking up. As a result, consumer spending is currently getting a strong boost from record-high stock prices, high home prices, and record-high Bitcoin prices combined with high cash flows for owners of fixed income. The bottom line is that a dovish Fed giving the green light to investors too soon could result in a second mountain in inflation. That is the reason why the last mile is harder.
Bloomberg: Bond Traders Eye Key US Inflation Report to Game Out Next Bets
Ambiguous February labor market reports puts focus on CPI data
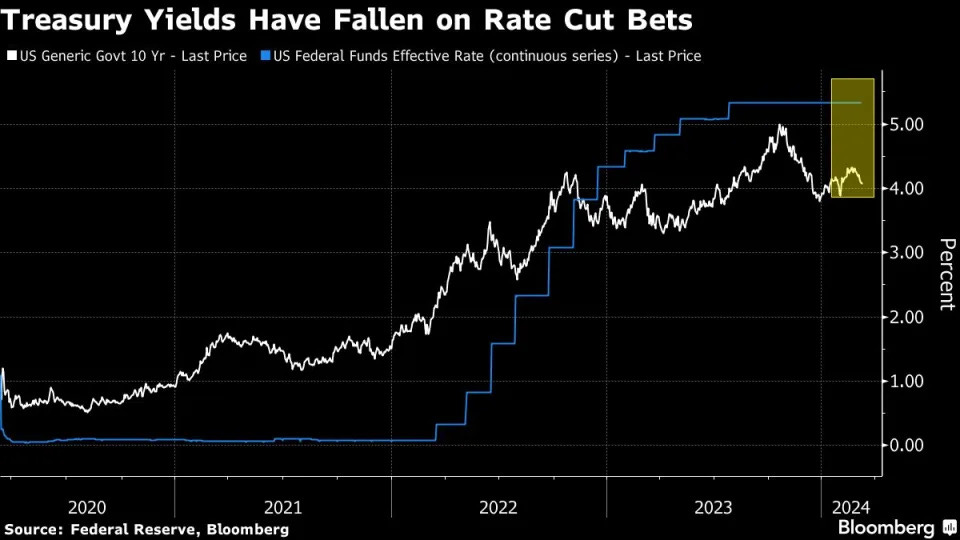
Treasury yields have rallied since hitting 2024 highs in Feb.
… Allianz’s Ripley said the firm entered 2024 expecting 10-year yields to swing between 3.75% to about 4.25% in the near term. When rates earlier this year jumped above that peak, his firm found the securities “pretty attractive.”
Because of the Fed’s customary blackout period ahead of its upcoming March 19-20 policy meeting, economic data will prove pivotal in shaping traders’ expectations. Meanwhile, fresh supply may also influence investor sentiment. The US Treasury department will sell a combined $61 billion in 10- and 30-year debt through auctions on Tuesday and Wednesday…
Bloomberg: Barclays Says Sell US Treasuries After ‘Excessive’ Bond Rally
(Bloomberg) -- Investors should consider selling 10-year Treasuries as the resilience of the world’s largest economy makes the recent US bond rally look overdone, according to Barclays Plc.
Yields on the global funding benchmark have fallen nearly 30 basis points from this year’s peak of 4.35% as traders bet the Federal Reserve will cut interest rates sooner rather than later. The drop in yields is “odd” given US economic data have proved stronger than expected in recent weeks, strategists including Anshul Pradhan and Amrut Nashikkar wrote in a note.
“Incoming data suggests that the US economy remains resilient with the labor market generating solid real income growth while simultaneously rebalancing for now,” the strategists wrote. “The rally over the last few weeks seems excessive and we recommend shorting 10-year US Treasuries.”
Bloomberg: Softer — but not soft enough for the Fed to cut (yet) (Authers’ OpED — couple graphics and points on FriYAYs NFP …)
Macro Miasma
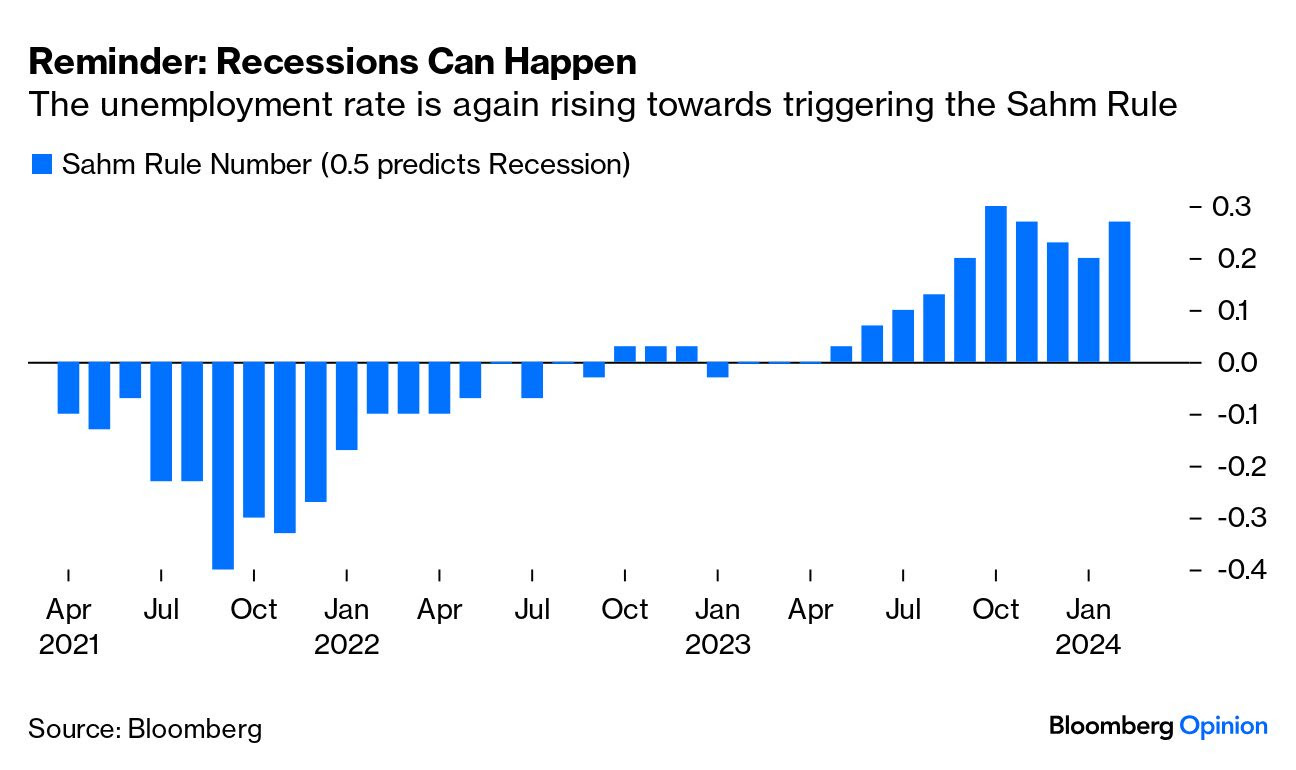
So maybe we don’t need to worry that the plane won’t land at all. If you wanted evidence that the labor market was at last calming down in a way that would eventually allow the Federal Reserve to cut rates, it was there in the US unemployment data Friday. Most importantly, given the weight put by the central bank on the risk of overheating wage inflation, average hourly earnings saw their lowest month-on-month rise in two years. That tended to support the notion that January’s reading, much higher than expected, had been a fluke:Meanwhile, the unemployment rate ticked up. This matters, as a rising unemployment rate is the basis for the so-called Sahm Rule (named for Bloomberg Opinion colleague Claudia Sahm) for gauging the risk of a recession. Based on the historical experience that when unemployment rises a certain amount it will tend to tip much higher, the rule holds that when the three-month rolling average unemployment rate is more than 50 basis points above the lowest point of the preceding 12 months, a recession is starting. After falling for three months, this number rose back to 27 basis points, a level that still implies that a recession is far from inevitable, but does tend to reintroduce the possibility once more:
If you were actually waiting for a sign that the Fed can start cutting rates after all, this was more or less exactly what you should have wanted — an excuse for a “bad news is good news” rally, in which the prospect of lower rates drowned out the negative implications for the economy. It didn’t happen that way, with the stock market slipping — although after its recent surge, there’s nothing too worrying about that. Nvidia Corp.’s market cap dropped almost $120 billion on Friday, but that still left it up $210 billion for the month.
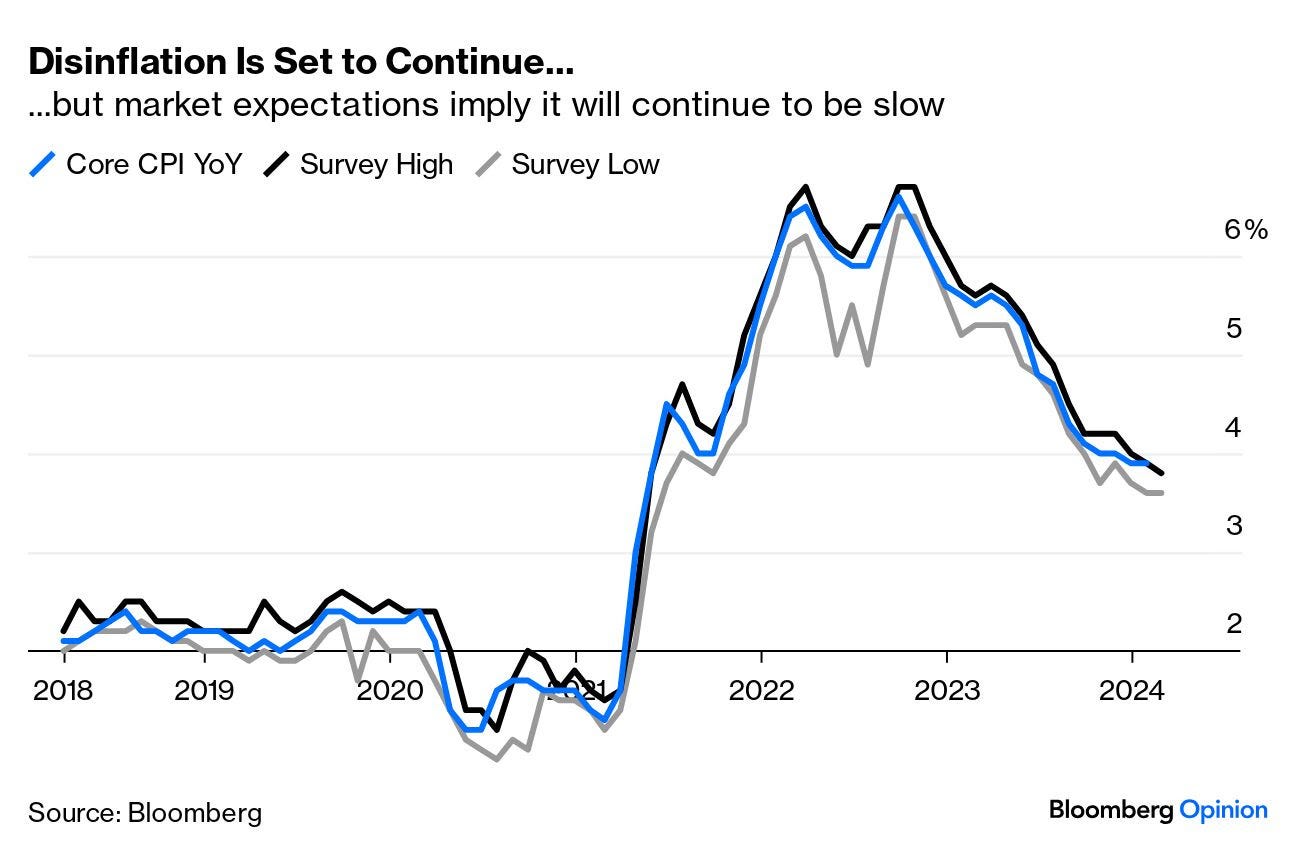
… Another reason the numbers didn’t have more impact is that they will be followed Tuesday morning by consumer price inflation data, which is more important. The expectation is almost universal that disinflation will continue, but at a snail’s pace. Any whispered-about strength would cause a scare. That probably explains why the bond market didn’t react to the possibly good news on rates, while stocks didn’t like the idea that maybe the economy was going to land after all:
Hedgopia CoT: Peek Into Future Through Futures, How Hedge Funds Are Positioned (10yr spec short base UP over 7% WoW, 2wk HIGH but check out magnitude of move in spec bond position…RATE OF CHANGE > actual position but still …)
… AND a wish / dream for this ‘stack into the future … it becomes shorter and more to the point and speaks in a language everyone can understand … like this guy
… THAT is all for now. Off to the day job…












Great article....
Can't help but think that the Bonds are
Over Bought...
Inflation comes in a little high, Bonds
Sell off and Stocks follow??